This time was not different: the Fed hiked until something broke
Silicon Valley Bank was the second-largest default of a US bank in modern history. In our view, there is no threat to the overall banking system, but the dynamics will remain negative for smaller US financial institutions. The banking sector weakness in the US stood in sharp contrast with strong credit creation in China. In geopolitics, China promoted a deal between Iran and Saudi Arabia, significantly increasing its clout in the region.
Global Macro
Silicon Valley Bank (SVB), the 16th largest bank in the United States (US) with c. USD 208bn in assets was taken over by the Federal Deposit Insurance Corporation (FDIC), an independent agency created by Congress to maintain stability and public confidence in the financial system. The demise of SVB is a tale of poor risk management by the bank’s treasurer alongside the monetary policy whiplash by the Federal Reserve (Fed). The bank’s assets doubled in 2021 when venture capitalists were awash with liquidity, fruit of the partial reopening of the economy (while the service sector was shutdown) and helicopter money promoted by the US Treasury and the Fed. The management of the bank opted to invest most of the windfall deposits in fixed rated instruments which were considered safe, such as mortgage-backed securities (MBS) and classified them as hold-to-maturity (HTM) assets on its balance sheet. Since last year, SVB had been suffering deposit redemptions because of a collapse in cash available in the tech and venture capital systems. At the same time, the Fed was hiking policy rates by 425 basis points (bps) after having provided forward guidance for only 75bps of hikes, leading to severe losses in the disposal of the long-dated instruments.
On Sunday, Signature Bank (SB) also collapsed due to similar problems, after which the Fed, US Treasury and FDIC released a joint statement where they pledged to give access to 100% of non-secured deposits from both banks, while shareholders and certain unsecured bondholders (presumably holding company bonds) would not be protected.1 The statement said there would be no loss borne by the US taxpayer, as any losses to the FDIC would be covered by a tax levied on banks.2 In a separate press release, the Fed created a credit line called Bank Term Funding Program (BTFP) offering loans of up to one year at the Secured Overnight Financing Rate (SOFR) +10bps against collateral in the form of US Treasuries (UST), agency debt and MBS at par. Providing cheap funding at par allows banks to monetise their HTM assets instead of selling them at a loss. The Treasury is providing USD 25bn to the Exchange Stabilisation Fund as a backstop for the BTFP.
Thus, regulators can claim they are avoiding a moral hazard while backstopping a massive run on bank deposits that could turn the failure of some small, poorly run banks into a systemic risk. However, this is not cost-free. First, large banks may have to pay the cost of the depositor bailouts. In the case of SVB, the cost will be small. SVB has a simple balance sheet that does not seem to be overly leveraged. Notwithstanding the likelihood of wiping out equity and subordinated debt holders, there is a moral hazard element in the bailing out of depositors: In a functioning banking system, banks should compete for deposits and all stakeholders should be on the line in case of mismanagement. The consequence is that regulations for the sector will tighten, increasing the risk of overregulation and the stiffening of conditions for the good players. But this is a price worth paying to avoid a bank run.
For completeness, this does not represent the return of quantitative easing (QE). Sure, the balance sheet of the Fed may expand, but will do so in a way that the banking system is forced to de-risk, while in QE the system has an incentive to increase risk taking. When a central bank carries out QE, it buys a security from a bank, which is now left with riskless reserve assets and will seek to replace that with either a similar or riskier security. Thus, in the classic QE flow, adding fresh money into risk assets leads to lower risk premium. If BTFP becomes operational, it is because depositors will be withdrawing funds from banks to invest in (higher yielding and saver) money market funds and banks will be using their assets as collateral to a loan from the Fed to repay the depositors. This will force the bank to de-risk its balance sheet, disincentivising risk taking. Counterintuitively, this process may lead to a steepening of the curve, but a bear steepening as the de-risk increases the chance of a sharper economic slowdown, which puts downward pressure on the front end of the curve.
Despite the good deed of the actions, alas we don’t believe the banking system is out of the woods with the bailouts of SVB and SB. Bank collapses, even if well managed, tends to leave a scar in the country’s financial system, and this is the second-largest bank collapse in recent history (behind Washington Mutual in 2008). The trauma was related to several high-profile failures in the cryptocurrency space, including a high-profile fraud in one of the largest crypto brokers – FTX. Beyond the crypto and venture capital community, social media will propagate the dramas played out by the bank failure, just as digital banking makes moving resources much more convenient. Hence, unless the Fed decides to U-turn again and open the liquidity spigots (unlikely in the short-term considering current inflation levels) the problems in the system will persist.
Despite the implicit protection of depositors, the volume of deposits in the system is much larger than the guarantees currently provided. There is USD 5.46trn of securities (23.9% of bank assets), of which USD 1.38trn is held by small banks (20.4% of small bank assets). Against that, the Fed capitalised the Exchange Stabilisation Fund (ESF) with USD 25bn. Even if you lever the ESF by 10x, the volume sounds small compared to the system’s needs. And the fact that non-depositor liabilities are not guaranteed keeps all creditors to the banks nervous. Why would anyone keep their assets in a small bank in this environment? If investors redeem their assets to invest in (higher yielding and safer) money market funds or in global systemically important banks (G-SIB), the small banks will be forced to de-risk their balance-sheets as they borrow money from the BTFP.
The big risk in the balance sheet of these banks is not poorly run banks getting too much exposure to HTM, MBS and UST below par (now addressed by Fed bailout), but commercial real estate. Small banks hold 30% of their assets in commercial real estate, as per Figure 1, a much larger concentration than large financial institutions. Furthermore, small banks have already lost 51% of their cash, or USD 463bn its peak while large banks lost 39% (USD 812bn) which forced them to lower their cash position from 14.1% of total assets to 6.5%, while large US banks still have 9.8% of its total assets in cash (down from 16.6%) and as per Figures 2 and 3.
Fig 1: Commercial real estate as % of total assets by segment
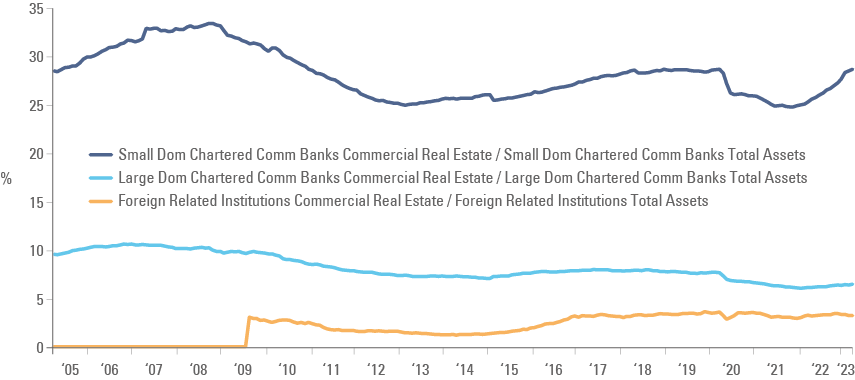
Fig 2: Cash position in the banking system, by segment
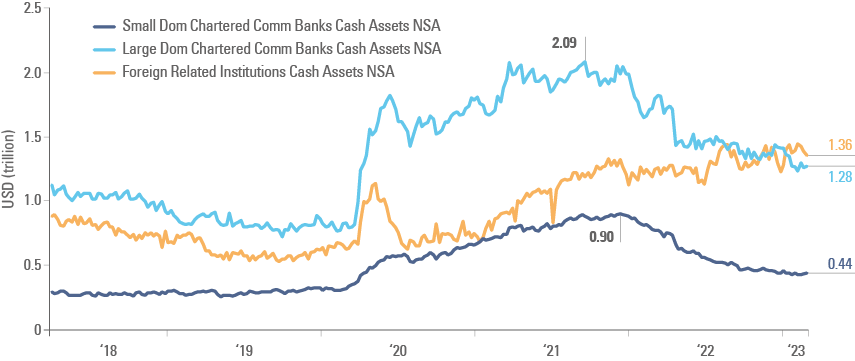
Fig 3: Cash position in the banking system, by segment, as % of total assets
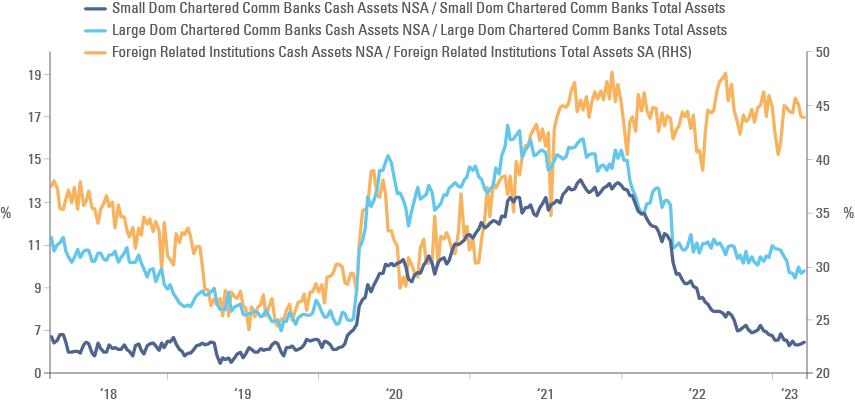
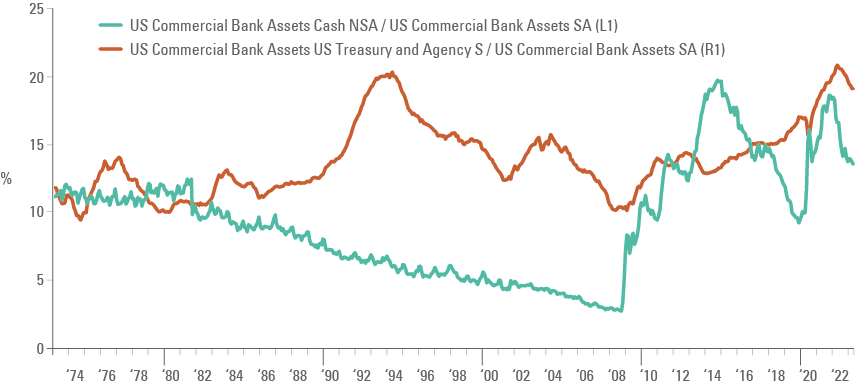
Nevertheless, the backstop mechanism is welcome, particularly if its size can be called up, as several other banks (including large ones) have similar problems in their balance sheet from the fast increase in interest rates as the system has approximately USD 600bn of losses in HTM and available-for-sale securities. Furthermore, this crisis should not pose a systemic threat, in our view. US banks have never had more liquidity than today, making a systemic crisis in the G-SIBs like 2008 hard to fathom. US banks held 32.3% of all their assets in cash, US Treasuries and agency bonds, the largest concentration since the inception of the series starting in 1972 aside from 2022, against only 13.5% in December 2007.
Fig 4: US Bank liquid assets
In conclusion, the insolvency of SVB presents a financial stability risk – to the extent that it increases the risk of a run on the deposits of small financial institutions, which have already lost a significant portion of balance sheet cash and have a larger share of commercial property in their assets – but not a G-SIB risk. The underlying reason that brought the SVB into insolvency should be relatively easy to be addressed by the Fed, in our opinion.
In macro terms, the Fed will have to provide liquidity against collateral, which is not QE. However, it will be very hard for the Fed to justify quantitative tightening and hiking policy rates in an environment where it must also provide ample liquidity to backstop the banking system. In our view, it would be hard to justify hiking rates (perhaps even by 25bps) as was priced by markets at the close last Friday. The yields on two-year US Treasuries collapsed 86bps in two trading sessions, and are now trading below 4.20% as the spread between the two-year and 10-year US Treasuries surged 43bps (now at -0.95%). The yield curve always steepens ahead of recession. Interestingly, the dollar index is down 1.5% in the same period of a US Treasuries sell-off. So, the classic ‘Dollar smile’ model when the USD outperforms when the US economy outperforms, but also in a recession, is slowly breaking down. Fundamentally, we may see the Dollar weakening further, since foreign investors hold 58% higher exposure in US equities (USD 11.5bn), than to US Treasuries (USD 7.3bn) and US capital market underperformance may lead to further outflows from US stocks.
Geopolitics
China has brokered a deal to normalise the diplomatic relationship between Saudi Arabia and Iran. The deal includes the reopening of the Saudi embassy in Tehran and the Iranian embassy in Riyadh as “The three countries expressed their keenness to exert all efforts towards enhancing regional and international peace and security”. The countries have been locked in a diplomatic dispute since 2016 following the execution of a prominent Shia Muslin cleric in Riyadh, and Iran was accused of drone attacks on oil facilities in Saudi Arabia.
In parallel, Saudi Arabia asked for security guarantees from the US and Israel, including asking for a civilian nuclear programme and fewer restrictions on US arms sales as quid-pro-quo to normalising relations with Israel.3 Saudi Arabia has already signalled its intention to normalise the bilateral relationship after opening its airspace to Israel after the Abraham Accords signed between Israel, United Arab Emirates, Bahrain, Morocco, and Sudan, which allowed for a large increase in travel and business between the countries. If successful we expect the deal would bring a big shift in the regional balance of power. Countries imposing sanctions on Iran were not part of the deal.
Both developments reflect the multi-polar world where China exerts a much larger influence over Eurasia, in our view. China is developing a strategic relationship with OPEC+ while its international oil reserves are estimated to be 3-4x larger than those of the US. Chinese Premier Xi Jinping also confirmed a meeting with Russian President Vladimir Putin and mulled a potential call with Ukraine’s Volodymyr Zelensky.
Emerging Markets
China: Despite the economic reopening, the producer price index (PPI) declined in year-on-year (yoy) terms by 1.4% in February after 0.8% deflation in January and consumer price index (CPI) inflation dropped 110bps to 1.0%. Total Social Financing rose by RMB 3.2trn in February, significantly ahead of consensus at RMB 2.3tn, led by RMB 1.8trn new RMB loans (RMB 1.5trn consensus) as credit impulse accelerated to 5.6% yoy from 4.6% yoy, the highest since January 2021. The cumulative trade surplus in January and February was USD 116.9bn, down from USD 193.6bn in the same period of 2022, but significantly above consensus at USD 82.5bn.
Mexico: CPI inflation declined to 0.6% month-on-month (mom) in February from 0.7% in January, leading the yoy rate down 30bps to 7.6%, but core CPI declined by a more modest 15bps to 8.3% yoy. The by-weekly CPI dropped to 0.15% mom in the second half of February from 0.3% mom in the same period of January, showing inflation remained at a declining trend in sequential terms. Vehicle production rose by 15k to 296k in February, but exports declined 8k to 230k over the same period. A total of 176k jobs were created in February after 112k in January. Consumer confidence rose by 0.5 points to 44.8.
Snippets
- Argentina: Industrial production rose 6.3% mom in January after dropping 2.7% in December, lifting the yoy rate of growth by 12.0% to 2.6% over the same period.
- Brazil: Vehicle production rose by 9k units to 161.2k in February as exports rose by 1k to 34k, but sales declined by 13k to 130k over the same period. PPI inflation rose 0.8% mom in February from 0.5% mom in January, but base effects brought the yoy rate down by 30bps to 5.5%. A total of 68k jobs were created in January after 431k people lost their jobs in December.
- Chile: The trade surplus declined to 2.0bn in February from UDS 2.6bn in January, in line with consensus, as exports softened by USD 0.6bn to USD 8.3bn and imports were unchanged at USD 6.3bn, but copper exports rose to USD 3.5bn from USD 3.0bn over the same period. CPI inflation declined 0.1% mom in February from 0.8% in January, taking the yoy rate down 40bps to 11.9% over the same period as nominal wages declined 30bps to 11.1% in January, still elevated levels.
- Colombia: Exports declined by USD 700m to USD 3.7bn in January. Finance Minister Ocampo said he will stay in his position until June 2024, at the request of President Gustavo Petro. Ocampo expects inflation to slow in March and is focused on complying with fiscal targets.
- Czechia: CPI inflation rose 0.6% mom in February from 6.0% mom in January as the yoy rate declined 80bps to 16.7%. The unemployment rate was unchanged at 3.9% in February. Real wages declined by a yoy rate of 6.7% in Q4 2022, higher than the 9.8% yoy drop in Q3 2022 and consensus expectations at -7.8% yoy. The trade balance moved to a EUR 9.5bn surplus in January from a USD 0.2bn deficit in December. Foreign exchange reserves dropped USD 7.4bn to USD 135.3bn in February.
- Egypt: CPI inflation rose 6.5% mom in February from 4.7% mom in January, lifting the yoy rate by 610bps to 31.9% as core CPI inflation rose 900bps to 40.3%, mostly because of the 36% depreciation on the EGP since October (or 41% according to black market rates). The S&P global PMI (all economy) rose by 1.4 points to 46.9.
- Hungary: The yoy rate of retail sales dropped 4.5% in January after -3.9% yoy in December, a larger contraction than expected by consensus. CPI inflation rose by 0.8% mom in February after 2.3% mom in January as the yoy declined 30bps to 25.4%, in line with consensus. Industrial production dropped 5.1% mom in January after rising 3.6% mom in December, leading the yoy rate to contract 3.2% from a 5.6% increase over the same period last year.
- India: The yoy rate of industrial production rose 5.2% in January from 4.7% yoy in December (revised from 4.3%) and the yoy rate of CPI inflation declined 10bps to 6.4% in February, in line with consensus.
- Indonesia: Consumer confidence declined 0.6 to 122.4 in February, but foreign exchange reserves rose by USD 0.9bn to USD 140.30bn over the same period.
- Kazakhstan: PPI inflation rose 0.1% mom in February after declining 1.6% in December, bringing the yoy rate down by 260bps to 4.5%.
- Malaysia: Bank Negara Malaysia kept its policy rate unchanged at 2.75%. The institution has been successful at anchoring inflation and inflation expectations with minimal volatility in its policy rate, a case to be studied and an example to be followed.
- Poland: The National Bank of Poland kept its policy rate unchanged at 6.75%, in line with consensus, as it lowered its 2023 and 2024 inflation forecasts by 135bps to 11.85% and 15bps to 5.7% respectively, while increasing its growth forecasts by 20bps to 0.85% in 2023 and by 5bps to 2.1% in 2024.
- Romania: Retail sales increased 0.7% mom in January after gaining 1.4% mom in December.
- Saudi Arabia: The CEO of Saudi Aramco said the oil market was tightly balanced as they expect crude oil prices to remain supported. The company’s net income declined by only 1% yoy, but recurrent net income rose 9% yoy to USD 34bn. Real GDP growth declined 1.3% quarter-on-quarter (qoq) in Q4 2022 after rising 1.8% qoq in Q3 2022, below consensus for a contraction of 0.4% qoq.
- South Korea: The yoy rate of real GDP growth slowed by 10bps to 1.3% in Q4 2022, slightly below consensus.
- Taiwan: The yoy rate of CPI inflation dropped 60bps to 2.4% in February as core CPI declined 40bps to 2.6% and PPI plunged 150bps to 4.1% yoy over the same period. The trade surplus was unchanged at USD 2.3bn.
- Thailand: The yoy rate of core CPI inflation declined 110bps to 1.9% in February while CPI inflation was down 120bps to 3.8% yoy over the same period, justifying the Bank of Thailand’s cautious approach and avoiding hiking interest rates too aggressively. Consumer confidence improved marginally to 52.6 from 51.7 and foreign exchange (FX) reserves rose by USD 1.0 to USD 218.7 in the week ending on 3 March.
- Türkiye: Saudi Arabia agreed to deposit USD 5bn in the Türkiye Central Bank, an important liquidity measure to the distressed balance of payments.
Developed Markets
United States: The job market remained resilient last month, but that become much less relevant after the developments in the banking system. Non-farm payrolls increased by 311k in February from 504k in January, again significantly above 225k consensus, but 4k employees lost their jobs in excess of new hirings in the manufacturing sector after +13k in January. The unemployment rate rose by 20bps to 3.6% as the labour force participation rate rose by 10bps to 62.5% and average hourly earnings rose 20bps to 4.6% (10bps below consensus). Initial jobless claims rose by 211k in the week of 4 March from 190k in the previous week and continuing claims rose to 1,718k in the week ending on 25 February from 1,649k in the previous week. The JOLTS report showed job openings dropped by 400k to 10.8 million in January, 300k above consensus, keeping the number of job openings at 1.9x the number of unemployed workers – still too tight of a labour market. The decline in job openings was concentrated in construction (-240k), financial activities (-151k) and hospitality (-194k). The quits rate declined 10bps to 2.5%.
Eurozone: The Sentix Investor Confidence index declined to -11.1 in March from -8.0 in February and -5.5 consensus, the first decline after troughing in October 2022 at -38.3. Retail sales rose 0.3% mom in January after dropping 2.7% mom in December (revised from -1.7% mom).
Australia: The Reserve Bank of Australia hiked its policy rate by 25bps to 3.6%, in line with consensus.
Canada: The Bank of Canada kept its policy rate unchanged at 4.5%, in line with consensus, after weaker than expected GDP growth in Q4 2022 and in spite of the tight labour market.
United Kingdom: The S&P Global/CIPS UK Construction PMI rebounded to 54.6 in February from 48.4 in January.
1. The FDIC automatically secures all deposits up to USD 250,000
2. See https://www.federalreserve.gov/newsevents/pressreleases/monetary20230312b.htm
3. See https://www.nytimes.com/2023/03/09/us/politics/saudi-arabia-israel-united-states.html
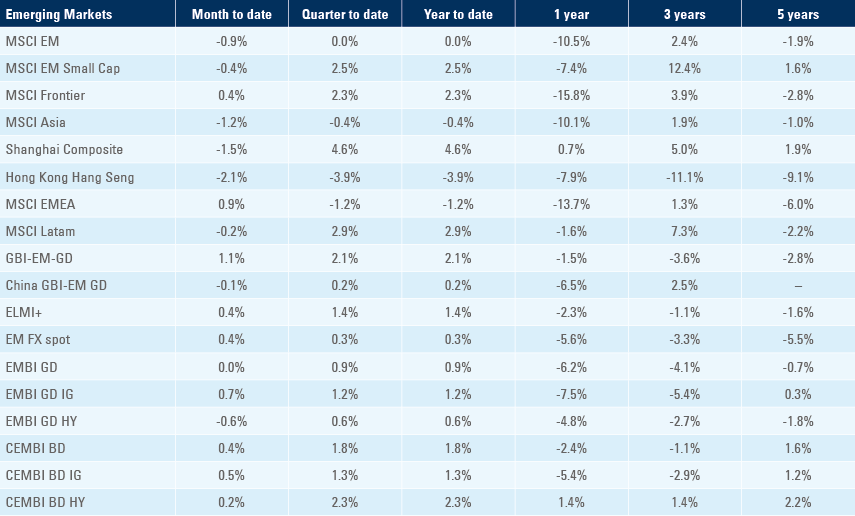
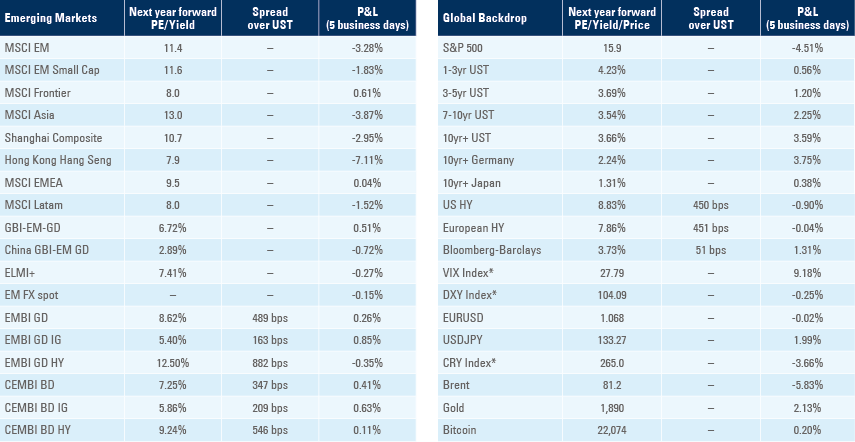
Benchmark performance