It’s a catchy axiom that “frontier markets are what emerging markets used to be,” and there’s some truth to it. As emerging markets (EMs) grow and become more interconnected with the global economy, they are increasingly more efficient and correlated with global economic cycles. For active investors, frontier markets (FMs) offer more frequent valuation dislocations and opportunities for idiosyncratic returns in both the debt and equity markets.
That said, ‘frontier’, as it applies to Ashmore funds, does not mean the ‘Wild West’ of investing. The term simply refers to economies with smaller, less liquid capital markets, or markets that are more difficult for international investors to access. Many of these economies have lower levels of development, but some are investment grade. The key point is that global asset allocators remain underinvested in almost every frontier market, leaving plenty of untapped value and opportunity. Those who have been invested have reaped significant returns over the past decade and continue to do so this year.
Overview of the FM debt opportunity
Just like EM debt, FM debt can enhance global fixed income portfolios by boosting both returns and diversification. A focused allocation to FM debt has clear advantages, as shown by the significant outperformance of the JP Morgan NEXGEM index, the go-to benchmark for sovereign frontier USD bonds, versus the EMBI GD index on both an absolute and a risk-adjusted basis over the last decade.
Several technical factors support this strong showing. First, frontier debt typically carries lower duration, on average, than broad EM sovereign debt. This is expected, given its higher risk and yield profile. More interestingly, over the last five years, FM sovereign debt has consistently had a lower duration than EM high-yield sovereign bonds, even during periods when its average yield was lower. This makes frontier debt an appealing diversifier against the US rates cycle.
Second, FM countries, often smaller and less developed, tend to be more domestically driven. Over the past decade, improving domestic fundamentals have supported returns and driven a wave of credit rating upgrades. Today, the NEXGEM frontier index carries an average credit rating of B+. This is superior to the average credit rating of the HY portion of the EMBI GD index, which holds a material number of C rated and defaulted credits.
We believe this story of improving fundamentals and increased risk adjusted returns is set to continue. Several FM countries lost market access in the wake of Covid, but are regaining it in many cases, with the support of reform-linked International Monetary Fund (IMF) credit lines. As these economies stabilise, credit rating upgrades are likely to follow, creating the potential for price gains for investors.
The frontier market debt universe
External debt
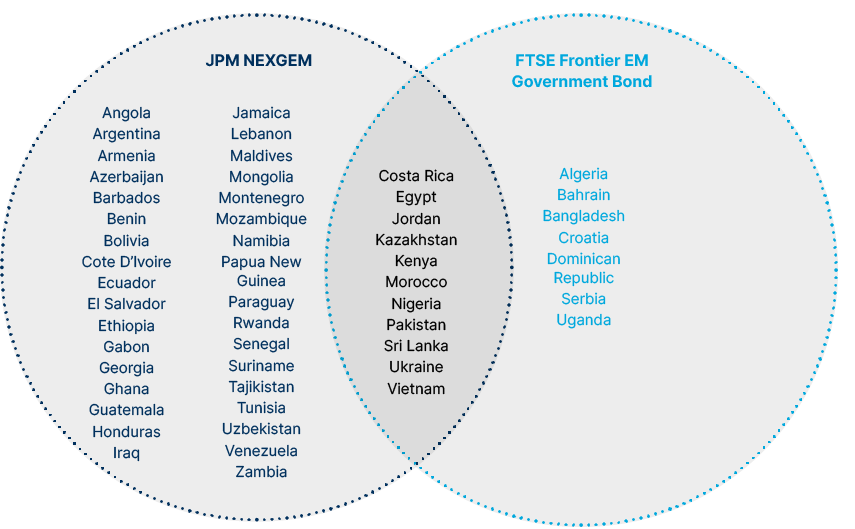
There is no single index that captures the full breadth of the frontier debt opportunity set, in our view. Managers seeking access to the full universe must go off-benchmark. Ashmore’s approach starts with the JP Morgan NEXGEM index and the FTSE Frontier EM Government Bond index, the latter a narrower measure of local currency frontier bonds. From there, the investment universe expands to include other countries where opportunities are compelling, particularly in markets not covered by the GBI-EM, and/or where foreign investor participation remains low.
The JP Morgan NEXGEM index is the most widely followed frontier debt benchmark. It is designed to represent markets “just beginning to appear on the radar of traditional EM investors” and capture the returns of the so-called “Next Generation Emerging Markets.” Today, it includes 42 countries with a combined market cap of USD 325bn, representing about 17% of the EMBI GD index.
In April 2025, the criteria for inclusion changed.
The old rules were:
- A weight of less than 2% in the EMBI GD for the last 12 months.
- A sub-investment grade credit rating.
- No EU membership or candidacy.
The new rules are:
- The country is classified as an EM under JP Morgan’s EM/DM framework.
- The country falls in the bottom two-thirds of the global GNI per capita distribution.
- Its local currency debt is not included in the GBI-EM indices.
This update added 10 countries: Argentina, Egypt, Kazakhstan, Morocco, Ukraine, Ecuador, Venezuela, Lebanon, Benin and Montenegro. The change brings a yield pick-up of over 3%, although part of that comes from the addition of defaulted credits. It also builds in the EMBI GD’s 10% maximum weighting rule, ensuring a balanced distribution of NEXGEM country weights.
Local currency debt
The local currency frontier debt market is already quite large but continues to expand and diversify. Today, it offers very attractive opportunities, particularly during periods of cyclical dollar weakness, as we have seen so far this year. The FTSE Frontier Emerging Markets Government Bond index captures part of this market, including bonds from 19 countries.
Its inclusion criteria are:
- Market size between USD 5bn and USD 50bn.
- A maximum credit rating of ‘BBB-/Baa3’ (the lowest investment grade level).
- Exclusion of countries classified as High Income by the World Bank.
- Assignment of a Market Accessibility Level under the FTSE framework.
When combined with the NEXGEM index, these indices create a universe of roughly 50 countries.
Fig 1: Ashmore’s definition of the frontier universe
However, in Ashmore’s frontier funds, portfolio managers can invest in any local currency sovereign bond, where we assess that foreign investor participation, or capital market access, is low enough for the market to be considered ‘frontier’. This flexibility allows for the inclusion of investment grade countries such as Uruguay and Iceland, as well as Paraguay, in portfolios. Allowing for the inclusion of these stable, but underappreciated local currency bonds offers stronger diversification and risk management potential.
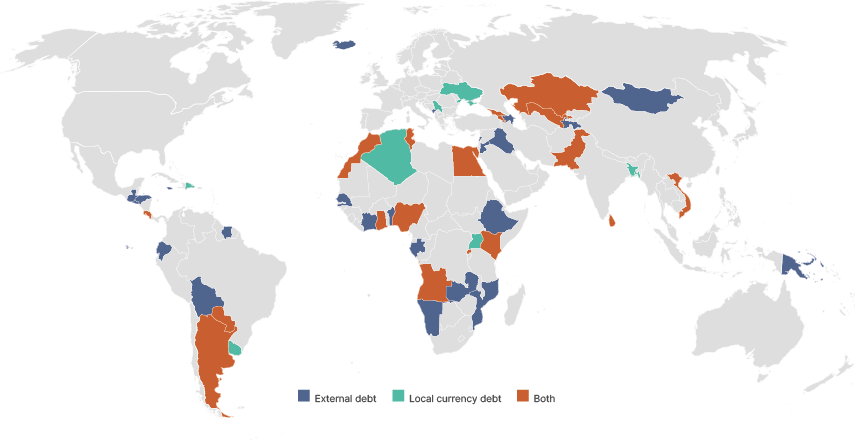
Fig 2: Geographical distribution of frontier market debt
Market size
Today, the total size of the combined local currency and external debt frontier universe, as Ashmore defines it, exceeds USD 1trn. Around USD 700bn of this is local currency debt across 25 countries. The largest issuers are Argentina, Egypt, Vietnam, Morocco and Kazakhstan, which together make up about 60% of the universe. The external debt pool, represented by the NEXGEM, is approximately USD 325bn. The top five issuers in this index make up only around 30% of total assets, demonstrating its relatively balanced structure.
Frontier debt vs. frontier equity: The same, but very different
Investing in frontier markets gives similar benefits for both debt and equity portfolios, boosting diversity and providing the potential for increased, uncorrelated returns. However, it is a misconception to think investing in frontier debt and frontier equity provides exposure to similar economies. Indeed, the regional weighting of the frontier equity universe is very different to that of frontier debt. Only 16 countries appear in both indices. Therefore, to maximise regional diversification within a multi-asset portfolio, asset allocators should hold exposure to both asset classes.
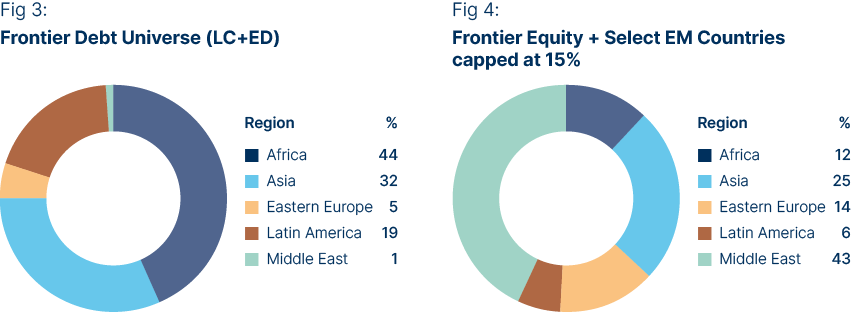
The FM debt universe is dominated by Africa, Asia and Latin America (LATAM). Its exposure to the Middle East is small, given the higher levels of Gross National Income (GNI) per capita across much of the region, which excludes it from frontier debt indices. This criterion also excludes various Middle Eastern countries from the MSCI Frontier index. However, our own FM equity universe is less constrained by income levels and instead, focuses on smaller EM markets where investors have little exposure. This leads to the inclusion of Middle Eastern countries like the UAE, Kuwait, and Qatar and raises the region’s weight in our index to 43%, as of September 2025.
The largest weight in the MSCI FM equity index is Vietnam, at 26.6%. In Ashmore’s custom index, Vietnam is just under the maximum weight of 15%. The country does not have enough sovereign USD debt to be part of the NEXGEM index, but its local currency bonds currently make up 9% of the overall frontier debt universe. FM debt also has a much greater exposure to LatAm, where it accounts for 19% of the universe compared to just 6% in FM equity.
Frontier market hard currency debt – Past performance and technicals
The JP Morgan NEXGEM index has significantly outperformed the JP Morgan EMBI GD since inception (Fig 4), and outperformance has accelerated this year. Over the long term, higher returns are unsurprising given NEXGEM carries more risk, with an average credit rating of ‘B+’ compared with ‘BBB-’ for the EMBI GD.
However, investing in frontier hard currency debt has been particularly rewarding over the past decade. After the 2013 taper tantrum settled, the global search for yield drove inflows into higher-yielding frontier credits.
Fig 5: NEXGEM vs EMBI GD
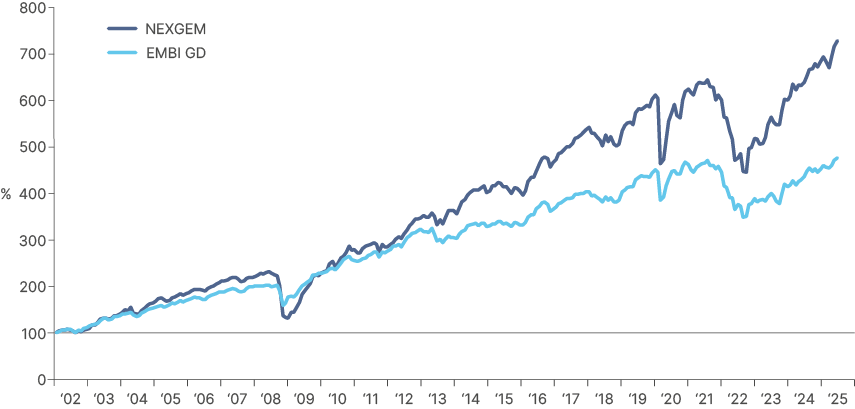
The resulting spread compression narrowed the yield gap between EMBI GD and NEXGEM from around 2% in 2015 to below 1% by 2017. Frontier portfolios naturally have a bias toward spread compression, driven by idiosyncratic credit improvements rather than broad market moves, except during periods of higher global volatility when correlations with global credit rise. Performance was also aided by lower exposure to large, highly-rated EM names that later fell from grace, such as Brazil and South Africa, and zero exposure to high-profile defaults in Argentina, Venezuela, Ecuador and Ukraine.
Over the last two years, NEXGEM has outperformed the EMBI sharply, now 14% higher than it was before its drawdown in 2022. Wider spreads at the start of the cycle provided more room to tighten, while higher beta and thinner liquidity amplified gains during the recovery. Stronger commodity prices, improving fiscal and external positions, and credit upgrades across several frontier names added momentum, while limited exposure to weaker large EM credits avoided the drag seen in the EMBI GD, which has only just surpassed its 2021 levels in recent months.
Frontier hard currency debt characteristics
Yield
After the global bond sell off and liquidity squeeze that triggered distress and defaults in 2022 and 2023, strong recoveries across FM countries tightened the spread between the NEXGEM and EMBI GD indices back to around 1% by the start of this year. However, the recent reclassification of the index has pushed yield-to-maturity back above 10%, driven by the inclusion of high yield issuers such as Argentina, Egypt and Ecuador, as well as defaulted credits like Lebanon and Venezuela, which offer meaningful potential recovery values.
Ashmore actively manages its Frontier strategy, and often aims to enhance the yield of FM hard currency holdings relative to the NEXGEM index through a barbell approach. This involves increasing exposure to higher yielding bonds in countries with improving fundamentals, such as Egypt, Pakistan, and the Ivory Coast, while maintaining positions in higher rated credits offering attractive yields, such as Costa Rica and Paraguay.
Duration
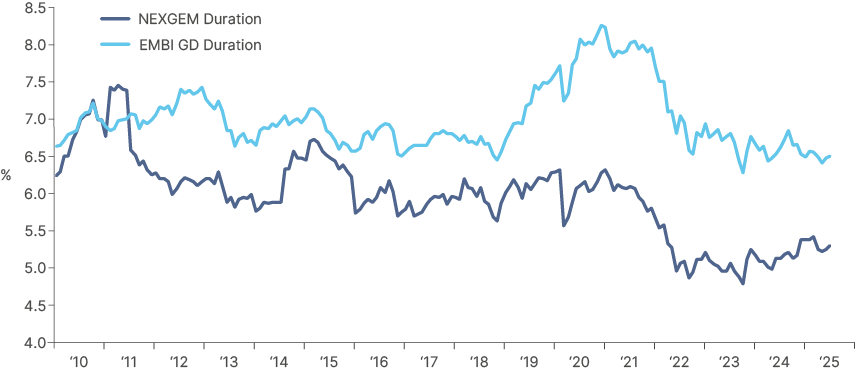
One of the key attractions of FM debt is that it combines strong yields with relatively low duration, reducing its correlation with global interest rates. The index duration has fallen meaningfully over the past decade, from above 7 years in 2010 to below 5.5 years today. This decline is largely structural, driven by a shortening of the average maturity profile across index constituents over the last 10 years, rather than by rising yields. Notably, duration is now lower than that of the high yield segment of the EMBI GD.
Fig 6: Index duration: NEXGEM vs EMBI GD
Duration relative to yield
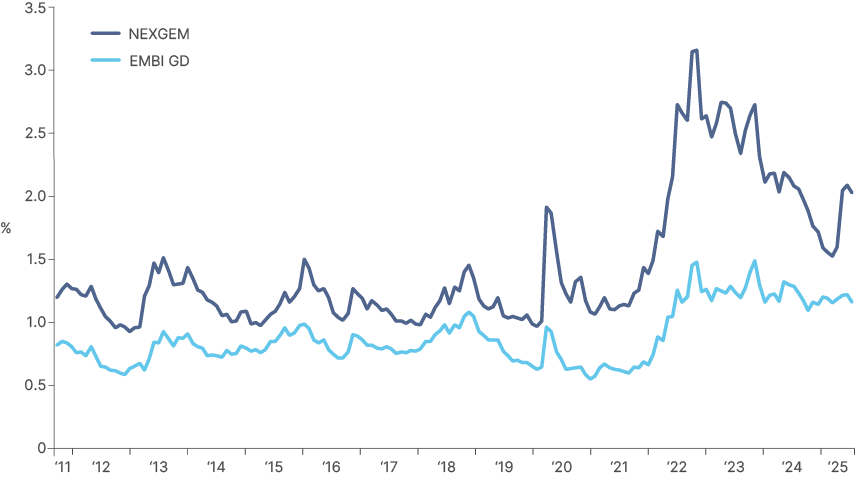
This lower duration profile is part of what underscores the asset class’s attractive potential for strong idiosyncratic, risk-adjusted returns. For every unit of duration (or US interest rate risk) taken, the NEXGEM currently offers investors more than 2% of yield. The EMBI GD offers just over 1%, so is inherently more exposed to US rates.
Fig 7: Duration adjusted yield
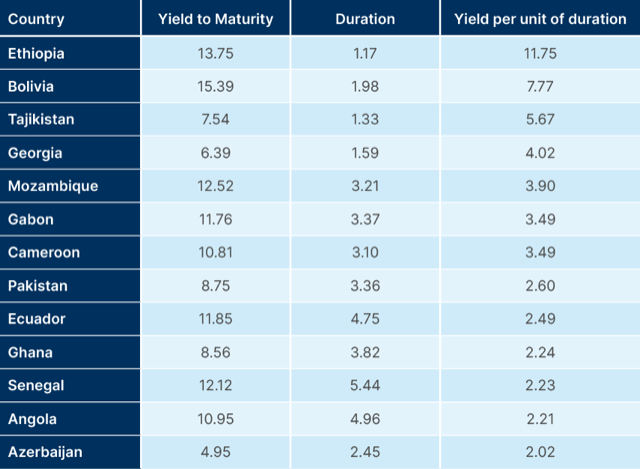
The table below shows the list of countries currently offering more than the average duration-adjusted yield of the index. This demonstrates the variety of opportunity for exposure to countries with high yields – and therefore idiosyncratic drivers related to the risk premia of individual countries – and also a low correlation to global interest rates. Ashmore currently has selective exposure in several of these countries where the investment team has identified clear momentum towards stabilising or improving economic fundamentals.
Fig 8: Yield to Maturity vs Duration: NEXGEM members
Frontier local currency debt characteristics
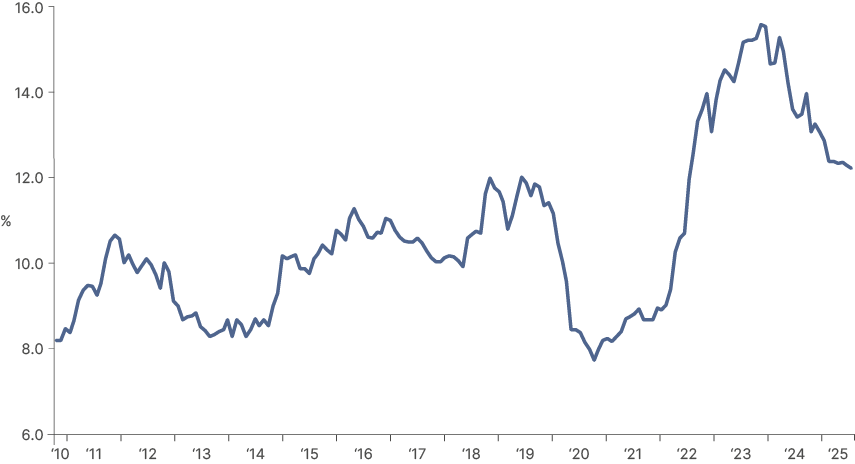
The valuation of frontier local currency bonds remains attractive in both yield and foreign exchange (FX) terms.1 Naturally, in cases where curves are steeper, the potential to earn high carry is significantly greater than suggested by the data in the charts which reflects a simple average of 1-year interest rates in 25 local currency bond markets.
While rates have dropped from their 2023 peaks of nearly 16%, as inflation has stabilised, the average one-year rate on offer of 12% is still very attractive, and is 2% higher than the average of 10% since 2010.
1. The charts below show equal weighted data across 25 currencies we have identified as investible for our Frontier funds. This uses the one-year interest rate for each country. The charts should be viewed as purely illustrative, as the way we invest in frontier local currency bonds and FX is off benchmark and opportunistic, rather than tied to an index, and would likely never hold positions in all the possible countries.
Fig 9: Frontier Local Currency 1 Year Bond equal weight yield
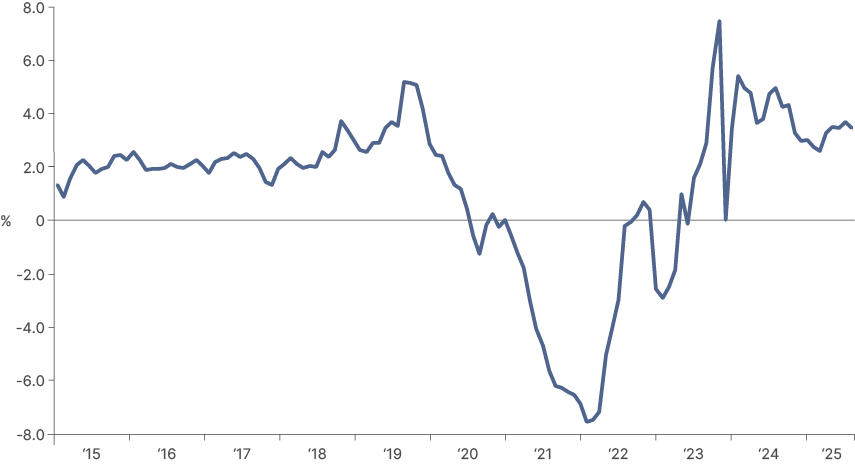
Rates also remain attractive in real terms. Inflation moderated quickly in most FM countries after soaring to nearly 8% on average in 2023, which means that the ex-ante real yield on our synthetic equal weighted local currency index (using the average of 2025 and 2026 inflation expectations for each country), is still nearly 4%. Rarely in the past 10 years have better real yields been on offer.
Fig 10: Realised 1yr real yields, equal LC frontier (ex-ante from September 2024)
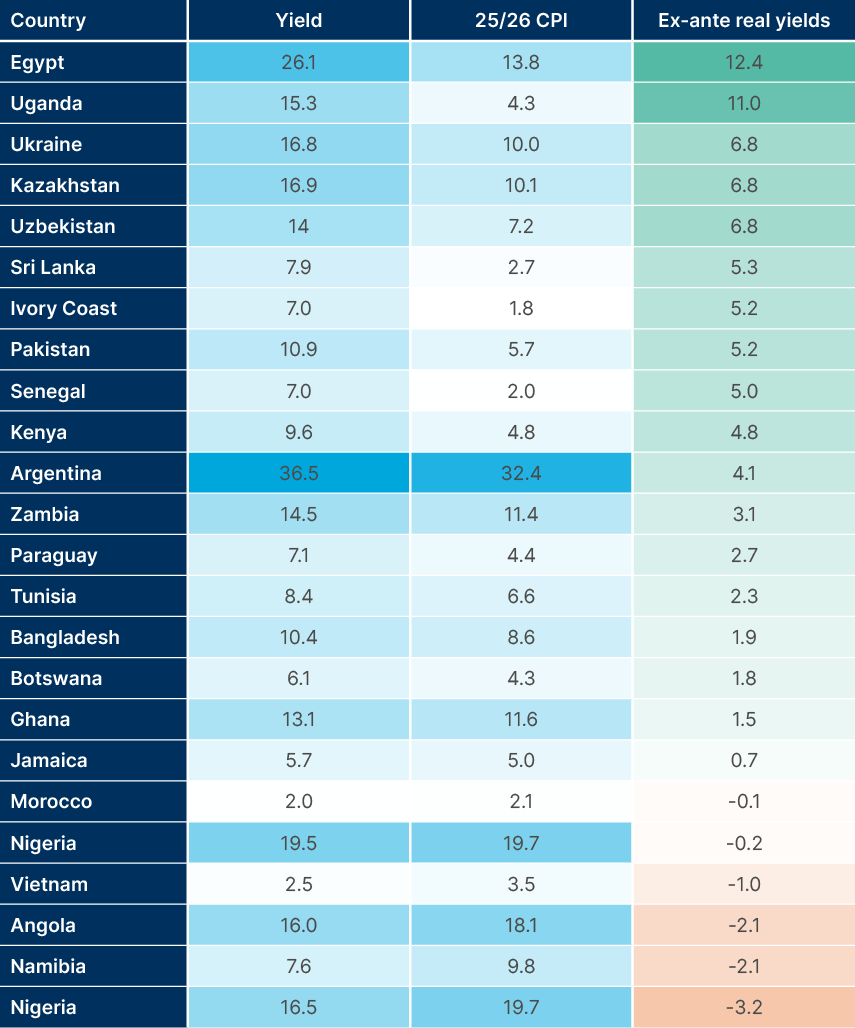
Country by country, real yields look even more attractive for active managers. In many cases, such as in Egypt, Kazakhstan, Nigeria and Argentina, inflation is likely to fall faster than consensus expects, in our view. This means real yields can be even stronger than indicated in the table with rate cuts boosting total returns.
Fig 11: Frontier local currency 1 year ex-ante real yields Country Yield 25/26 CPI
FX valuations
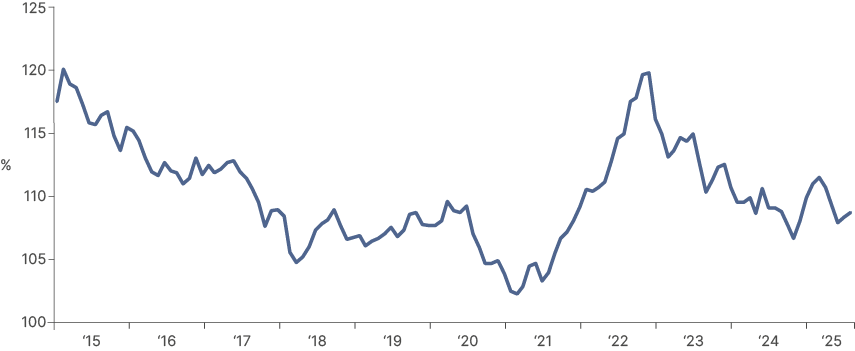
Buying local currency bonds also entails, obviously, FX risk. USD weakening over the course of 2025 has boosted EM FX performance. However, on a Real Effective Exchange Rate (REER) basis, most FM currencies remain attractively valued. Inflation has fallen dramatically in many frontier countries over the course of the last two years, and various countries, such as Nigeria, Egypt and Argentina, have undergone significant currency devaluations.
Fig 11 shows an index of the weighted average of the REER of the currencies identified as investible in Ashmore’s frontier fund, indexed with the base year of 2008. Despite an increase in the index since early 2024, its value remains below the average of the last 10 years.
Fig 12: Equal weighted REER – Frontier currencies
We believe investors should be positioned opportunistically in currencies where high carry from bonds, or generated through derivative contracts, provides a buffer to exposure to FX that is likely to be stable, or to appreciate over time.
Volatility of frontier local currency bonds
What may surprise the unacquainted is the relatively low volatility observed within the local currency segment of FM debt, especially when compared with more traditional EM indices. Over the last 10 years, the volatility of Ashmore’s basket of local currency FX bonds has been just over 3% annually, versus 6% for EMBI GD currencies.
There are two key reasons for this lower volatility:
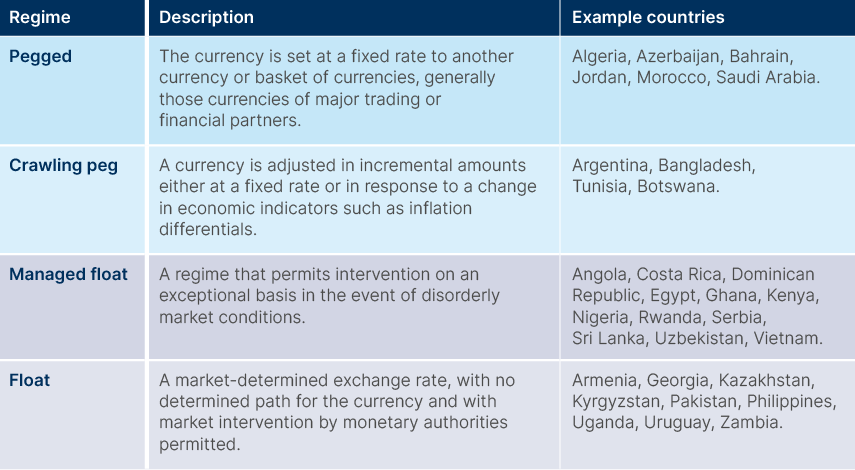
1. Shorter duration instruments: Local currency markets in FM countries typically have a greater availability of shorter-duration instruments compared with external debt markets. For example, while the average life of bonds in the FTSE Frontier EM Government Bond Index is around seven years, local currency FM debt products often include US Treasury bills and currency forwards maturing within 12 months.
2. Managed currency regimes: Many FM central banks operate managed currency regimes. These policies help to dampen currency swings, contributing to the lower overall volatility observed in local currency frontier debt.
Fig 13: Exchange rate regimes
Switching exchange rate regimes can lead to opportunities for alpha
Recent external shocks have driven several FM countries to adjust their currency regimes, creating significant opportunities for investors. Nigeria and Egypt, for example, have undergone sharp devaluations in the past two years, offering attractive entry points as inflation moderates and external balances improve. In Argentina, local bonds and Peso forwards have delivered bit returns over the last two years, with high interest rates far outpacing the managed 2% monthly devaluation under President Javier Milei.
As fundamentals improved, Argentina’s central bank removed most capital controls in February 2025, shifting to a more flexible currency band. While such regime changes carry inherent risks, they often present compelling opportunities for active managers with deep FM expertise to look through short-term volatility and position for strong long-term returns.
Local currency opportunities spotlight
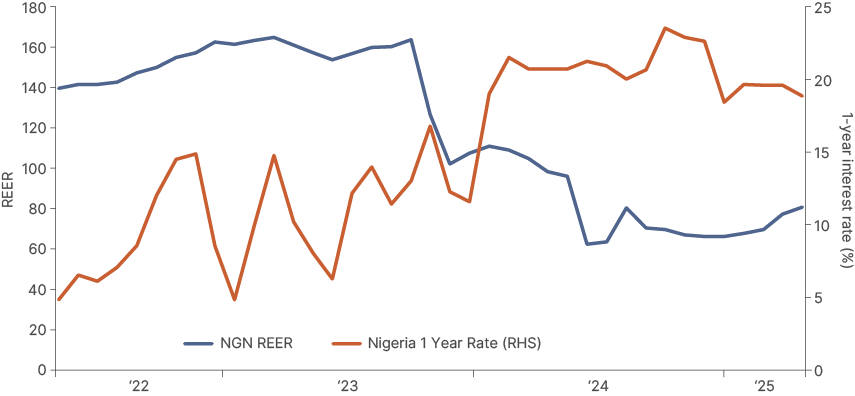
Nigeria: In Ashmore’s view, Nigeria’s local currency bonds offer one of the best opportunities in FM this year. A decade of fiscal mismanagement and an overvalued currency drove high inflation and eroded growth, but a reform agenda launched in 2023 by President Bola Tinbubu has now laid the foundation for a sustainable economic recovery. The reforms include scrapping expensive fuel subsidies and other measures to put Nigeria on a path to fiscal consolidation. However, perhaps the key policy was to abandon the currency peg which had driven Nigeria’s REER to highly elevated levels. A currency devaluation of over 50% since 2022 has allowed the current account to flip from a deficit to a significant surplus, estimated to reach 7% of GDP this year.
Aggressive rate hikes to combat the spike in inflation triggered by the necessary FX devaluation are working. With the FX having stabilised and inflation falling relatively quickly, one-year yields near 20% remain exceptionally attractive. Inflation, in our view, will soon drop below 20% and real yields will flip positive for the first time since 2019. However, for overseas investors, returns will be defined less by real rates turning positive and more by a combination of high nominal yields and FX stability, with the possibility for significant FX appreciation, given the REER is still below fair value.
Fig 14: Real Effective Exchange Rate vs 1 year bond yield
Uzbekistan: Despite years of high domestic inflation, tight FX management and reserve accumulation kept the currency below fair value. The Som remains deeply undervalued, with a REER near 40. However, as a major gold miner, high gold prices are driving fast growth and record FX inflows, lifting reserves above USD 41bn and beginning to boost confidence that the central bank may soon allow the currency to appreciate on a more sustained basis, having risen 4% against the USD since April. With policy rates at 14%, moderating inflation, and robust external buffers, the Som offers one of the most attractive opportunities in frontier FX.
Frontier macro: Improving country fundamentals drive uncorrelated returns
Fundamentals
Through the cycles, frontier markets are more likely to give investors exposure to improving economic fundamentals than developed, or even emerging markets. As economic fundamentals improve, risk premiums and cost of funding drops. As countries ‘graduate’ from frontier to a fully-fledged member of one of the major EM indices, they leave the FM universe, thus keeping the investable universe focused on countries with longer periods of fast growth ahead of them, aside from some exceptions of relatively developed, but small economies with undersized capital markets, such as Uruguay and Iceland.
Growth
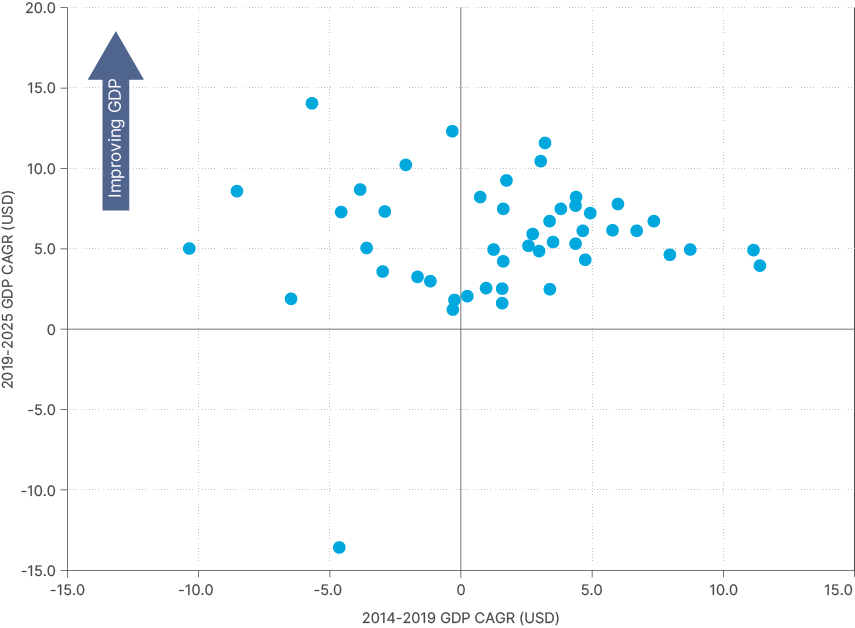
Looking at average economic data across the 50-country FM universe, as fundamentals have improved significantly over the last decade and have exhibited impressive resilience to global economic shocks. Comparing average GDP growth of the universe between 2014-2019 and then 2019-2024 in USD terms is impressive. Of the many countries whose economies shrunk in USD terms in the five year period before 2019, only one has not recovered, which is Nigeria. This is partially due to a large currency devaluation during the period, which reduced its GDP in USD terms.
Fig 15: Average change in GDP growth (USD current prices)
Apart from during COVID, FM growth has been higher than DM in recent history. However, the IMF projects the growth premium of FM vs DM to reach a decade high this year. This is driven by both strong frontier growth projections, and expectations for weaker growth in the US, as President Donald Trump’s trade policies weigh on activity and increase uncertainty for US businesses.
Fig 16: Frontier GDP Growth premia over DM
We expect FM economies to continue growing quickly in the coming years, with the majority of the economies in the investment universe backed by improving fundamentals, or IMF support programmes that should help improve access to funding and offer more long-term stability. It has also long been our view that stronger US growth since 2017 has been driven by a pro-cyclical sugar rush which began with Trump’s Tax Cuts and Jobs Act. At this point, fiscal deficits widened as unemployment declined, the definition of pro-cyclicality. Even with the extension of these policies in the One Big Beautiful Bill Act, we believe that tariffs will reduce the US fiscal deficit in the coming years, representing a very large net tax hike versus ‘baseline’ policy. Polices of course can change, but the broad direction of policy looks like it will weigh on GDP growth at least for 2025 and 2026. This means a larger FM and EM growth premium over DM should be expected.
Debt
What makes the acceleration of frontier GDP growth over the last five years more impressive is that, in most cases, it has not been linked to a large expansion of government spending. Instead, GDP has followed the expansion of growth potential through economic reforms.
Fig 17: Debt to GDP, frontier markets vs EM vs DM
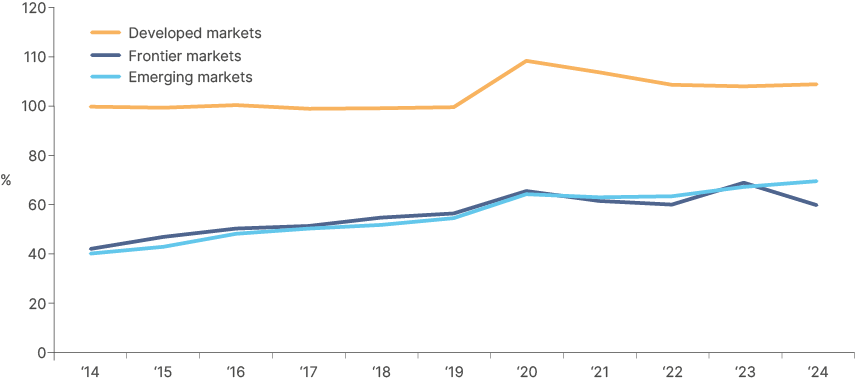
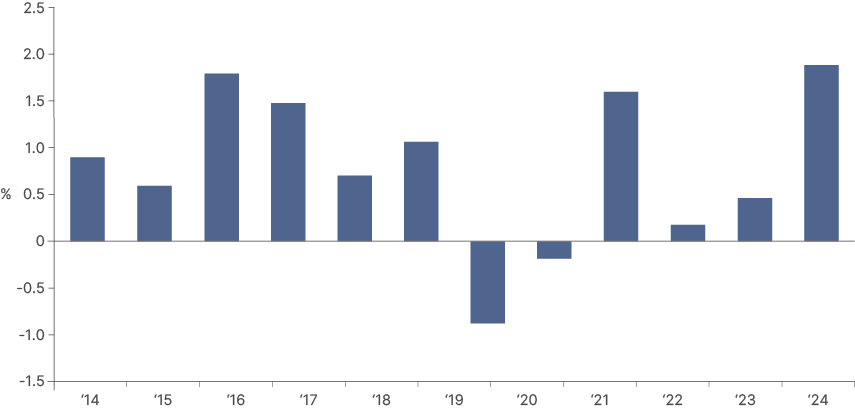
Aggregate figures show that FM economies have begun to reduce their debt burdens, with average debt-to-GDP now about five percentage points lower than in 2020. The decline in FM debt-to-GDP reflects a combination of stronger nominal growth, improving or stable primary deficits, and better external account dynamics. The steep REER decline since 2022 has restored export competitiveness and made foreign investment in the countries more attractive.
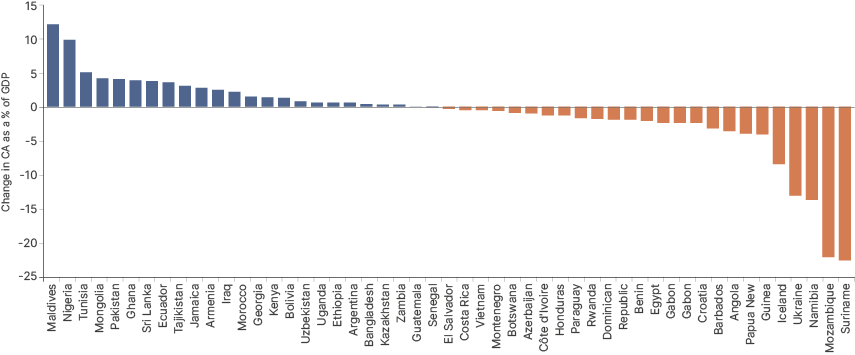
Dispersion in all these underlying metrics is of course material across the 50-country index, but the direction of travel for most issuers is currently towards better balance sheets and credit quality. The figure below shows that the average of the primary balance changes between 2019 and 2024 is just -0.6%, with many countries having consolidated their deficits in a five-year period which saw one of the biggest expansions in global leverage in history. By concentrating exposure on countries with stable or improving primary surpluses, investors can capture the growth premium and the reform dividend while boosting the stability of their portfolios.
Fig 18: Primary Balances as % GDP 2019 vs 2025
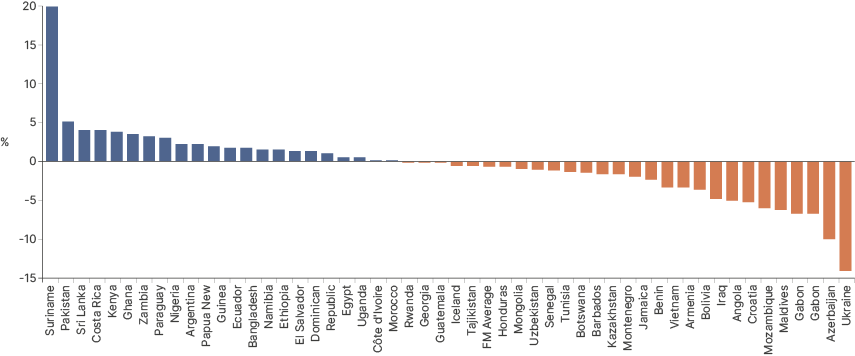
Robust current account balances are particularly important for FM countries with more Dollar debt. Improving current account balances tends to mean strengthening currencies and better Dollar liquidity, which makes external debt servicing easier. Many economies in the FM universe have improved their current account (CA) balances since 2019. As a GDP-weighted average, FMs improved their CA balance by 93 basis points (bps) over the period versus 27bp for EM ex-frontier.
Fig 19: Change in Current Account as % GDP 2019-2025
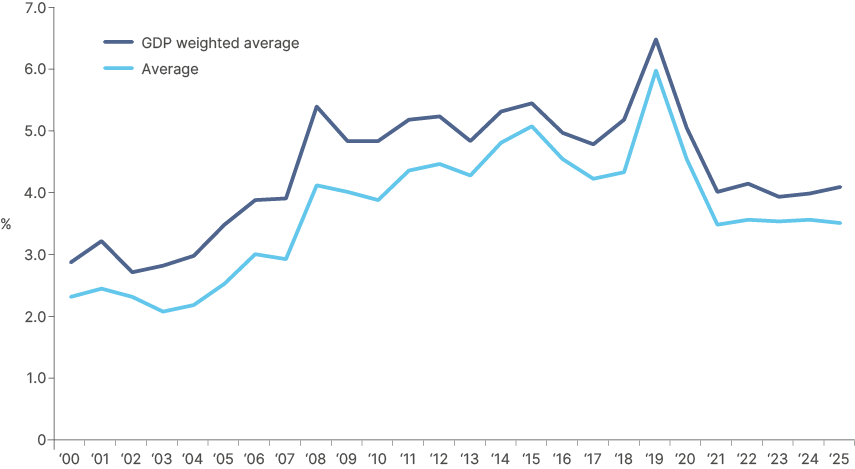
The strengthening of CAs in the last five years supported the stabilisation of FX reserves since 2022. After heightened external pressures during Covid and the subsequent higher rate environment, FM funding pressures have started to ease. From 2000 to 2020, the import cover ratio (the number of months of imports that FX reserves cover) roughly doubled, as FM economies made structural progress supported by commodity windfalls, IMF programmes, and better external management.
The reserves built over that period were then drawn down in 2020 as central banks defended currencies, fought inflation pressures, and sought to stabilise FX, with the subsequent energy and food price shock and a stronger US dollar eroding buffers further. Since 2021, import cover has stabilised through 2025, indicating that FM economies have weathered the shock and are positioned to rebuild reserves and liquidity. On average, they now sit a little above four months of imports, above the IMF’s minimum three-month rule of thumb.
Fig 20: Import cover for frontier economies
Credit rating upgrades driven by improving economic fundamentals, and better external funding environment
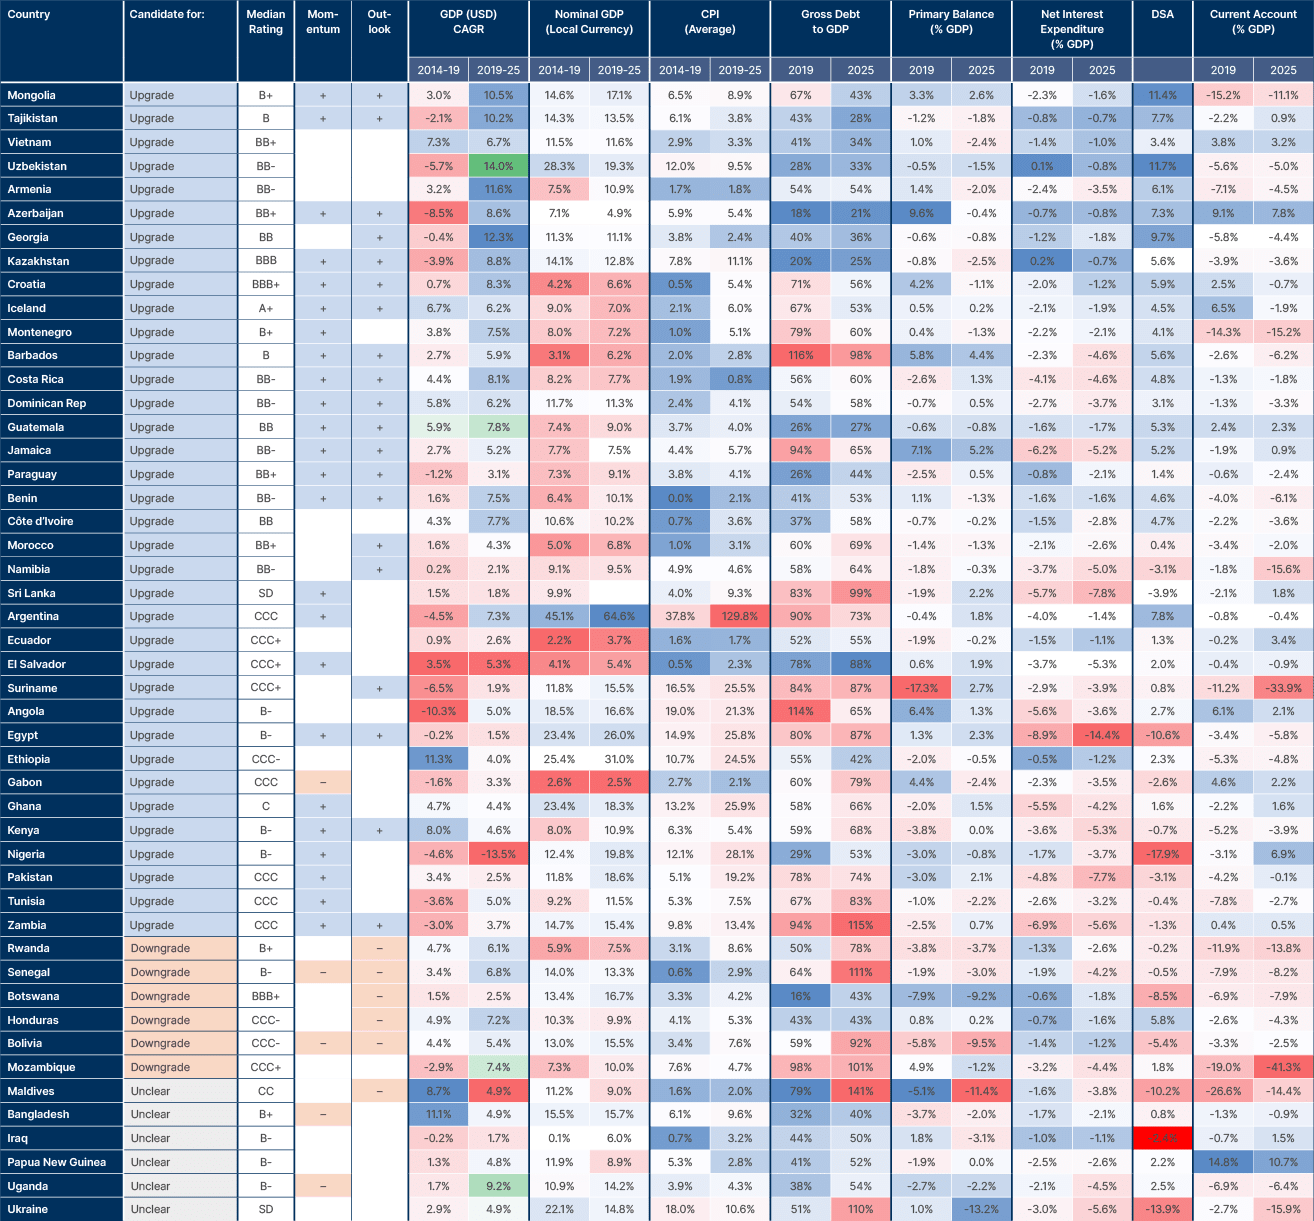
Improving fundamentals across FMs are reflected in the increasing number undergoing credit rating upgrades and positive outlooks from the three major credit rating agencies. 20 frontier markets currently have a positive outlook held by at least one of the three major credit rating agencies. Just 6 have a negative outlook. Furthermore, 24 countries have been upgraded by at least one agency within the last 18 months, while just 5 have been downgraded. Momentum is, therefore, very much positive.
In the chart in Appendix 1, we list all the frontier countries we cover with this credit rating and outlook data, along with macro data from 2019 and 2025. The 'DSA' column stands for 'Debt Sustainability Analysis,' and simply subtracts the primary balance and net interest payments from their 5 year USD GDP growth rate. This gives a basic measure of the improvement or deterioration of each country's ability to pay down debt.
Overall, looking at outlooks, credit rating momentum, economic data improvements and IMF programmes, we see 34 of these countries as upgrade candidates, and just six as potential downgrade candidates.
Fundamental country spotlight
Pakistan
Pakistan’s USD bonds fell into distress due to persistent macro shocks, including twin deficit crises, surging inflation, political turmoil, and critically low FX reserves. Political stability since the mid-2024 elections has allowed a 37-month, USD 7bn IMF Extended Fund Facility (EFF) to proceed, complemented by a USD 1.3bn Resilience and Sustainability Facility (RSF) providing phased concessional financing for climate and structural reforms. The first EFF review in May 2025 unlocked USD 1bn, with additional disbursements under both programmes tied to continued reform progress.
Macroeconomic stabilisation is now evident: inflation has fallen from nearly 38% in mid-2023 to around 3% now, reserves have more than doubled to above USD 14bn, and the central bank has started to ease policy. Pakistan’s USD bonds have already staged a sharp recovery from distressed levels, but scope remains for further spread compression, particularly at the long end, as fiscal consolidation, revenue mobilisation, and multilateral support strengthen liquidity and investor confidence.
Argentina
Argentina last defaulted on its external debt in May 2020, following years of fiscal mismanagement, soaring inflation, and reserve depletion defending an overvalued currency. However, Javier Milei’s ‘shock therapy’ fiscal adjustment has restored a primary surplus and anchored policy credibility. This turnaround has enabled the removal of most capital controls this year, with the adoption of a more flexible exchange rate framework. Foreign exchange reserves have begun to rebuild. In early 2025, Argentina made its first USD bond payment in nearly five years, a key milestone. A USD 20bn IMF EFF followed soon after, with USD 12bn disbursed upfront and another USD 2bn paid out in July.
Bonds have rallied but still trade very cheap, reflecting still fragile reserves, Peso volatility, and political uncertainty ahead of the October midterms. If Milei's party and its allies can consolidate power in the legislative branch, this would accelerate key tax, labour, and investment reforms – the critical catalyst for further spread compression and eventual rating upgrades. In the meantime, the USD bonds are now paying a double-digit annual coupon, given current valuations.
Expanding IMF support reduces likelihood of another frontier default cycle
Due to economic reforms, and improvements in the external funding environment for frontier economies since Covid, many frontier economies that fell into debt distress or defaulted in recent years are now regaining access to credit markets.
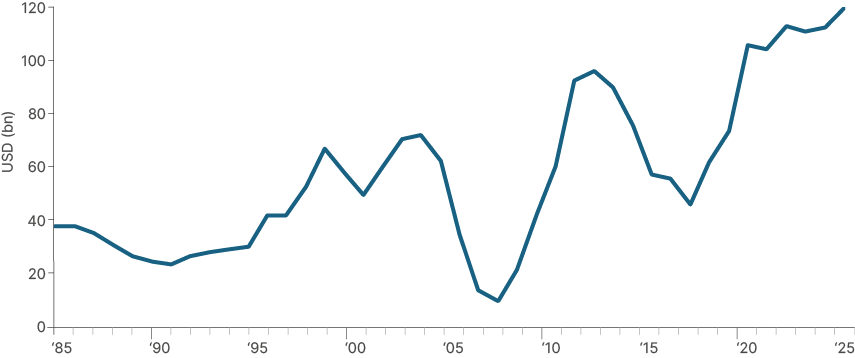
The increase in IMF commitments to FM economies through new and expanded arrangements has also played a crucial role. The following chart illustrates the rapid ramp up in total IMF credit outstanding for all members in response to the intense external pressures brought about by Covid. The IMF currently has USD 105bn total credit outstanding to FM economies as of July 2025, representing 88% of the total IMF credit outstanding, further easing the external pressures on frontier economies. As a result, even as global conditions remain tight, a larger share of FM borrowers now have a credible external financing line and a clearer path to rebuilding buffers.
Fig 21: Total IMF credit outstanding
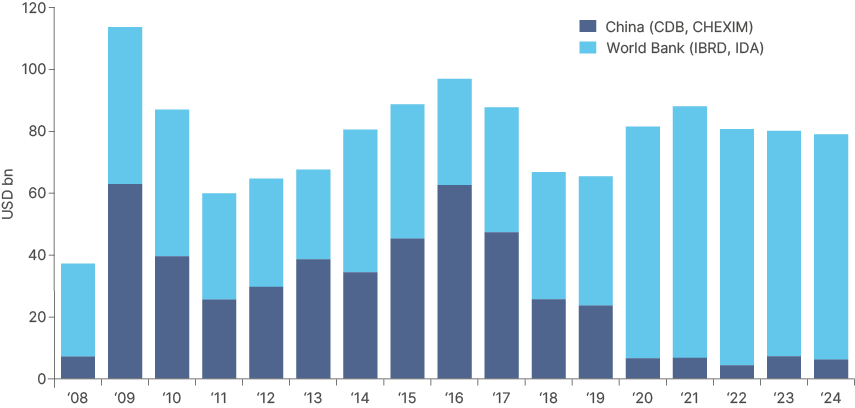
Alongside the IMF’s expanded role, the funding mix for developing economies has undergone a marked shift, with Beijing moving from capital provider to debt collector. By the mid-2010s, China had become the single largest supplier of bilateral credit to developing economies, with state-backed loans exceeding USD 50bn in 2016 under the Belt & Road Initiative, more than the entire pool of Western creditors combined that year. Since 2023, however, new Chinese loan commitments have stagnated at roughly USD 7bn annually, underscoring a broad retreat in lending. As a result, today, net flows from frontier countries to China are dominated by repayments, rather than new financing.
This withdrawal has been mostly offset by other creditors. The Paris Club has pivoted in the opposite direction to China, shifting from USD -16.9bn to USD +15.0bn in net lending to frontier countries over the same period, while multilateral development banks and the IMF have stepped in with countercyclical financing. As a result, although China was once the dominant source of external funding for frontier markets, its retrenchment has not led to a liquidity vacuum. Instead, alternative funding sources have helped stabilise conditions and sustain reform momentum, as shown in the figure below, which compares new loans made by Chinese development banks against those made by the World Bank.
Fig 22: China vs World Bank lending – 2008-2024
As the asset class itself matures, FM economies have opportunity to become less reliant on bilateral funding altogether. Many issuers that once depended on Chinese credit lines can now access multilateral backstops or tap international bond markets directly, further easing external pressures. For investors, this diversification of funding sources reduces systemic risk and supports the resilience of the frontier debt universe.
Conclusion
Frontier debt has evolved into a distinct and compelling asset class, combining robust yields, improving fundamentals, and valuable diversification within global fixed income portfolios. Many economies once viewed as structurally vulnerable have shown remarkable resilience through a period of unprecedented external shocks, supported by disciplined policy frameworks and fiscal adjustments. As a result, credit ratings are trending higher, and several sovereigns have regained market access – creating a favourable backdrop for spread compression and idiosyncratic alpha with global financing conditions now supportive.
An improving external funding environment, underpinned by a more active and engaged IMF, further reduces the risk of defaults in the medium term. With global allocators still significantly underweight FM, valuations remain compelling, particularly in the local currency market. In our view, the balance of risks for the US dollar is skewed to the downside in the medium term, which will relieve external financing pressures across the frontier universe, and set a macro backdrop for amplified returns in local currency frontier bonds that already offer attractive real yields and the potential for meaningful FX appreciation. Because the geographic composition of frontier debt is so different to frontier equities, holding both asset classes in multi-asset portfolios is optimal, in our view.
Appendix: Frontier Sovereign Fundamentals and Credit Rating direction