

Most institutional equity portfolios hold a small cap sleeve. The rationale is well established: completing exposure to the full equity market, purer exposure to the domestic business cycle, and differentiated sector exposure relative to large cap indices. Yet although emerging market (EM) small caps now constitute a USD 3.5trn universe – comparable in breadth to the Russell 2000 – they remain chronically underrepresented in most institutional asset allocations.
In many cases, the neglect rests on an assumption that EM small caps are the high-risk, exotic cousin of their US or developed market (DM) equivalents. Today, the opposite is closer to the truth. Nearly nine in ten EM small caps (MSCI EM Small Cap Index) are profitable companies. In the Russell 2000, barely more than half are. The EM index trades at half the forward multiple of its US equivalent, on stronger balance sheets. Gains in EM small caps this year (+9%) have been built on earnings, while the US rally (+20%) has been almost entirely a re-rating. The universe is also quite distinct from the standard EM index itself; more domestic, less concentrated, less China.
In this month’s Emerging View, we set out why EM small caps belong back on investors’ radars.
MSCI EM SC vs US Small Caps (Russell 2000)
Intuition suggests that if investing in US small cap stocks carries more risk than large caps, then investing in EM small caps must be even more high-octane; a leveraged bet on risky economies. But drilling into the index fundamentals, the opposite emerges.
Earnings
The Russell 2000 (the Russell) and MSCI EM Small Cap (EM SC) indices are closely comparable in breadth and size. The Russell comprises 1,954 companies valued at USD 3.7trn, while EM SC holds 1,837 companies valued at USD 3.5trn.1 But sum the trailing earnings of every constituent – on the Street’s own ‘comparable’ basis, the standardised adjusted earnings on which consensus estimates are built – and the resemblance ends. The Russell’s constituents earned roughly USD 72bn over the past year. EM SC constituents earned roughly twice as much, approximately USD 141bn, despite their slightly lower aggregate market value.
EM small caps screen favourably against US small caps on earnings and valuation
Fig 1: Trailing net income on comparable basis: profits, losses and net
| Russell 2000 | MSCI EM Small Cap | |
|---|---|---|
| Constituents | 1,954 | 1,837 |
| Market value (USD) | 3.7trn | 3.5trn |
| Profitable companies (trailing) | 57% | 89% |
| Forecast to lose money | 23.7% | 2.7% |
| Net income, street (‘comparable’) basis (USD) | +72bn | +141bn |
| Net debt / EBITDA (median, ex-financials) | 2.23x | 0.61x |
| Companies with net cash | 23% | 41% |
| Forward P/E (1BF) | 24.5x | 13.5x |
| Forward PEG | ~1.6 | ~0.3 |
Source: Ashmore, Bloomberg. Data as at July 2026.
The pattern extends from what the companies have earned to what they are expected to earn. This is where this year’s market action deserves scrutiny. Small US caps are enjoying their first real moment of recognition in years: up more than 20% year to date, ahead of the S&P 500 (+9%), with flows and sentiment following the price.
Decompose the move, and almost none of it is real earnings growth momentum. Forward earnings revisions (which move markets more directly than earnings growth itself) for the Russell are just +0.2% on the year.2 The rally is therefore, arithmetically, a rerating; the forward multiple has expanded by roughly the full extent of the price move as investors have priced in a cyclical upswing.
EM Small cap earnings growth is not just a tech story...
Many of the very large swings in earnings per share (EPS) growth across small-cap universes come from unprofitable companies becoming profitable, and vice versa. This can be distortive to the headline figure. Stripping out unprofitable names can therefore give a different, cleaner read on organic earnings growth momentum. Here, the EM vs US growth differential is also robust. The profitable cohort of EM small caps is forecast to grow earnings by 42.1% over the next year against 15.4% for their US counterparts. That lead is not simply a chip-cycle illusion. Exclude every Taiwanese and Korean company and profitable EM small-cap growth is still 24.5%. This is also not a concentration effect. The median profitable EM company is forecast to outgrow its US counterpart by +26.3% to +19.7%.
Earnings growth drivers – sectors
Earnings growth in large-cap equities is becoming increasingly driven by technology companies. EM Small Cap has its fair share of rapidly expanding tech companies too. Information Technology (IT) is, unsurprisingly, the fastest growing sector in the index. The leaders include Taiwanese names such as Nanya Technology, Winbond and Phison, key cogs in the semiconductor complex at the heart of the AI buildout. Beneath them lies the physical layer of the data centre trade: companies such as Korea’s ISU Petasys, one of the few qualified manufacturers of the high-layer-count circuit boards used inside AI servers, and Taiwan’s Chenbro, which builds the server chassis. Both are net cash, high-return businesses compounding on their own economics.
...every sector in the index is growing earnings
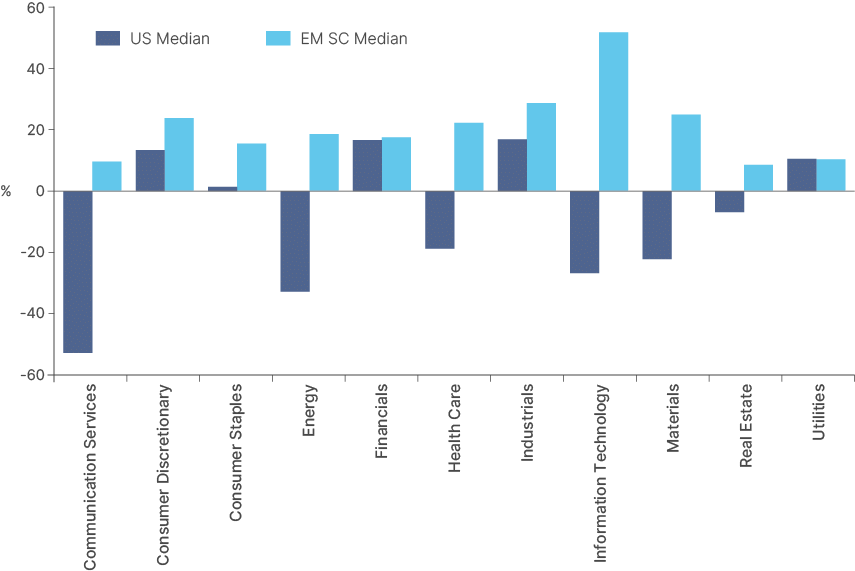
However, EM SC earnings growth is by no means confined to the AI complex. Indeed, in most EM sectors, the median EM company is expected to grow earnings close to or more than 20% a year in 2026 (Fig 2). This is a very different picture to the US small-cap universe, where the median company, including loss-makers, is expected to report negative earnings growth in six out of 11 sectors, including technology.
Fig 2: Median company earnings growth by sector
Earnings growth drivers – countries
Improvements in economic and monetary management across emerging markets in recent years have supported more stable corporate earnings, particularly for countries less directly exposed to rising technology investment. At the country level, aggregate organic earnings growth is remarkably broad. Taiwan’s is stratospheric, due to AI-driven demand for semiconductors. Only the Philippines is expected to record earnings decline over the coming year. Its domestic macroeconomic backdrop is weak, and its exposure to the Strait of Hormuz crisis is acute. Yet even there, the median company is still expected to achieve earnings growth. Türkiye’s outsized figure warrants a caveat: it reflects very high nominal inflation and the interest rate-normalisation cycle rather than comparable real growth. Between those extremes lie the domestic growth stories that form the core of the index, companies such as Poland’s Pepco, the pan-CEE discount retailer completing its turnaround, and India’s Coforge, the mid-cap IT services company securing multi-year enterprise deals.
Earnings growth is also positive across all EM geographies
Fig 3: EM small cap earnings growth by country
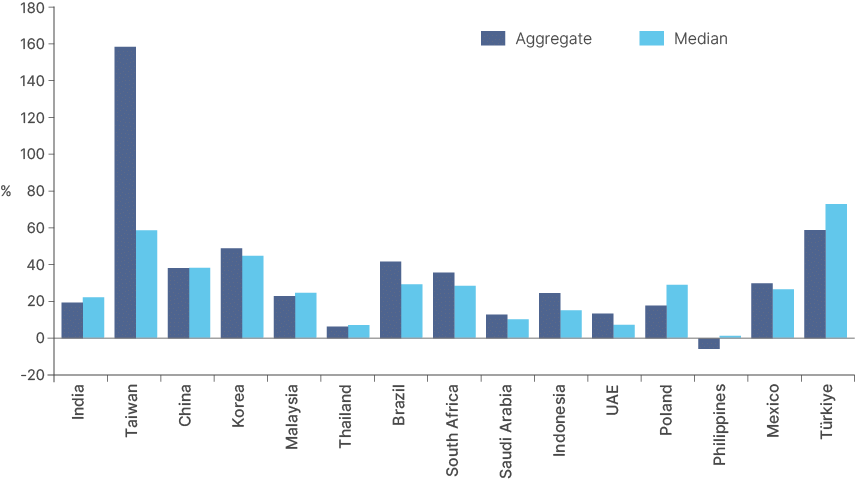
The drivers behind current technology earnings speak for themselves. But strong EM SC non-tech earnings growth speaks to the fact that traditional EM corporate earnings drivers – low penetration rates across industries, growing urban consumer classes and improving economic policy – are still at work across the investable universe – exhibited in the broad spectrum of earnings growth across the index’s geographies.
Valuation
Forward earnings are the basis on which we – and the market – value these universes. On that basis, the comparison between EM SC and the Russell is short and sweet: the higher-quality, faster-growing index (EM) trades at 13.5x next year’s earnings, while the lower-quality, slower-growing index (Russell 2000) trades at 24.5x.3 The US figure is the more generous of the two measures, as it already credits the Russell’s loss-making cohort with the recovery forecast by the Street. Put growth and valuation together, and the asymmetry compounds. EM SC trades at a forward price/earnings/growth (PEG) ratio of roughly 0.3, compared with roughly 1.6 for the Russell – a five-fold gap. Even using the ex-Taiwan growth figure, EM’s PEG remains below 0.5.
EM SC is trading at a PEG valuation of just 0.3, and 0.5 ex-Taiwan
Leverage
Small-cap companies typically hold more debt, particularly floating rate debt, relative to large caps. They are traditionally, therefore, more exposed to rate cycles. The received wisdom is that investors should increase their allocations to small-cap stocks as rates are falling.
That received wisdom has been tested this year. US policy rates have held at 3.50-3.75%, with markets pricing hike risk rather than cuts. Meanwhile, EM rate policy has diverged: Brazil and Türkiye have cut, while India, China and others remain on hold. Others have hiked due to inflation and FX strain from higher energy prices. Small caps in both universes have rallied regardless, but for different reasons. The US move has been a rerating on flat earnings expectations (forward revisions +0.2%), while EM small caps have risen on upgrades (+12.1%) without any tailwind from falling rates.
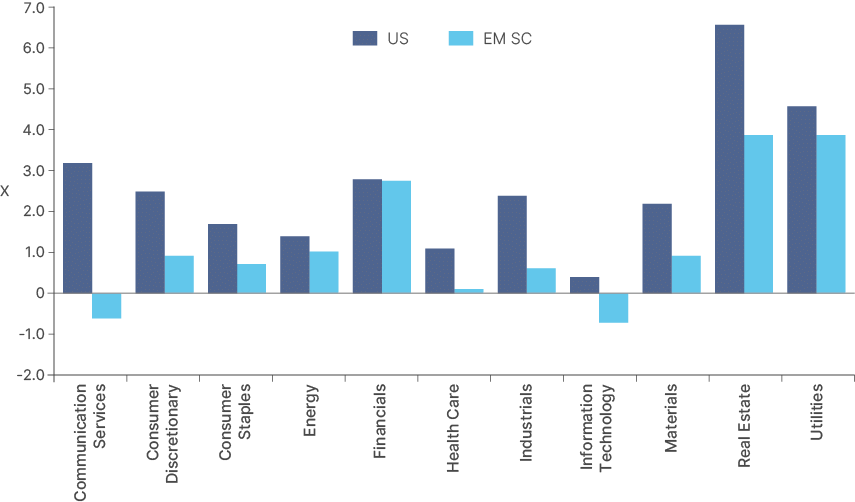
The fact that EM SC earnings expectations have increased in this environment, while US earnings expectations have flatlined, reflects another key feature of the comparison. EM small-cap leverage is much lower than in the US. This holds both at the index level and in each sector. Excluding financials, the median net debt/EBITDA ratio is 2.23x in the US and just 0.6x in EM.
This is not a temporary difference but a structural one. Most EM small caps operate within shallower financial systems, where cheap leverage is not available to the same extent as in the US. Another factor is that higher proportions of family-controlled companies mean there is much less appetite for bankruptcy risk, with these businesses preferring fortress balance sheets. As a result, 41% of EM small caps hold net cash today, against 23% in the US.4
Leverage in EM small caps is structurally lower than in the US
Fig 4: Median net debt / EBITDA by sector
Liquidity
For institutional allocators persuaded by the breadth of EM SC earnings growth and its valuation starting point, liquidity is the natural next objection. There are, of course, genuinely illiquid names within the index. At the index level, however, the data does not support the concern.
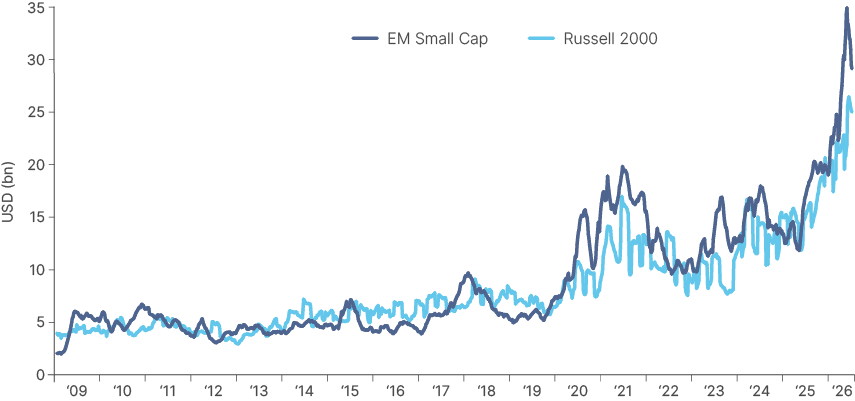
This is not a recent development. On a six-month moving average, on-exchange daily traded value in EM SC has repeatedly exceeded that of the Russell over the past 25 years, and today stands at around USD 29bn a day against USD 25bn for US small caps.5
Index liquidity is surging
Fig 5: Daily traded value, 6-month moving average (USDbn)
The comparison above is of cash equity turnover in index constituents, which is the relevant metric in determining whether a portfolio can be built and unwound. The Russell also carries an index futures and ETF complex for which EM SC has no equivalent; but that volume delivers index exposure rather than access to individual names.
Although the market caps of both indices are today quite similar, the average free float in EM small caps is lower due to larger founder, family and state stakes. As of July 2026, the free-float ratio of EM SC is 53% (USD 1.76trn of USD 3.34trn), versus 86% (USD 3.20trn of USD 3.71trn) in the US. Because MSCI index weights are themselves free float adjusted, that float is the investable universe, and the relevant question is whether it turns over enough to support the weights it implies, which it does. As a percentage of free float market cap, daily traded value is meaningfully higher in EM SC than in the US, running at a six-month average of around 1.7% today versus 0.8% for the Russell. The float that exists, in other words, trades roughly twice as hard.
Names trading below USD 0.5m per day account for just 1% of EM SC’s market cap
One might argue that index liquidity matters less than the size of the illiquid tail. On that measure too EM SC compares well: a smaller share of its 1,837 constituents trades below each of the USD 0.25m, USD 0.5m, USD 1m and USD 2m average daily value thresholds than of the Russell’s 1,954. The caveat is that measured by value the EM tail is larger: companies trading less than USD 2m a day account for 12% of EM SC’s free-float market capitalisation, compared with 5% in the US.
Fig 6: The illiquid tail
| Average daily traded value | EM SC % of names | EM cap share | US names | US cap share |
|---|---|---|---|---|
| Below USD 0.25m | 0.3% | 0.1% | 3.8% | 0.3% |
| Below USD 0.5m | 2.3% | 1.0% | 8.8% | 0.9% |
| Below USD 1m | 8.2% | 3.8% | 17.7% | 2.1% |
| Below USD 2m | 20.9% | 11.5% | 30.6% | 5.3% |
Source: Ashmore, Bloomberg. Data as at July 2026.
The tail is not nothing, but the constraint it creates falls on replication rather than on selection. A portfolio holding every constituent at index weight and selling a fifth of each holding’s daily traded value would need more than five days to exit 1.7% of its positions at USD 1bn, against 0.5% or less for the Russell – which is why EM small cap index mandates are generally run on optimised rather than full replication. For an active manager, the illiquid tail is a non-issue, nothing obliges a stock-picker to hold a company trading at USD 0.5m or even USD 1m a day.
MSCI Small Cap vs MSCI EM
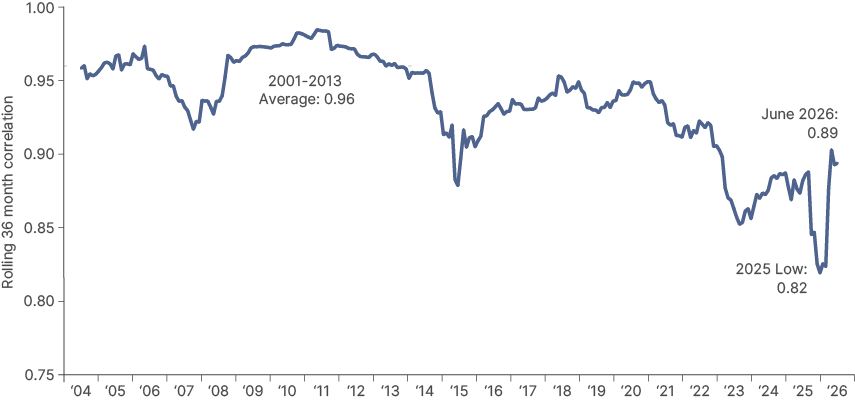
The correlation of returns between MSCI EM and MSCI EM Small Cap has historically been very high. However, this will not necessarily continue to be the case. Indeed, the correlation between the two indices has declined meaningfully over the past decade, and the trend is likely to continue.
Fig 7: Rolling 36-month correlation of monthly total returns, MSCI EM vs MSCI EM Small Cap
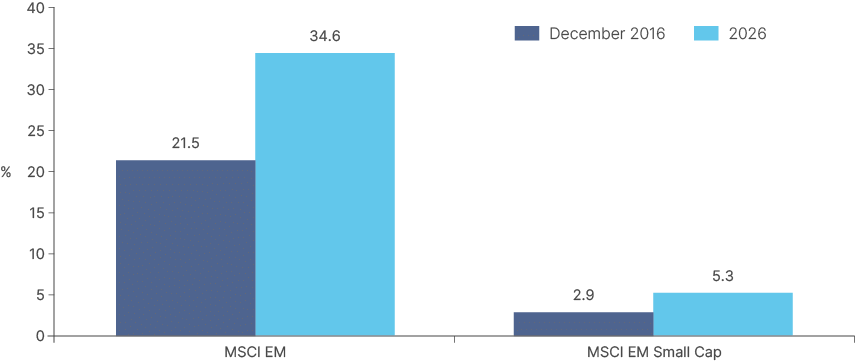
Part of the reason for this is changing index composition. Over the past decade, the MSCI EM index has become increasingly concentrated. In December 2016, its 10 largest constituents accounted for 21.5% of the index with the largest, Samsung, representing 3.8%. Today the 10 largest stocks account for 34.6%, while TSMC alone represents 14.2%, the heaviest single-company weight in the index’s three-decade history.
As large cap EM has become more concentrated, small caps provide diversification
EM SC has become more concentrated too, but not by much. Over the same period, the top ten stocks have moved from 2.9% to 5.3%, with no position above 1% of the index today. This, of course, is by design – if an EM small cap company gets too big, it is no longer a small cap and leaves the index.
Fig 8: Top-10 constituent weight, December 2016 vs 2026
The composition of the two indices by country and sector is also quite different. The starkest difference is EM SC’s much larger weight to India, and much smaller weight to China. The lighter weight is mostly due to MSCI exclusion of China’s A-share small caps – due to market access issues. China’s MXEFSC sleeve is therefore offshore-only (~275 HK/ADR names). But heavier exposure to India and lighter exposure to China is in keeping with another broad characteristic of EM SC stocks, which is a more direct exposure to domestic growth drivers rather than global investment cycles.
Fig 9: Index weight by country
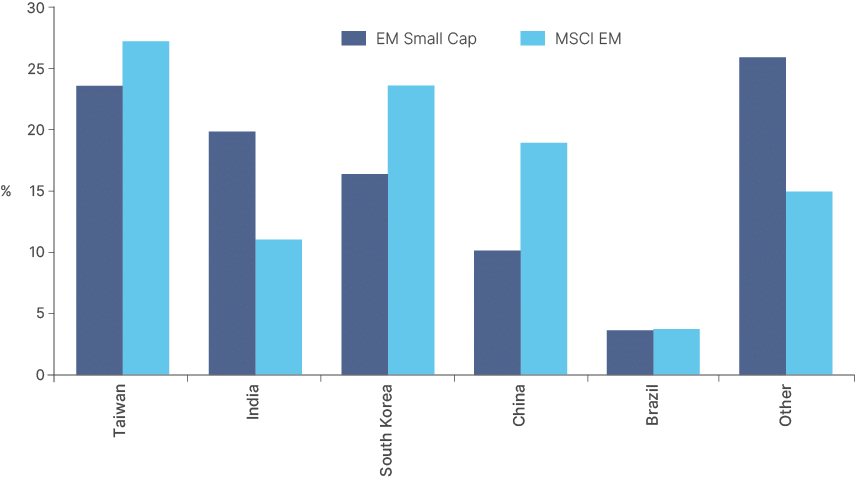
EM small caps have less China and more India...
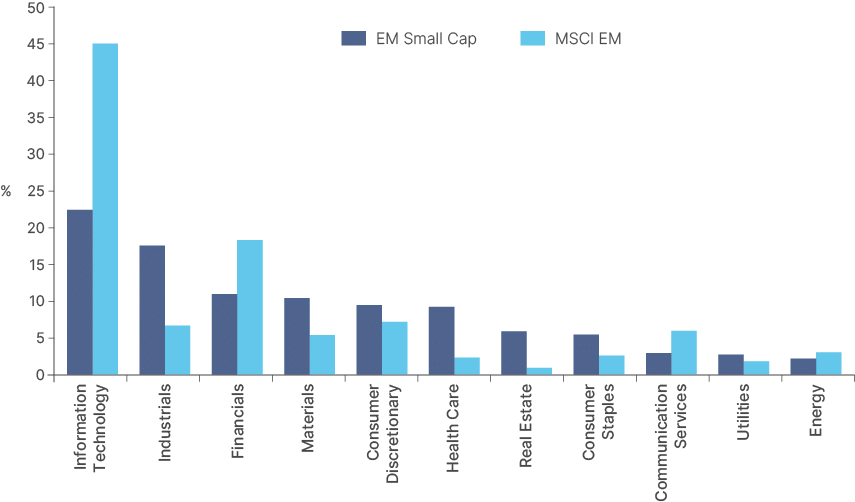
Small caps’ greater exposure to domestic growth is directly measurable in a few ways. First, in sector weights. The standard index now comprises 45% IT companies, mostly across North Asia. IT is still the largest sector weight in the small cap index but only makes up 23% of the index. The rest is split more evenly across industrials, financials, materials, healthcare and retail.
...and less exposure to IT than the MSCI EM
Fig 10: Sector weights (%)
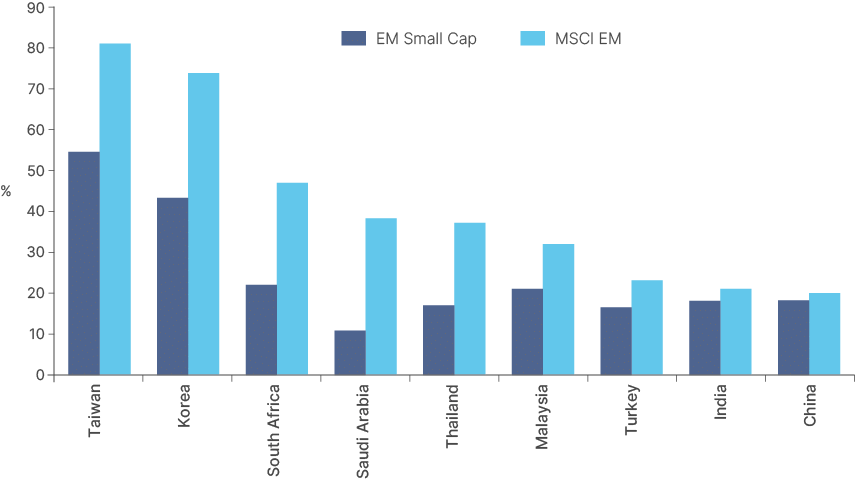
The second key metric to observe is the percentage of foreign revenue. On an index level, foreign revenue in EM SC is significantly lower at 28% vs 36% for the large cap index. On a country-by-country basis, however, the differences are wider in many cases – see Taiwan, Korea and South Africa.
Of course, the domestic revenues of Taiwanese and Korean small caps are not immune to swings in foreign revenues of TSMC and SK Hynix and Samsung; they are downstream of it. However, this is a different proposition to exposure to the revenues and earnings themselves, not least because semiconductor margins tend to decline as supply expands – which is what drives earnings for domestic supply-chain companies.
At a time when consensus estimates are for the growth premium between EM, particularly EM-ex China and developed markets to stay wide in the coming years, the entry point for exposure to this theme is attractive, and EM small cap stocks are perhaps the cleanest way to play it.
Lower foreign revenues reflect a more domestic growth profile
Fig 11: Foreign revenue share by country: small cap vs standard index
Long term performance record
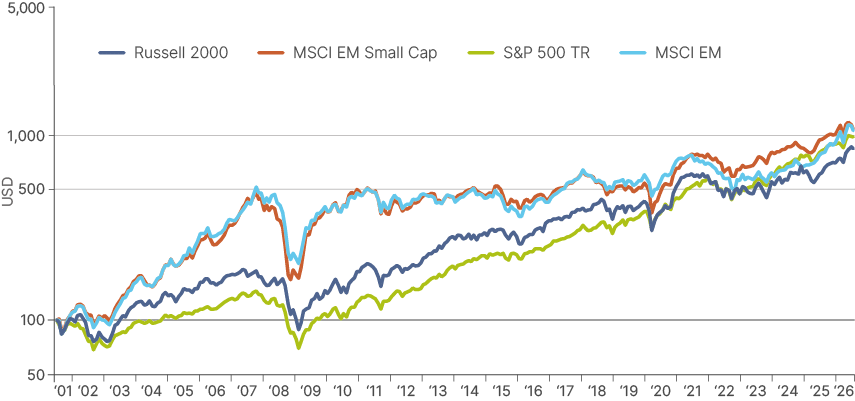
The long-term performance record of EM SC may surprise the unacquainted. Memories of the ‘lost decade’ after the global financial crisis linger, but the longer arc reads differently. Over 25 years, EM SC has delivered annualised returns of roughly 10%, including a stretch of more than 25% annualised between 2001 and 2007. During the 2020s, they have again matched US small caps, at around 10% annualised, but without the benefit of re-rating. Notwithstanding periods of poor performance, since 2001 EM SC has outperformed the Russell, the large-cap MSCI EM index, and the S&P 500 on a total return basis.
Fig 12: 25-year gross total return, USD, indexed (log scale)
Thin coverage leaves scope for outperformance
The final structural feature of the universe is related to the float arithmetic described above: smaller floats, retail-dominated order flow and local listing venues result in substantially less institutional research. The average MSCI EM large cap constituent is covered by 18 analysts, whereas the average EM small cap has eight. In fact, 27% of the index has fewer than three recommendations – a significantly higher share of effectively uncovered names than the Russell (16%).
At the extreme, some 400 EM SC constituents, representing USD 633bn in market value, or 18% of the index – have no forward earnings estimate at all on Bloomberg. These are not simply the index’s niche, low-quality companies. 82% of the uncovered names are profitable, and their median market value exceeds USD 1bn. Somewhat surprisingly, Taiwan, the index’s growth engine, is its least-covered market. More than a third of its constituents lack forecasts; research coverage has simply not kept pace with the AI buildout. Returns among uncovered names are 1.4x more widely dispersed than among covered constituents over the past year, strong evidence of the alpha opportunity available.
Thin index coverage leaves significant room for alpha generation
Fig 13: Analyst coverage: EM small caps vs comparators
| Metric | US / EM LC | EM SC |
|---|---|---|
| Average analyst recommendations | 18 (EM LC) | 8 |
| Names with <3 recommendations | 16.4% (RTY) | 27.4% |
| No forward estimate at all | 8.3% (RTY) | 21.8% |
| Uncovered share of index cap | 2.7% (RTY) | 17.9% (USD 633bn) |
| Uncovered cohort profitable | 60.1% (RTY) | 82.5% |
| Dispersion, uncovered vs covered | 1.1x (RTY) | 1.4x |
Source: Ashmore, Bloomberg. Data as at July 2026.
Summary & Conclusion
As large cap indices become increasingly concentrated in a handful of technology names, exposure to more diverse growth drivers should be a live consideration for allocators, and emerging market small caps are one of the best ways to obtain it, in our view. Correlation with EM large cap has historically been high, but deviating sector composition, country composition and index concentration now provide three separate layers of differentiation.
Earnings growth is strong on both trailing and forward measures and spread across countries and sectors rather than concentrated in one or two themes. As earnings growth expectations continue to rise, valuations look increasingly attractive – particularly against US small caps. Leverage is perhaps the underappreciated point: where US small caps carry a large loss-making cohort funded at floating rates, 41% of the EM index constituents are net cash.
The best way to approach the asset class is actively, in our view, to both avoid the less liquid tail of the index if necessary and to take advantage of the ample alpha generation opportunities in a thinly covered, but highly profitable universe.
1. As at 26 July, 2026.
2. Measured on a constituent-matched basis, adjusting for the June index reconstitution.
3. Forward multiples are float-weighted constructions over covered constituents, built from constituent-level consensus estimates on the comparable basis. The growth figures in the preceding section are full-company aggregates over the profitable cohort. The two are not directly divisible into each other; the wedge reflects the forecast swing of the loss-making cohort, which is far larger in the US.
4. Net debt/EBITDA numbers, Bloomberg. Data as at 26 July 2026.
5. Traded value throughout is on-exchange volume. In the US, roughly half of consolidated equity volume executes off-exchange, through alternative trading systems and retail wholesalers, so the Russell figure understates total US turnover; off-exchange activity is negligible across most EM venues. We use on-exchange volume as the closest like-for-like measure, and because internalised retail flow is not accessible liquidity for an institutional order. On a consolidated basis the two universes are closer to comparable.