
Short on time? Download the four-page summary.
Disinflation, not debasement points to 'goldilocks' in 2026
Despite elevated uncertainty from US tariff policy, 2025 has been the strongest year for EM asset outperformance since 2017. Broad-based rate cuts and a weaker US dollar supported the rally, but the results also highlight the resilience of EM economies, the flexibility of global supply chains, and increasingly robust institutional frameworks that continue to accelerate reform programmes and anchor macro stability across much of the EM universe.
Looking into 2026, the peak in US policy risk appears to be fading. China's disinflationary impulse and AI driven productivity gains mean global inflation is likely to move lower, in our view. This would give the Federal Reserve and other central banks room to continue easing, supporting stable global GDP growth and faster growth in countries with still-elevated real interest rates, such as India and Brazil. Versus consensus, we see global inflation risks skewed to the downside and global growth risks skewed to the upside, raising the probability of ‘goldilocks’ conditions. The Federal Reserve continuing to cut rates in 2026 implies a soft USD. And with inflation expectations falling, the widely cited “debasement” narrative that would imply a steeper US yield curve looks overstated.
With global macro conditions set to stabilise in 2026, in our view, alpha generation opportunities will switch meaningfully back towards micro drivers. Country-specific opportunities in the EM universe remain diverse, with various ongoing structural reform processes, elections, and the ongoing AI capex cycle providing ample opportunity for active outperformance.
Introduction
The key global theme of 2025 was US policies. Our US ‘policy constraints’ framework published in last year's outlook has been a useful investment tool. As anticipated, bouts of market volatility led US President Trump to soften his trade measures numerous times, with political pressure over higher prices also leading to further climb-downs of tariffs this autumn. But in the end, higher US tariffs were put in place than most investors expected, with the US weighted average tariff rising from around 2% to nearly 15%, albeit down from the low-20s at the peak of trade tensions.
This major policy shift, alongside questions over institutional deterioration, led to a re-evaluation of ‘US exceptionalism’ throughout the year, which supported emerging market (EM) asset outperformance. As we expected, out of consensus, it also led to a weakening of the US dollar and a positive for EMFX. It did not wreak the economic havoc that most predicted, thanks to the resilience and flexibility of global supply chains. Tariff revenues also led to some fiscal consolidation in the US this year, with the US deficit declining from 7.0% of GDP in 2024 to 5.8% as at Q3 2025. Albeit a small improvement, this is certainly not irrelevant and together with weaker growth meant US bond yields have fallen significantly since January. Lower US rates have kept the USD softer, giving more room for central banks around the world to cut. This has supported financial conditions globally. More favourable macro along with economic resilience and sound policymaking drove emerging market asset outperformance for the third consecutive year in fixed income, and the first year since 2020 in equities.
Tariffs will likely be a fading theme in 2026 but will likely continue to affect US inflation and growth. The rerouting of Chinese exports away from the US and towards Europe and EM is having significant deflationary effects and will continue to do so, even as Sino-American trade relations are now improving. But with peak tariff risk in the rear-view mirror, the market is now focusing on new narratives. The ones to monitor most closely are:
- The AI capex cycle will remain key both for the global economy and markets. In our view, the sequencing of AI’s impact on macro will be the most important dynamic to monitor in 2026. We see the first order effect of AI as disinflationary, or outright deflationary in 2026. The primary channel of this will be via the labour markets.
- China doubling down on its export-led development model will keep bringing waves of deflationary impulse to the world.
- The monetary debasement narrative. Fiscal concerns remain front-and-centre on investors' radar. However, we find the debasement narrative to be stale and not firmly corroborated by the current data and the AI deflationary waves, particularly as…
- …. geopolitical risks are easing, with certain exceptions such as in Venezuela.
- EM ex-China GDP growth keeps inching up. We see upside risks for GDP growth in many key EM countries, including China, India, Indonesia, Mexico, Brazil, South Africa and frontier market (FM) economies implementing ongoing adjustments
- EM equities are likely to outperform as investors focus on asymmetric return profiles such as Latin American equities. Contrarian investors should keep an eye on China’s consumption and real estate.
- Credit spreads remain tight, but all-in yields and improved fundamentals in EM debt offer the potential for good risk-adjusted returns, particularly relative to other debt markets. EM local currency has the potential to deliver another year of double-digit returns.
1 | 2026 Outlook driven by the AI capex cycle
Despite bubble fears, the AI capex super-cycle continues to be the engine driving GDP growth in the US, exports in North Asia and to a certain extent, global risk sentiment. This dynamic will persist next year, in our view. The investment implications of this structural shift in technology are huge, both in macroeconomic terms and for the earnings of exposed companies. Though the epicentre of investment will remain the US, it is very much a global theme. Further upstream in supply chains, many of the companies that stand to benefit most are EM-based.
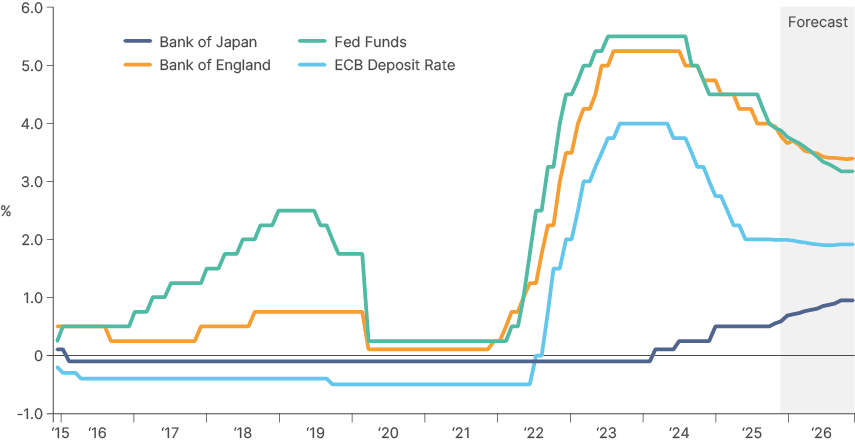
Underpinning the strength and length of this investment cycle will be global liquidity conditions and borrowing costs. Should liquidity remain supple next year, and rates continue to fall, the bar for AI-related assets to keep performing will be considerably lower. We see an element of micro-to-macro circularity here. If AI proves to be deflationary next year through higher productivity and lower employment, as we suspect it will, central banks will have more room to ease monetary policy, supporting liquidity and a further softening of the USD. At some stage, bottlenecks in energy, metals and credit will likely become a reality and will bring some inflationary friction to the buildout of AI capacity. Yet, these factors are not yet evident constraints at this stage and therefore are unlikely to be the main story for next year.
Fig 1: G4 policy rates implied forwards
a. Sequencing of AI: Creative (jobs) destruction first
The largest companies and the largest economies (US and China) in the world are determined to stay ahead in the AI race and investing accordingly. Mark Zuckerberg summed up well the logic behind the scale of spending on a podcast earlier this year. Meta is planning to invest USD600bn on datacentre capex in the coming years, with USD225bn coming in the next two years.
If we end up misspending a couple of hundred billion dollars, I think that that is going to be very unfortunate, obviously. But what I’d say is I actually think the risk is higher on the other side. If you build too slowly, and superintelligence is possible in three years, but you built it out assuming it would be there in five years, then you’re out of position on what I think is going to be the most important technology.
The US budget approved on the 4 July contained large tax benefits for manufacturing capex and research and development (R&D), the costs of which will now be fully tax deductible in the first year. This creates an additional incentive for the private sector to double down in the AI race, freeing up more free cash flow for hyperscalers to invest. Importantly, the largest investors are so far mostly funding capex through deploying their own excess cash and free cash flow from robust operations.
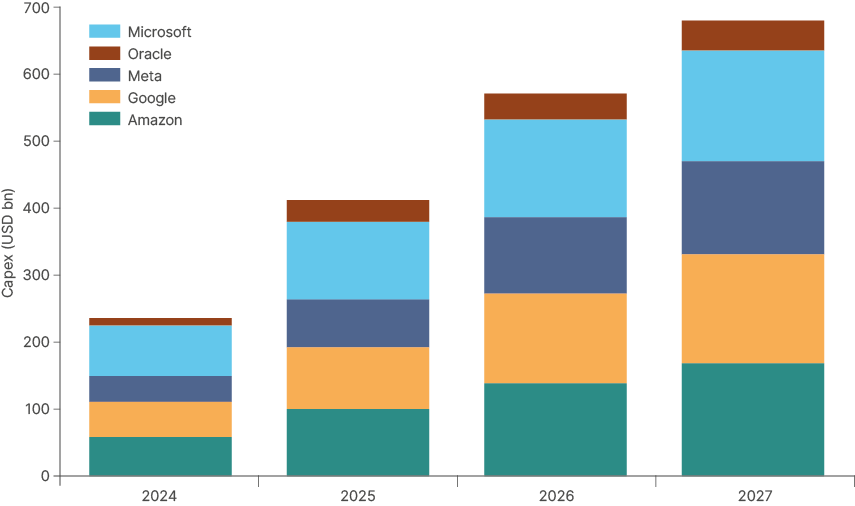
This train is unlikely to stop. The current AI capex cycle remains in its early innings and is likely to be the largest in recent memory. The 5 largest hyperscalers alone - Amazon, Google, Meta, Microsoft, Oracle – have committed to investing at least USD3tn in datacentres over the next 5 years. Only around 20% of this capital has currently been deployed.
Fig 2: Hyperscalers capex announcements: 2024-2027
Like many investment booms, we see AI working primarily as a deflationary force. This is related to its ability to boost productivity by leveraging computing power to solve day-to-day problems and optimise processes. In the long-term, innovation will create new industries and new jobs. The buildout of AI capacity itself will also create many new jobs in datacentres, energy generation and other adjacent industries. But AI productivity gains will likely cause more job losses than gains as AI adoption broadens across industries. As legacy business models are shaken up in the next quarters across multiple areas of the world economy, we find it difficult to see how AI won’t be an upwards force on unemployment rates in the US and indeed globally.US unemployment remains low at 4.3% but has already risen to its highest point since 2021. If the labour supply hadn’t stopped growing this year, which it did due to Trump’s aggressive immigration policies, the number would very likely be higher. Now, if joblessness continues to rise in the US amidst AI disruption and low hiring – the Fed will most likely cut rates down below 3% in 2026.
A moderate increase in unemployment rates is unlikely to de-rail the acceleration of capex plans. Importantly, easier financial conditions would allow for an increase in breadth of economic performance, and a broadening of market returns into cyclical sectors, which have been in a downturn since 2022. But most importantly for investors in emerging economies, the Fed lowering rates will give more room for global central banks to lower rates too, particularly in EM where real rates are elevated in many cases.
In our view, this provides a solid backdrop for another year of EM asset performance particularly in local bonds and equities. Differentiation across asset class will be key in 2026, with the focus shifting back towards micro drivers.
b. AI and macro: a 'double-S curve'
Much of the slowdown in hiring in the US jobs market this year has related to tariff uncertainty, and the overhang of the very tight job markets in the two years post-COVID. However, commentary from corporate America makes it clear that efficiency gains are set to drive job cuts in the coming years. AI adoption is already benefiting companies outside of the IT sector. Warehouses were the leading sector for US job announcements in October. It is very likely that this sector, with razor-thin margins, is accelerating automation because of the import tariffs imposed by Trump. Creative (jobs) destruction across a broader set of industries can de disinflationary, or even outright deflationary, if the Fed doesn’t react early enough.
The higher price from tariffs and fears of job losses means that consumer confidence has now softened, which is also leading to a hit on consumer discretionary names in the US. The University of Michigan Consumer Sentiment Index fell to 51 last month, the lowest since 2022, and the second lowest ever. Weak sentiment, alongside the fact that China will keep exporting deflation to the rest of the world for the foreseeable future (see China section) means we are likely to see further disinflation in the short term during the first leg of the AI “double S-curve” as per Fig. 3:
Fig 3: The stylised ‘double-S-curve’
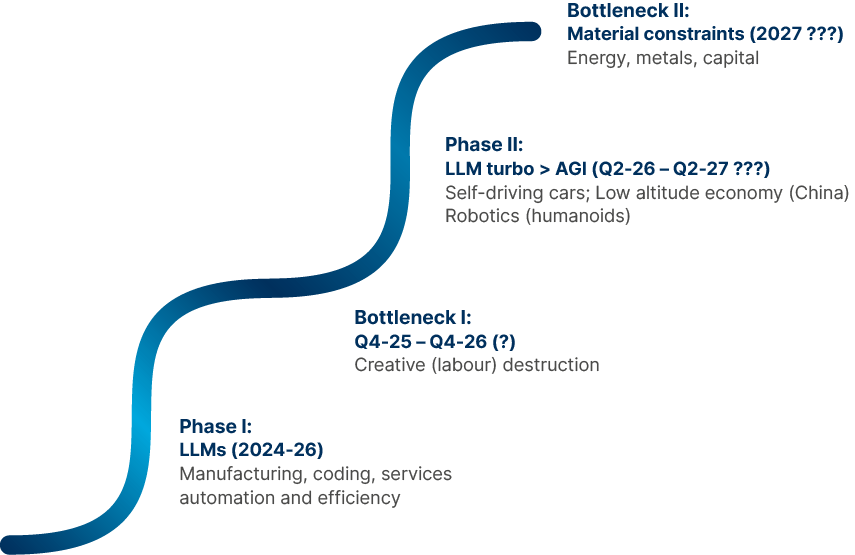
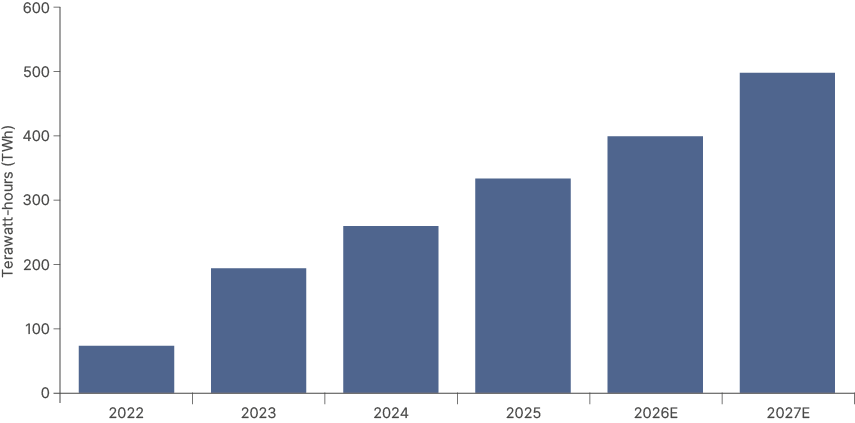
If AI maintains its breakneck pace of development and growth, increased adoption will likely bring material constraints. The most obvious of these will be electricity. If the hyperscalers’ capex plans are fully implemented, analysts expect demand for energy from AI in the US to increase by 50% by 2030, even after allowing for an estimated 30% efficiency gain from technology.
The key question is the timing of the real-world constraints. Energy supply is currently abundant globally. The US Energy Information Administration (EIA) and JP Morgan see the oil and gas markets in a surplus throughout 2026. However, several studies suggest energy could become a constraint towards the end of 2026 or in 2027.1
Fig 4: Energy demand forecast
Power required for AI data centers to run newly added AI servers per year
This is also likely to be the time when electricity generation becomes a constraint, particular in the US. This may be the point when AI reaches the second plateau of our stylised “double S-curve” thesis. A disinflationary credit creation before the real-world constraints is our running working hypothesis.
c. China and US face different constraints on AI
How supply constraints are managed may ultimately end up defining the outcomes of the ongoing ‘AI-race’ between the US and China. China has constraints around supply of GPU clusters. The US not only dominates the production of advanced semiconductor hardware but also has more specialised engineers. However, China has much more abundant supplies of key strategic metals and energy, as per Fig. 5. China also has a much larger number of internet users and has had faster adoption. China’s dominance in strategic metals and rare earths gives it ‘escalation dominance’ in any trade dispute with the US in the short term.
Fig 5: China vs. US
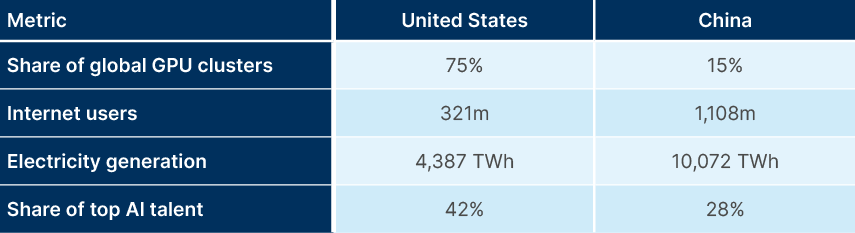
But perhaps the crucial difference lies in the countries’ different approaches to monetising the technology. China’s engineers in the manufacturing sector have been very successful at optimising processes and accelerating automation. Advanced manufacturing that benefits from AI includes self-driving cars, humanoid robots, and the low-altitude economy (drones for delivery and transportation). While the largest companies in the US are spending huge resources on an artificial general intelligence (AGI) ‘race’, China is focusing on optimisation. That means China could become a big loser in the future if it doesn’t manage to catch up quickly at the cutting edge of AI tech. But on the other hand, given China’s lack of constraints around energy, it stands a better chance of monetising AI tech more effectively through productivity increases in its economy.
d. The malinvestment hypothesis
Not all AI-related investment will be successful. But the broad malinvestment hypothesis is unlikely to be accurate. AI has already been driving tangible increases in productivity for the leading adopters. Technology companies have been increasing earnings while reducing headcount. It is hard to argue that the hyperscalers investing in their cloud businesses face a material risk of malinvestment, given their oligopolistic position provides the lifeblood of the modern and future economy: compute power.
For the non-core companies, the question is more nuanced. Investors have been cautious about ambitious AI investment plans for companies without a clear business case demonstrating a high internal rate of return (IRR) and cash generation. The recent performance of Meta shares Oracle credit default swaps in the US and property search platform Rightmove in the UK illustrate this point. As in any technology cycle, there will be many companies that won’t deliver the return on investment from their AI capex spending and will disappear (or become too small), while a small number of companies will likely see a substantial increase in their market cap.
2 | China exporting deflation to RoW
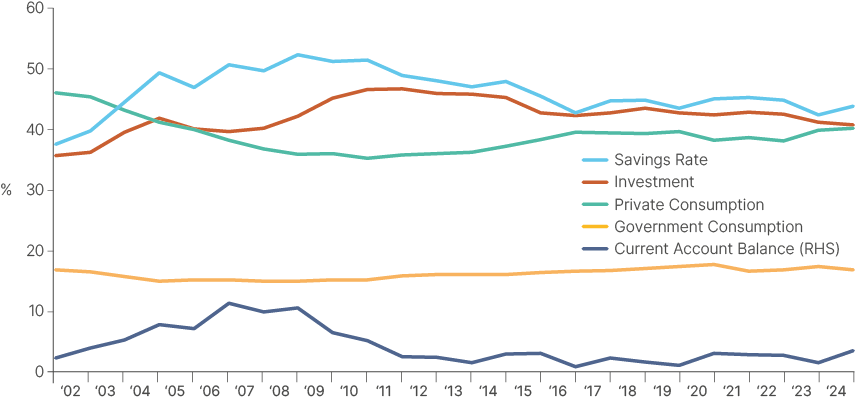
The other macro trend justifying a goldilocks environment for asset prices next year is the export of Chinese deflation to its trade partners. China has one of the highest national savings rates in the world, high enough to fund very high levels of investment (circa. 40% GDP) and run a current account surplus (Savings – Investment = Current Account Balance).
However, structuring the economy in this way has led to major imbalances (too much supply, too little demand) which led to a crash in housing prices in 2021 and has now brought about a broader deflation problem (see China outlook section below).
Fig 6: Chinese GDP composition
Since September 2024, China has been implementing policies to boost retail sales and address this problem. Recent emphasis has been put on boosting service sector consumption, which can be an important source of employment. Investments in improving the social safety net, particularly pensions for rural employees, will be taken gradually. However, the piecemeal approach China is taking to rebalancing its economy indicates that the deflationary environment is likely to stay in place for the foreseeable future. Rather than making consumption the top priority, the readout of the 15th Five Year Plan that came out of October’s fourth plenum put the clearest emphasis on investing further to boost productivity across the Chinese high value add manufacturing sector. China then hopes leadership in high-tech sectors can raise companies’ earnings and subsequently salaries and consumption. This can happen, but will be a long-term process.
In a world where the US external accounts are expected to rebalance only gently over four years due to tariffs, China will probably keep gaining market share in global manufacturing. Goldman Sachs revised its forecast for Chinese GDP growth to 4.8% in 2026, up from 4.0%, led by increasing exports. But as Chinese producer prices remain in deflation, exporting more goods to trade partners will continue to drive prices lower in their economies.
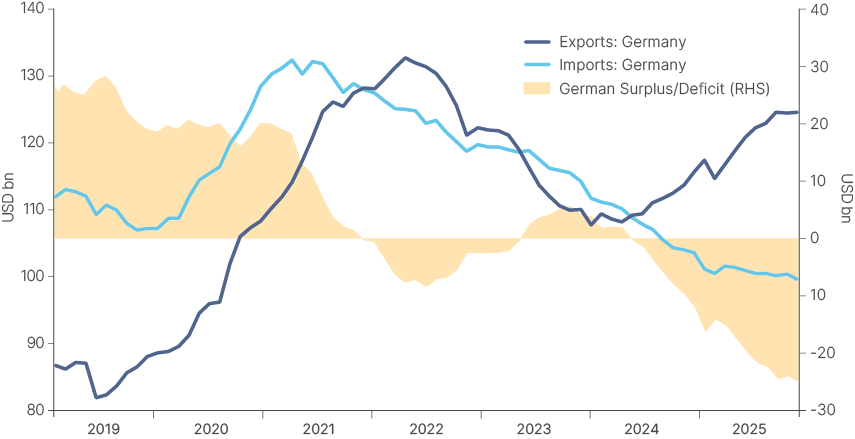
Germany has been the main loser of the Chinese boom in high value add manufacturing, particularly electric vehicles and industrial machinery. For the German industries hollowed out by Chinese competition the EUR 1trn defence, infrastructure, and energy capex has been little consolation, so far. Germany has shifted from a trade surplus with China just two years ago to a monthly deficit of around USD2bn today. And because China remains an important market for European manufacturers, the disrupted industries are reluctant to support tariffs of Chinese products.
Fig 7: China trade with Germany
Countries whose supply chains are complementary to China’s, such as Taiwan, South Korea and Malaysia have been benefiting from the Chinese manufacturing boom with cheaper inputs leading to greater profits in their outputs. However, they also may lose out if China becomes a ubiquitous exporter of lower value-add memory chips – something that has not yet happened given the large domestic demand for Chinese chips. Other countries like Thailand, have received large investments from Chinese EV companies, but their traditional auto sector supply chain has been cannibalised in the process. As China becomes more assertive, industries such as the low altitude economy (delivery and even transport drones), aircraft (competing with Boeing and Airbus duopoly), shipping, aerospace, and other heavy machinery industries can also suffer under Chinese competition.
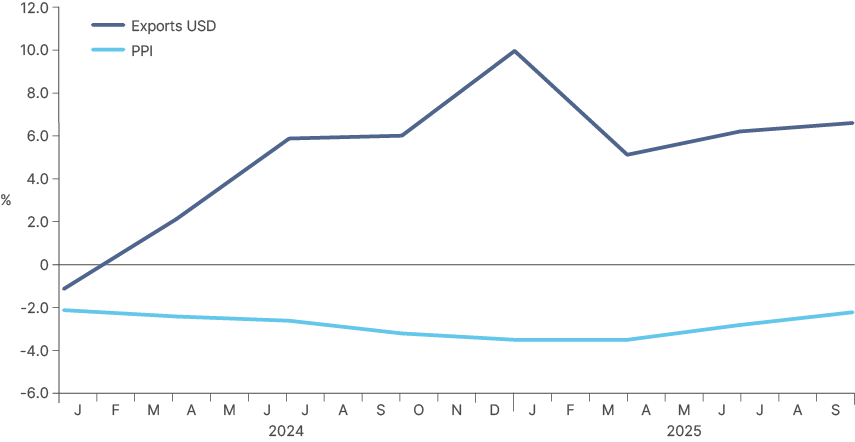
But for now, the key impact across EM is the fact that as China's export volumes increase and producer prices decline (Fig. 8) China will continue to export deflation to the rest of EM. This trend, alongside the disinflationary impact from AI, will add momentum for central banks to cut policy rates, setting up a ‘goldilocks’ macro environment of stable growth and very low inflation.
Fig 8: China PPI vs Exports USD yoy
3 | Monetary debasement: Trends, the narrative, and recent developments
Global public debt is at record levels and economic growth is at risk due to ageing populations. This dual problem is most concentrated in the developed world. Now, higher interest rates pose a threat to governments’ ability to deliver on the social contract, invest in future growth and fund defence budgets. But with spending cuts and tax hikes both politically difficult in polarised democracies susceptible to populism, developed countries continue to run elevated fiscal deficits.
On the face of it, this is a fertile ground for monetary ‘debasement.’ Monetary debasement simply refers to a loss of value of fiat money. This is most often caused by rising, unsustainable government spending, which leads to higher inflation via the faster expansion of money supply. This dynamic can become more concerning when government spending runs out of control, forcing central banks to buy bonds to anchor interest rates and prevent a financial crisis. This ‘fiscal dominance’ scenario tends to lead to faster depreciation of the currency against hard assets, equities and durable goods. By default, this also reduces the real value of debt in issue.
We were given a taste of this kind of environment during the pandemic. To keep economies afloat, the fiscal stimulus enacted was comparable only to the efforts during the great wars. The impact on inflation was very pronounced because, from 2020–2022, as in 1939–1945, monetary policymakers engineered low interest rates throughout the period.
Fast-forward to today, few believe that major governments can impose fiscal discipline over the long-term. Many are expecting ‘fiscal dominance’ dynamics to re-emerge, with central banks accommodating fiscal indiscipline by financing deficits. The rapid expansion in the monetary supply which would follow would debase fiat currencies. This year, the narrative has intensified due to the risk of the US Federal Reserve becoming ‘captive’ to the White House and keeping interest rates low even with inflation running above target. The narrative has started to be reflected in asset prices, primarily in the rally in gold this year.
However, we think the zeitgeist is exaggerated here. The US has consolidated its primary deficit this year, which has fallen from 3.8% in 2024 to 2.7% by Q3 2025. Tariffs have been the main tool to achieve this, helping bring nominal US bond yields lower but also leading to a decline in real rates, in both the front and long end of the curve (2y, 10y). Low or negative real rates are a symptom of ‘debasement,’ however inflation expectations over both 2 years and 10 years (US breakeven inflation is a proxy for this) have fallen since the start of the year. If what we were seeing was a pricing of debasement, we would expect to see inflation expectations rising, and compressing real rates further.
Fig 9: US 10yr Nominal vs Real Yield
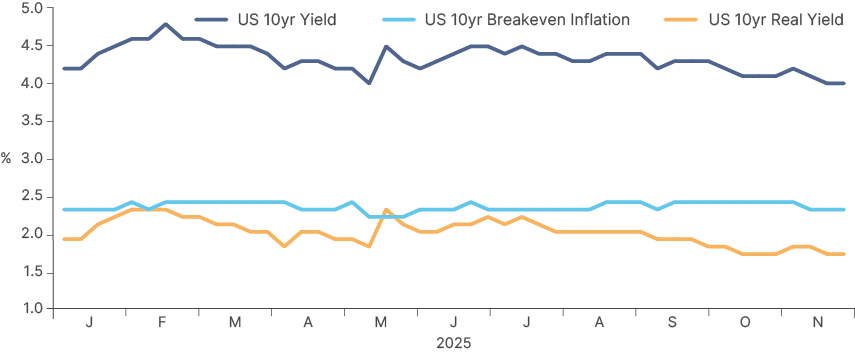
US inflation does remain above target but is largely under control after 3 years of the Federal Reserve maintaining policy rates above inflation. We are in a world where US nominal GDP growth exceeds the nominal cost of debt, which helps support debt sustainability dynamics. But because the nominal interest rate exceeds inflation, this does not constitute debt debasement. Holders of government debt receive positive real return. Any further disinflationary impulse, such as from AI, would then constitute a full 180o away from debasement.
The US is not alone in its efforts to stabilise its debt. Italy has taken steps to reduce debt burdens and improve primary balances, even if debt-to-GDP ratios remain very high and, in Italy’s case, have recently inched up again. The UK and France are being forced into tighter fiscal policy by market pressure and EU rules. Japan is an outlier – it has stabilised debt-ratios in recent years but is now flirting with debasement dynamics again by bringing the fiscal deficit back towards 3% at a time when monetary policy is very expansionist, with real rates still at deep negative levels.
Can the US keep consolidating its deficit? Tariff revenues are on track to reach around 0.5% of GDP in 2025 and possibly 1.0% of GDP or more in 2026. Any adjustment won’t be linear. The One Big Beautiful Bill Act (OBBBA) has incentives for research & development and manufacturing investment which will offset the tariff revenues in 2026. On the other hand, as AI capex-driven private sector growth accelerates, this will broaden the tax base, which could support a more sustainable consolidation. Because tariffs are likely to become a permanent revenue source, as the capex incentives gradually phase down, the US can plausibly move back onto a fiscal consolidation path in 2027 and 2028.
If AI is indeed disinflationary, as we expect it to be, the global macro picture will turn closer to goldilocks than to debasement next year. High growth, low inflation, and positive real rates even as central banks cut further. In this environment, government debt ratios can stabilise (nominal growth > average interest rate) but for the right reasons. This is particularly true considering that geopolitical risks are de-escalating.
4 | Geopolitics: Improving after an ugly 2022-2024
Taiwan Strait
Tensions between China and Taiwan are likely to remain elevated in 2026. This year saw major military exercises in the strait from both sides. China held a two-day exercise “Strait Thunder-2025A”, involving the most naval vessels in nearly a year. From 9-18 July, Taiwan held its largest-ever Han Kuang military exercise, involving the biggest mobilisation of reservists and extending to 10 days to improve its response to Chinese "grey zone" tactics.
Domestic defence commitments have also accelerated. In August, Taiwan’s President Lai Ching-te announced a plan to lift defence spending to 5% of GDP by 2030, a move that coincided with renewed geopolitical concerns and ended an eight-week streak of foreign equity inflows, with outflows reaching –USD 4.1bn. Taiwan later proposed a 23% increase in its 2026 defence budget to TWD 949.5 bn, aligning with U.S. calls for greater regional burden-sharing. In November, the government distributed 11m national security handbooks to households, offering guidance on emergency preparedness - signalling ongoing concern over potential contingency scenarios.
Nevertheless, the likelihood of a blockade or invasion remains low in the near term in our view. The economic costs would be severe: Taiwan controls over 60% of global semiconductor manufacturing capacity, including more than 90% of leading-edge chip production. China’s reliance on export-led growth, and foreign demand for its products, makes it very sensitive to the global growth demand shock a bottleneck in semiconductors would create. Moreover, at a time when China’s domestic economy is weak, it would find it hard to deal with the high sanctions and tariffs which would likely arise from an act of aggression towards Taiwan next year. The ongoing purging of the People’s Liberation Army leadership is another signal. Long-term, a reunification of China and Taiwan remains a high risk, but the current economic backdrop creates strong disincentives for any large-scale conflict going into 2026.
Middle East
From an investment perspective, the key reduction in geopolitical risk in the Middle East came after the US brokered a summer ceasefire between Israel and Iran. This reduced the major risk to oil supply, which was Iran blocking the strait of Hormuz. The recent Israel/Hamas ceasefire and hostage deal that took effect on 10 October has improved the situation further. Brent is now trading in the mid-$60s, roughly 15% below its 12-day-war peak.
Nevertheless, the broader regional backdrop remains highly unsettled. Gaza remains an unsolved situation, with millions of people displaced and almost daily skirmishes between Hamas and the Israeli Defence Forces (IDF) ongoing. The short war between Israel, Iran and the US, including US-Israeli strikes on Iran’s nuclear facilities at Natanz, Fordow and Isfahan (and Iran’s retaliatory missile attack on the Al Udeid base in Qatar) ended without regime change in Iran. It also left Iran’s nuclear programme damaged but not destroyed. The International Atomic Energy Agency (IAEA) estimates that around 400kg of 60%-enriched uranium remains, while Tehran has suspended cooperation with the Agency. As Israel continues tactical strikes across the region, including on Hezbollah leaders in Beirut this month, Iran’s condemnation, and threats of renewed direct confrontation are rising.
It is a fragile equilibrium, but more stable than 24 months ago. There has been a political transition in Syria and Hezbollah is much weakened in Lebanon, a country now discussing and implementing structural reforms. The engagement of international authorities, led by the International Monetary Foundation (IMF) raises hopes of a gradual but lasting political-economic normalisation in Lebanon. Despite the backlash against Israel’s campaign in Gaza across the Middle East and the world, the Abraham Accords are holding and an Israeli rapprochement with Saudi Arabia is under discussion behind the scenes.
In the meantime, the macro data is improving. The IMF now expects Middle East North Africa (MENA) growth of about 3.3% in 2025 and 3.7% in 2026, helped by higher oil output, strong non-oil activity in the GCC and easing inflation, which is projected to stay below 2% in many Gulf economies. Middle East sovereigns continue to show ratings resilience, with reforms and strong buffers meaning no issuer sits below CCC+ for the first time since 2019.
Ukraine
This year Trump’s Alaska and Washington diplomacy raised expectations but has delivered little progress so far, with news flow focused on Russia–NATO and energy risks, though we still judge the balance of risks to favour eventual de-escalation over a wider conflict.
Airspace incidents across Poland, Estonia and the Nordics highlight a pattern of Russia testing NATO boundaries. Ukraine faces a USD 65bn funding gap across 2026–27, with only about half of next year’s financing clearly identified. The EU’s effort to use frozen Russian assets as collateral for long-term “reparation loans” could stabilise Ukraine’s funding path, though it may also enable the conflict to be sustained for longer.
At the same time, the Russian economy has slowed to near stagnation after the 2023–24 boom, and the 2026 budget raises VAT from 20% to 22% while holding defence spending flat to contain the deficit. These measures increase pressure, but not yet to the point where the Kremlin is prepared to adjust its strategic objectives going into 2026. Structural damage to Russia’s refining sector — with close to 20% of capacity offline at points — also limits any sharp post-war recovery in fuel exports.
The diplomatic landscape has shifted with Washington now revising its peace plan after strong European and Ukrainian resistance to the initial 28-point proposal released in late November. Kyiv and European partners are pushing for firmer security guarantees, protection of sovereignty and clearer reconstruction commitments. Moscow continues to reject key elements, but the White House’s more assertive tone — including the threat to sanction Russian oil exports — and deeper behind-the-scenes engagement suggest that negotiations are entering a more active phase. Overall, the path to a ceasefire remains uncertain, but the direction of U.S. policy still points toward managed de-escalation rather than renewed escalation.
Eastern Europe: Supported by the EU Defence Capex
The EU is moving into a multi-year defence investment phase, anchored by Security Action for Europe (SAFE) (EUR 150bn) loans, Recovery and Resilience Facility (RRF) funds and Cohesion funds. This represents the largest structural fiscal impulse in the Central and Eastern Europe (CEE) region since EU accession. The programme will support growth, lift industrial demand, and keep local curves steep via higher issuance. CEE, particularly Poland, is the standout beneficiary, combining defence capex, EU fund inflows, domestic demand strength and upcoming monetary easing. Romania benefits too, but stability will determine the degree of market participation.
Poland is already the most dynamic defence investor in the EU. Its defence budget will approach 5% of GDP by 2026, the highest in NATO, after record PLN 200bn outlays in 2025, equivalent to 4.8% of GDP. Poland is also the largest beneficiary of EU support. The Polish army is set to receiving almost €45bn under SAFE, with disbursements beginning early 2026, on top of the €39bn in RRF and Cohesion funds still to be deployed by the August 2026 deadline.
These inflows reinforce an already strong domestic economic cycle: real wages are rising sharply, keeping consumption robust. At the same time, low inflation means the market sees the National Bank of Poland cutting its policy rate by 75bps over 2026, which may revive credit after several stagnant years. Romania is also increasing defence investment but needs to prioritise its significant fiscal reform programme, in our view. The deficit is projected to narrow from -7.1% in 2024 to -4.8% in 2025, but political resistance from unions and pension groups risks diluting the ambitious consolidation. Progress on fiscal alignment is needed to unlock the next EUR 3-4bn RRF tranche by early 2026.
The return of the Monroe Doctrine: Venezuela
The US is imposing significant pressure on the Venezuelan regime of Nicholas Maduro. In late 2025, the US military hit 21 Venezuelan vessels in international waters that were suspected of trafficking drugs, resulting in at least 83 deaths. This came alongside a significant military buildup in the Caribbean involving c. 15k personnel and key assets like the USS Gerald R. Ford carrier strike group. Diplomatic pressure escalated with the designation of the "Cartel de los Soles," allegedly led by Maduro, as a Foreign Terrorist Organization, the doubling of a reward for Maduro's arrest, and the end of diplomatic talks. The "terrorist" designation leaves Maduro vulnerable to U.S. intelligence and military action. The regime's long-standing accusations of U.S. imperialism are now underpinned by concrete actions targeting its alleged deep connections to Latin American drug cartels.
Notably, explicit support for the Maduro regime from other Latin American countries has been minimal, save for Colombia's Gustavo Petro—a sign of geopolitical pragmatism. Security is a primary voter concern across the region, making association with a designated narco-terrorist state politically unviable. The Trump administration's posture signals a return of the Monroe Doctrine: aligned leaders, like Argentina's, receive support, while foes face hard persecution. Leaders and voters better take note of the changing times.
5 | Global economic growth vs. Inflation: Where consensus can be wrong
Fig. 10 shows the consensus expectations of the sell-side economists we follow across the major economies in both EM and DM. Growth is expected to stabilise across DM and EMs. EM GDP is likely to decline at the margin due to China, where the median forecast has GDP growth falling from 4.8% in 2025 to 4.3% in 2026. EM ex-China is expected to inch up, although India – the largest country in EM-ex China – is expected to flatline at 6.7%. DM growth is expected to tick down, with Japan and the US the main culprits of softness.
Fig 10: GDP growth and CPI inflation in 2024 and forecasts for 2025, 2026, and 2027
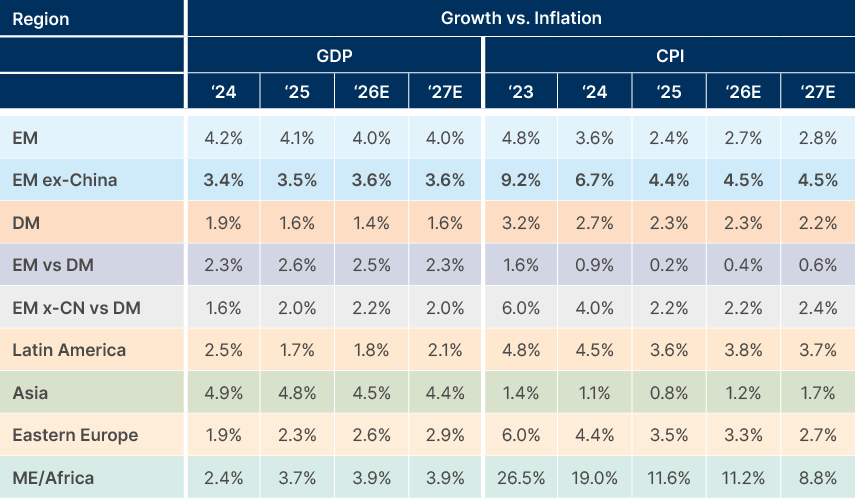
Versus consensus, we think that risk is skewed to the upside for each of these large countries, given our view that global interest rates continue to fall next year, and the passing of tariff-related uncertainty releasing pent-up demand for capex:
- In China, further export expansion amid cooling trade tensions can be the key driver of an upside growth surprise, in our view. Domestic consumption will likely remain soft, given low consumer confidence. However, accommodative monetary policy and the likelihood of further fiscal measures to support demand should keep consumption somewhat supported.
- In EM ex-China, growth upside could come from a cyclical recovery in India, founded in lower interest rates and a re-acceleration in infrastructure investment, with banking sector liquidity now in much better shape, having been negative in early 2025. Indonesia is also enacting pro-growth policies. If it manages to regain credibility that more social security can be provided and state-owned enterprise (SOE) capex can increase without an increase in the fiscal deficits, private sector sentiment can improve.
- In Latin America, the economic transition from the left to the right will bring liberal economic policies, possibly leading to an improvement in moribund investment sentiment. Mexico can regain its mojo post-USMCA review, which is likely to be approved by next summer. Brazil will be once again supported by fiscal policy with a large income tax cut counterbalancing tight liquidity conditions from elevated interest rates. Policy seems to be working as inflation expectations are declining.
- South Africa may see its economy supported by higher mining prices, lower electricity and logistics bottlenecks, and better fiscal management that has put the country on a path to regain investment grade within a few years. The lowering of the inflation target can support real economic growth via lower interest rates. Other African economies, including Nigeria, Ghana, and Zambia will continue to benefit from better macro stability, presenting upside potential to growth across the continent. Senegal and Kenya are likely to stabilise their debt burdens, as well, supported by the IMF and reformist governments.
- In the US, the continuation of the AI capex cycle can keep growth buoyant. But if AI keeps driving a softer labour market, the Fed will eventually lower interest rates by more than priced, which is likely to support a broadening of growth across the economy led by a cyclical recovery in downtrodden manufacturing sectors, as well as the housing market. The election of Sanae Takaichi as Japan’s new PM makes it unlikely that growth will decelerate in 2026 given her expansive, pro-growth policy stance.
Of course, risks to consensus are always two-sided. But macro uncertainty is less elevated than it was last year, in our view, where there was a larger tail risk of a tariff-driven global recession. Geopolitical risks are also subsidising, lowering the upside risks to inflation. The key risk to global markets in 2026 is an early end to the cutting cycle in the US if inflation accelerates, driving rates wider and the Dollar higher.. This would lead to a tightening of global financial conditions, with rate-cutting cycles in other countries also stalling, and credit spreads widening.
However, we see this scenario as unlikely, given our view that AI will be disinflationary, particularly in the US, via the jobs market. China continuing to expand its trade balance with the world ex-US will be another important deflationary impulse, particularly in Asia, which should ensure monetary policy remains accommodative. The combination of these two macro factors leaves room for inflation to surprise to the downside relative to consensus estimations for 2026 in the US and EM-ex China. Lower rates, and less policy uncertainty stemming from the US, may be key factors in driving an improvement in business conditions worldwide.
6 | 2026 Outlook for EM equities
Last year’s Outlook highlighted that the valuation disparity between US and EM equities (EME) had reached record highs and pointed out the high probability of a return towards the mean. The thesis rested on a rebound on the earnings per share of EME, driven by Asian technology and China. This played out this year, as EM equities posted a strong outperformance over both S&P 500 and DM stocks more broadly (MSCI World). Despite the EM outperformance, the valuation gap remains wide. The S&P 500 forward price-to-earnings (P/E) valuation is currently at c. 22.4x, roughly the same as last year. Meanwhile, MSCI EM’s valuation by the same metric has risen from 11.8x to 13.3x today. The earnings yield implied by these valuations is 4.5% in the US and 7.5% in EM, with the first trading two standard deviations expensive to 10-year US Treasuries, and the latter trading nearly 3% above the weighted average EM 10-year local currency bond in EM. In other words, US equities remain expensive, both against US fixed income and EM equities.
Fig 11: P/E; earnings yield (EY) and EY – 10yr govt: S&P; DM ex-US; MSCI EM; and largest MSCI EM countries
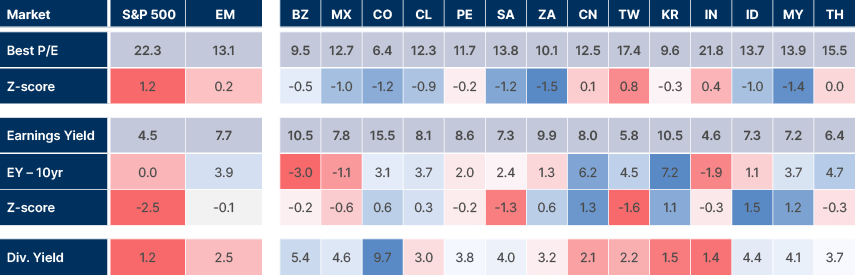
This mild convergence in valuation explains about half of the outperformance of EM stocks year-to-date (YTD). Currency has also played an important role, with MSCI EM currencies up 6% vs the DXY YTD. The rest comes from stronger earnings. MSCI EM has seen 13.5% growth in earnings-per-share (EPS) YTD, vs 11% in US stocks. But a bigger factor than strong trailing earnings growth is accelerating EPS growth expectations, which have kept forward-looking valuations attractive. Bloomberg consensus estimates now indicate 18% earnings growth in EM over the next 12 months.
Much of this growth is expected to come from some of the largest companies in the index, such as TSMC and SK HYNIX. These are two of the biggest and best semiconductor manufacturers in the world. A slowdown in AI capex would put these lofty earnings at risk. But earnings growth drivers across the EM index are diverse. If EM stocks can meet these earnings expectations, or even get close, they are likely to attract further capital flows which will support valuations further, particularly in smaller EM markets. The prospect of near 20% earnings growth in EM next year, along with the potential for further re-rating higher, should be front-of-mind for any global asset allocators still holding underweights in EM equities.
a. The Asian tech cycle
Asian equity markets this year have been generally positive, and the outlook remains bullish. The top performer, by far, has been Korea. After trading in the doldrums since 2022, Korea has been on fire this year, driven primarily by rapid earnings expansion from Samsung and SK Hynix, as demand and prices for memory chips has surged. The rally can be sustained, in our view. Valuations remain very cheap, with the MSCI Korea trading at just 10x earnings. Given multi-year global AI capex plans, it is likely that high demand for advanced DRAM, HBM and NAND memory chips will be sustained, and likely be less volatile than in previous cycles. Supply of these chips is also likely to remain constrained – with buildout of extra capacity taking years, not months – and companies holding very conservative capex guidance despite all the enthusiasm in the US. Moreover, the value-up initiative is starting to bear fruit. The equity market should trade at higher levels of valuations if companies deliver best practices that support minority shareholders.
Taiwan is benefitting from the same AI capex tailwinds, with another strong year for the index taking three-year cumulative returns to close to 100%. TSMC remains the sole company in the world capable of manufacturing the most advanced semiconductors, and its moat looks highly secure for now.
China has also seen some rerating in its tech sector, as global investors have come to realise that the ‘Red Dragon’ is not as far behind in the global AI race as many initially thought. The release of cutting-edge DeepSeek and dozens of similar models – put together entirely by Chinese developers who were educated in China – put paid to this notion. . Most of the recent LLM releases in China are open source, allowing adopters to customise the models to their needs. Importantly, instead of pursuing ubiquitous AGI, China is focusing on using AI to boost manufacturing processes and service sector productivity. Loose monetary and fiscal policy in China are keeping liquidity ample, with flows into the stock market boosting valuations this year and driving strong performance. Lowering tariff risk can be a catalyst for further Chinese equity appreciation next year, even as the traditional economy stays soft.
Indian equities have lagged this year and remain more closely correlated to the domestic economy than Chinese, Taiwanese or Korean stocks, which are currently more levered to technology cycles. After a cyclical slowdown in 2025, macroeconomic indicators in India are looking increasingly positive with credit demand improving, investment rising again and rates likely to fall further next year with inflation contained. The country may still face temporary headwinds, driven by large managers cutting their underweight in China, funded by India. But we are close to the point, in terms of valuations, that Indian markets become attractive as well and regains our preference in the largest EM equity markets.
Indonesian equities rebounded recently supported by strong domestic demand and ongoing investment linked to downstream metals. Malaysia’s economy is being lifted by the datacentre and semiconductor-adjacent capex cycle, which is boosting growth and stabilising the Ringgit despite softer China-linked trade. Thailand, by contrast, is still struggling to regain momentum, with tourism softer than expected and political uncertainty weighing on investment.
b. Latin America: from underdog to top dog
On a country level, some of the strongest rallies this year have demonstrated a point we make to investors consistently: that for EM markets which are cheap, prices can be sensitive to even small re-allocation decisions from global or even domestic investors. This has been the case in three of the top performers in EM this year: Colombia, Chile and Peru – up 108%, 58% and 51%, respectively in total return terms. At least half of the rally in each case has been due to the indices rerating from low levels. The rest of the rally has been made up of upwards revisions to earnings forecasts and strong FX gains. Mexico and Brazil, which make up the larger part of the MSCI LatAm index market cap, have also both had very good years for equity returns, up 49% and 48%, respectively. Both have seen some rerating and positive currency effects. Argentina has had a down year, but with President Javier Milei having won US financial backing and a very strong mandate to continue with his reform agenda in 2026, the outlook for Argentine assets next year is currently very positive.
Even after posting very strong returns in 2025, LatAm is perhaps the region where we still see the clearest upside for equity outperformance across EM in 2026. While equity indices have rerated, they have done so from very undervalued levels and are still below historical averages in absolute and relative terms to the US. The MSCI LatAm index 12 months ago was trading around 9.5x forward earnings – today it is trading close to 10.5x. This still represents a near 50% discount to the SPX index, trading at 22x, even though earnings growth for both is expected by Bloomberg consensus to be about the same, at 11% for the next three years. This alone should have have investors’ attention. In addition to rerating momentum, the MSCI Latam currently carries a 5% dividend yield, vs just 1.2% for the S&P 500. This provides downside protection even in a de-rating scenario.
The ongoing ‘blue wave’ in politics means there is a strong chance that most major South American economies will be under market-friendly administrations by the end of 2026, as per Fig. 12. This can be the key catalyst behind a lowering of risk premiums in the region, and therefore higher equity market valuations. For Mexico, enjoying political stability under Claudia Sheinbaum, renewing the USMCA trade agreement under favourable terms will be the key catalyst to watch for.
Fig 12: Latin America 2nd wave to the right

c. CEEMEA: Hidden gems on smaller markets?
Within EMEA, we prefer South Africa over the GCC. Reforms, improving power stability and better fiscal discipline are helping underpin a gradual recovery, while higher metals prices provide a favourable terms-of-trade impulse. GCC performance remains steady, but the absence of an oil risk premium and continued IPO supply in Saudi Arabia limit relative equity upside.
7 | EM Debt: Investors taking notice after three consecutive years of outperformance
a. Better macro dynamics since COVID-19: higher GDP growth and lower inflation.
We’ve been highlighting, for three years now, how resilient EM economies and markets have become in an environment where the DM macro environment has been uncertain. The fact that EM countries managed to achieve higher growth and lower inflation than expected since the pandemic has continued to drive market returns, even if flows have been lagging.
b. Supportive of large number of net upgrades.
The more positive macro dynamics for EMs can be seen on a simple data point. Over the last two years, all three rating agencies have delivered upgrades to many more EM countries than downgrades, as per Fig. 13.
Fig 13: Net upgrade by rating agency

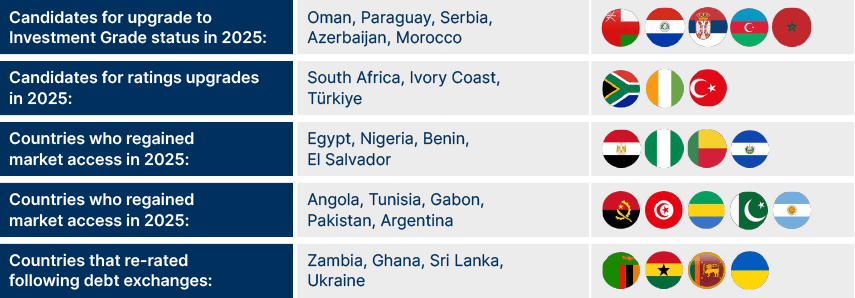
Last year, five countries gained or returned to investment grade status, close to 10 countries regained market access and at least another five countries are very close to doing so, as per Fig 14.
Fig 14: High yield: Structural reform stories driving performance
c. Technicals and flows: Investors are just starting to take notice of outperformance
Despite the better macroeconomic picture, investors have been slow to respond. In fact, foreign investors were net sellers of EM dedicated mutual funds both in 2023 and 2024, despite extraordinary performance of both EM high yield and investment grade securities. The picture only started to change this year, with USD 8.3bn of inflows (1.8% of NAV) in EM debt ex-China reported by Bank of America Merryll Lynch using EPFR Global data, following outflows of USD 30.7bn (8% NAV) for 2024 and 14.5% NAV in 2023. The small inflows in 2025 YTD compared to outflows over the last two years gives us confidence we are early in the stage of a long-term investment rebalancing to EM. Anecdotally, long-term real money asset managers have been reporting an increased number of requests for proposals (RFPs) for EM investment vehicles, a trend corroborated by large pension funds and consultants.
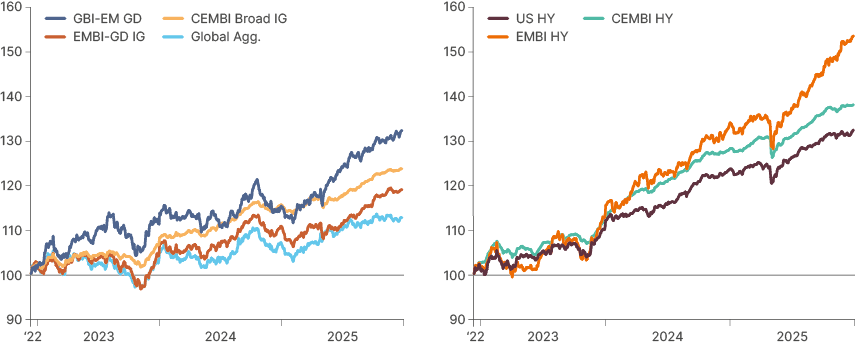
The light outflows contrast with the strong performance of EM assets over the last three years, when EM local currency (EM LC) outperformed the Global Aggregate by more than 20%, and EM corporate and sovereign high yield outperformed the US by 10% and over 20% respectively, as per Figs. 15 and 16.
Fig 15 & 16: EM investment grade USD sovereign bonds + EM local currency sovereign bonds vs Global Aggregate and EM high yield vs US high yield
d. EM USD debt: Credit spreads are tight, but yields remain elevated
A common question from asset allocators is how tight EM credit spreads are in historical terms. It is hard to deny; credit spreads are tight. However, they are justified by the improved fundamentals described in sections 7.a to 7.c, as well as the much better technicals. The technical picture doesn’t require any images. In 2025, EM sovereign debt net issuance amounted to USD 168bn after USD 106bn in 2024, as gross issuance increased from USD177bn to USD253bn. In total, the universe of outstanding USD and EUR bonds in EM sovereign and corporates adds up to slightly less than USD 3bn. This is nearly one-tenth of outstanding US Treasury bonds. Another thing to consider is that part of the spread tightness comes from new ‘risk-premium’ in the Treasury curve which wasn’t there before. This is observable in the difference between US Treasury yields and overnight index swap (OIS) yields on Fig. 17, which are a purer reflection of interest rate expectations.
Fig 17: Yield to maturity: last, 10yr median, high and low largest asset classes

e. EM local currency: Highest real yields in 15 years plus Dollar diversification: What’s not to like?
The best performing fixed income asset class in 2025, EM local currency bonds, has more tailwinds in 2026. The US dollar selloff in H1 2025 did not gain momentum in H2 against the G7 countries, as the JPY started to depreciate again and the EUR stalled. The renewed enthusiasm for AI investing was the main factor supporting the ‘Greenback’. However, despite the ‘all-in-on-AI’ equity rally, the US stock market will likely end up underperforming most global stocks in 2025. This soft performance, and the high valuation, will drive more diversification away from the US.
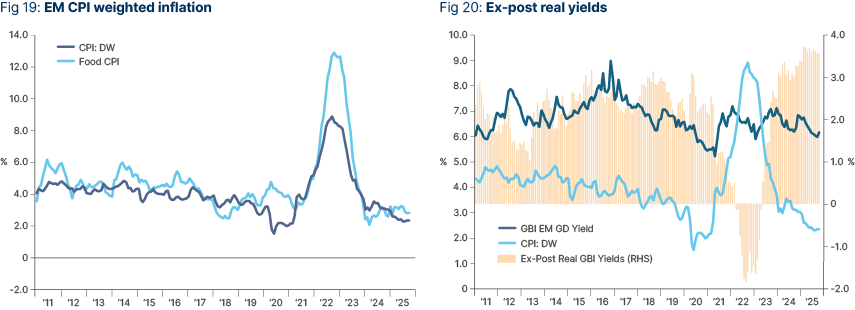
Importantly, if we are right that US interest rates have more downside than upside, not only will the Dollar drop, supporting EM currencies as per Fig. 18, but it would allow for declines in EM local rates. After a steep decline in inflation and food inflation, EM local rates offer the highest level of ex-post real interest rates in 20 years, as per Figs. 19and 20. Moreover one-year bonds are offering the highest ex-ante real rates (vs. one year ahead CPI forecast) in more than 15 years as well.
Another factor supporting the asset class is the lower volatility profile of EM LC vs. the dollar index, which is primarily driven by EURUSD and USDJPY, but also has the other major DM currencies. Lower volatility is not as unusual as investors think, being the main pattern in 13 out of the last 23 calendar years. Lower volatility and higher carry suggest investors diversifying away from the Dollar should look to local currency bonds before DM.
Fig 18: USD REER vs EMFX REER
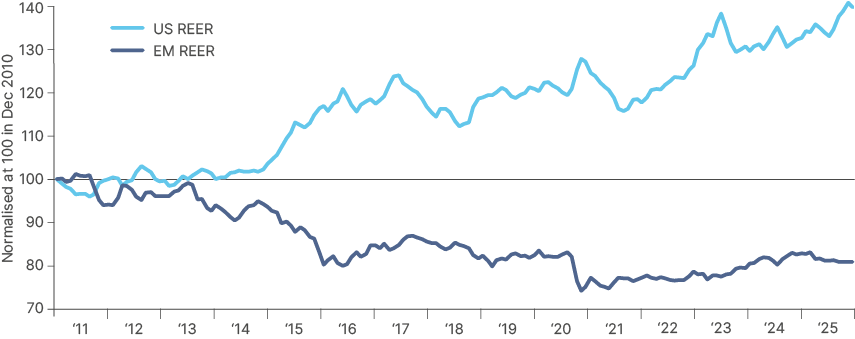
Fig 19: EM CPI weighted inflation | Fig 20: Ex-post real yields
f. Scenario analysis: How would EM debt behave in different scenarios?
As usual, we wrap up the fixed income outlook with a total return scenario analysis. The starting point is three scenarios for the US curve in different economic environments. The spread forecasts simply follow the historical relationship at different scenarios. This year, the stress test includes some spread widening in case US Treasury yields increase in a no-landing scenario in Fig 21.
This goes against the historical relationship as usually when US Treasury yields are rising, credit spreads tighten, but it makes sense in the context of record low credit spreads and the market pricing at least another three Fed Fund (FF) rate cuts. The total return scenario also includes estimated default levels – the highest over the last 10 years during a recession, average default under a soft landing and the lowest default levels under no landing, where the economy and inflation are more supported than expected, leading to only one more cut by the Fed.
Notably, local currency offers the highest upside for a moderate downside in a no-landing scenario and remains our preferred asset class, in terms of asset allocation, across EM debt. It strikes us that investment grade returns are very similar to HY in positive scenarios (soft and no landing) and much above high yield in a negative hard landing scenario.
Fig 21: Scenario analysis
- Soft landing: FF rate at 3.0% and 10-yr at 3.875%
- No landing: FF rate at 3.75% and 10-yr at 4.50%
- Hard landing: FF rate at 1.0% and 10-yr at 3.00%
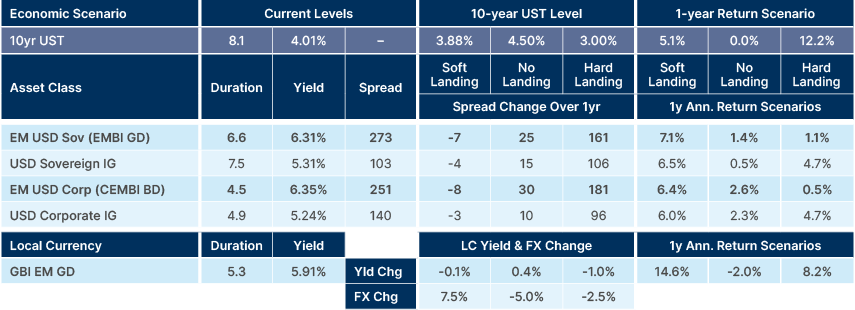
*Default Assumptions: Base Case = Average of 10yrs Bear case: Worst 10yr Bull case = Best 10yr (Rolling 5yr defaults).
**Spreads: Widen to 100bps below Covid-19 levels on hard landing. Tighten more on a soft landing than no-landing.
8 | China outlook
China’s last Five Year Plan revolved around boosting high-end manufacturing capability. The motivation for this was two-fold, exporting higher margin products to fuel growth and reducing reliance on US technology. This shift in policy led banks to redirect loans away from the booming real estate market (and the consumer) towards the high-tech industrial complex.
From an international competition perspective, China’s shift to high-end manufacturing has been successful and despite tariffs, export growth has remained robust. Exports to the US declined but rose at a faster pace into EM and Europe. However, the ongoing export-led growth is yet to lead to higher industrial profits on aggregate, and therefore yet to benefit most of the population. Alongside the real estate crash and tightening of fiscal policies in local governments, this has led to a weakening of aggregate demand and a rise in household savings rates. Concurrently, cheap money for manufacturing has led to new oversupply problems, with aggressive competition driving deep deflation in producer prices. This has led to declining industrial profits and declining broad corporate profits for most of 2025.
Fig 22: China vs PPI vs Corporate profit growth

a. The next five years
China’s challenge is now to boost productivity and margins by ongoing development of its ‘Nex Gen’ industrial export base while also beginning to address structural imbalances in the economy, namely by raising household consumption as a percentage of GDP to allow for an expansion of the services sector and reduce reliance on foreign demand for growth. The readout from the Fourth Plenum on the next Five-Year Plan (2025-2030) indicates both agendas are now priorities. China’s Communist Party is acutely aware that the forecasted increase in its population’s age dependency ratio from 2030 will require higher social spending. The only sustainable way to fund this is by increasing the tax base from low levels, which can only be done by raising productivity and wages but also reducing household savings rates.
b. Can China exit deflation?
For China to reap the rewards from leapfrogging the West, its economy must exit deflation and industrial profit must rise. This can happen in a few ways – more productivity, more demand for China’s high-end products (either foreign or domestic) or less intense domestic competition. The most likely path is a combination of all three.
c. Productivity
Aggregate productivity has risen above trend over the past four years. Continued investment in robotics and AI is likely to accelerate these dynamics. China has most of the ingredients for winning the global AI race: best in class engineers, a chokehold on strategic metals that guarantee the supply of advanced chips, cheap capital, and low industrial electricity costs in key provinces create a tailwind for automation-heavy investment. If China can continue to monetise on these advantages, it will translate into growing profitability for its companies, which will drive an increase in allocations to its equity market.
d. External demand
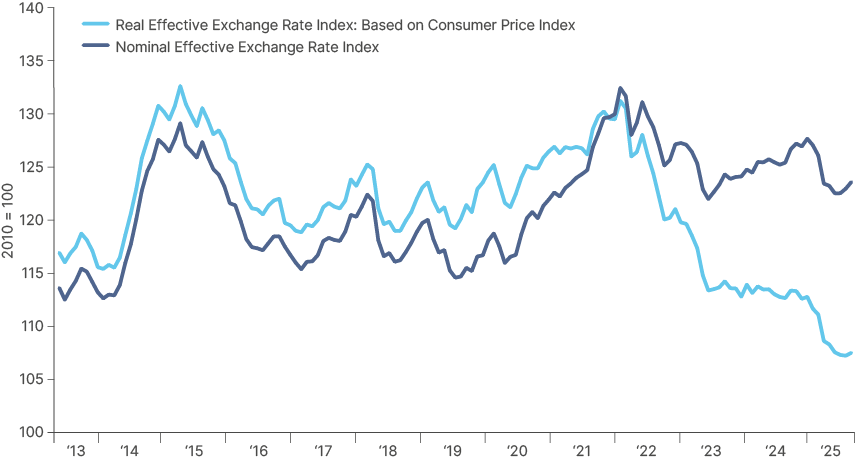
Despite US tariffs and rising trade barriers from Europe, Chinese export growth has accelerated this year driven by an increase in exports to EM. This trend shows no sign of slowing down next year and a truce in the US trade war engineered via China’s near monopoly over crucial rare earth minerals reduces risks to external demand in 2026. Furthermore, the Renminbi is currently at its weakest level in more than 10 years, in real effective exchange rate (REER) terms, and will continue to support Chinese export orders.
Fig 23: Chinese Nominal Effective Exchange Rate vs Real Effective Exchange Rate
e. Domestic demand
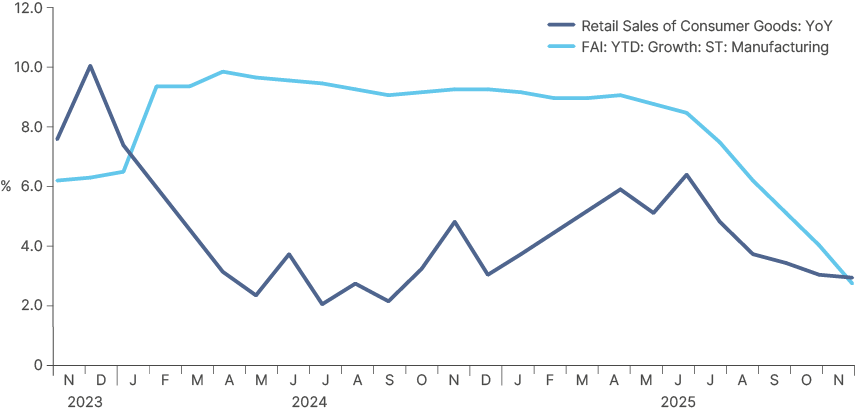
Subsidies for consumer goods trade in China this year were initially successful in stabilising consumption, but more recently retail sales growth has slowed to c. 3%. In July, authorities rolled out the first cash handout policy to support households in the form of a childbirth subsidy. A stronger social safety net will ultimately be the change required to structurally lower savings rates, but Chinese authorities have reiterated that funding a Western style social safety net is not sustainable without a broader, more robust tax revenue base.
Fig 24: Chinese retail sales vs manufacturing investment growth
f. Supply
Fixed asset manufacturing investment is declining sharply from very elevated levels in 2024. This reflects both the deflationary environment China is currently in and the centrally planned ‘Anti-Involution’ policies taking effect. The anti-involution campaign constitutes a mixture of policies – including supply controls and bans on selling product at below cost – designed to tackle overproduction and excessive competition. This has already led to a pick-up in producer price index (PPI) inflation since the summer, primarily in upstream sectors, with longer-term Chinese bond yields rising in step. However, exiting deflationary dynamics sustainably, particularly further downstream, will likely be a multi-year process requiring a mixture of tighter supply and stronger demand. Move too fast on cutting supply and the negative effects on growth and the jobs market may outweigh the positive effects on profitability.
g. Investment implications
A successful exit from deflation and a shift toward economic rebalancing would be positive for Chinese equities. However, we see this as a multi-year process, rather than a tradeable theme. However, the last two years have shown that Chinese equities can perform well even in a softening economy. Chinese stocks have largely decoupled from the broad economy in 2025 because index earnings are driven mostly by the tech cycle, not the industrial cycle. While traditional industry is the largest sector in the economy, accounting for roughly 30% of China’s GDP, technology and internet sectors represent close to 60% of MSCI China’s market cap. This mismatch explains why equities have rallied despite weak property activity and soft consumption. Even as aggregate capex remains subdued in a deflationary environment, AI investment is accelerating. Alibaba, for example, plans to deploy USD 50bn into AI over three years, intending to shift earnings contribution away from a flattening e-commerce business toward cloud and AI services, where its scale is meaningful, but monetisation still lags western peers. This AI build-out, if sustained across the broader platform-economy, can continue to support Chinese tech earnings into 2026.
Policy support also remains an important pillar. Authorities have made clear they want equity markets to function as a credible long-term wealth store. The People’s Bank of China has implemented targeted liquidity measures, including last year’s RMB 300bn relending programme to support corporate share buybacks. These efforts are drawing households into equities from very low allocation levels. If domestic participation structurally rises, this can provide a durable tailwind for Chinese equity valuations regardless of short-term macro noise.
9 | Political Calendar
Emerging & Frontier Markets
Uganda: General election (15 January)
Yoweri Museveni is seeking yet another term after constitutional changes removed age and term limits. Opposition figure Bobi Wine retains strong urban support, but security-state pressure is intense. Museveni’s re-election could mark the beginning of a hereditary-style succession as rumours persist around Museveni’s son, Muhoozi. Will political repression affect investment sentiment? The odds of a political change are low with the electoral environment heavily favouring the incumbent.
Benin: Parliament (11 January) and Presidential (12 April)
President Patrice Talon consolidated power through electoral law changes and control over the judiciary. But opposition parties regained some ground in 2023 after boycotts and bans in earlier cycles. Talon’s policies have been market friendly, minimising the fallout of any perceived political risk, but the country’s reputation as a regional democracy may erode further. The odds of a change in president are low as Talon remains dominant unless internal elite fractures emerge.
Vietnam: Legislative (15 March)
Vietnam is ruled by a one-party system, but politics are more fluid than the façade suggests: major anti-corruption purges and elite reshuffles have destabilised the senior leadership in recent years. Market participants will monitor who emerges from the ongoing power struggle between security services, technocrats and party traditionalists, with important implications for foreign investment, especially US and China alignment. We rate the odds of a change as low, albeit the cabinet may change post elections. The To Lam government is continuing to make significant strides to boost the Vietnamese economy from policy reforms, legal changes, stimulus plans and international collaboration. These significant changes are being coined ‘Doi Moi 2.0’ and are very broadly captured in ‘four pillars’.
- 1/ Science, Tech & Innovation (Resolution 57) – promotion of these as fourth Industrial Revolution (digital transformation) takes hold. Boost R&D spending, attract foreign experts to grow tech exports and create five world-class tech firms by 2030.
- 2/ International Integration (Res. 59) – strategic objective as global powers compete and move to multipolarity and multicentre development. Anchor firms in highest value-add tiers of global supply chains and working to attract more capital and international financial firms into Vietnam’s markets.
- 3/ Law-Making & Enforcement (Res. 66) – complete a transparent, modern legal framework for human/citizen’s rights as foundation for modern, innovative market economy. Includes removing all contradictory / overlapping rules by end 2025.
- 4/ Private Sector Development (Res. 68) – make the private sector the most important driving force of market economy (within Vietnam’s socialist-oriented market economy) allowing people and businesses to operate freely in all sectors. Elevate entrepreneurship as pillar of national identity with explicit mandate to drive more private sector growth. The government wants to cultivate 20 ‘national champions’ as well as double the number of SMEs to 2 million by 2030 – including bringing informal household businesses into registered SMEs and into the tax system.
Colombia: Parliament (8 March) & President (31 May)
Presidents are term limited. Gustavo Petro’s coalition has split, and his approval ratings are weak. The centre-right is coalescing around figures such as Federico Gutiérrez (FICO); centrist candidates like Sergio Fajardo are also positioning for a runoff. At stake is the future of Petro’s social- and labour-reform agenda; oil-sector policy; security strategy amid rising violence. The odds of a political transition are very high as current sentiment points toward a return to the country’s usual centre- or far-right political dominance.
Bangladesh: General election (April 2026, tbc)
The January 2024 election, boycotted by the BNP and widely criticised as uncompetitive, did little to ease pressure on an economy facing slower growth, high inflation and tight reserves under the IMF programme. Public frustration culminated in the student-led uprising of August 2024, which forced Sheikh Hasina to resign and flee to India. She has since been tried in absentia and handed a death sentence alongside additional corruption convictions.
Student leaders proposed Muhammad Yunus to lead an interim administration, and he was appointed Chief Adviser with a mandate to stabilise the economy, advance IMF-linked reforms and prepare new elections by early 2026. The government presents itself as reformist and has pushed ahead on governance, revenue and FX reforms, but external buffers remain thin. The political question has therefore shifted: rather than debating whether the opposition will contest a controlled election under the Awami League, the focus is now on whether the Yunus-led interim government can convert its reformist agenda and broad public support into a more competitive democratic process while maintaining stability — especially after it moved to ban the Awami League in 2025.
Hungary: Parliamentary election (12 April)
Viktor Orbán’s Fidesz Party remains structurally advantaged, but opposition cooperation is improving after a poor 2022 cycle. Inflation fatigue and EU funding disputes have dented Fidesz support. At stake are the rule-of-law disputes with the EU, economic stabilisation, and whether Orbán’s ‘illiberal’ dominance softens. We rate the odds of a change as unlikely, despite the most competitive environment in a decade.
Peru: General election (12 April)
Peru has cycled through six presidents in six years; Congress remains deeply unpopular. The interim government is weak and technocratic. The race is very fragmented with outsider candidates polling well, a pattern consistent since 2016. Despite the country’s political instability, economic policies have remained orthodox. A market-friendly government can support mining regulation, while the risk of constitutional changes and another highly fragmented Congress remains.
Algeria: Parliamentary election (June)
Power remains centred on the presidency, military and security services, while parliament plays a limited but symbolic role. The government faces rising domestic spending pressures amid slow diversification from oil and gas. Key to monitor is whether the political apparatus allows for marginal opening to younger or reform-minded candidates. We are not holding our breath.
Morocco: General election (September)
The National Rally of Independents (NRI) leads the government, but opposition parties have regained momentum amid dissatisfaction with inflation and unemployment. The monarchy retains the key authority and has been the flagbearer of market-friendly economic policies, but parliamentary composition drives policy priorities. At stake is the pace of economic reform, including social protection and subsidy restructuring, diplomacy, and investment frameworks. While opposition gains are plausible, we believe system continuity is assured.
Israel: Legislative election (October at the latest, likely earlier)
Prime Minister Benjamin Netanyahu’s coalition faces sustained public dissatisfaction over conflict management, security lapses and judicial reform attempts. Centrist and centre-right alternatives — notably the Gantz/Lapid blocs — poll strongly. Polling consistently shows the current coalition losing its majority. At stake is the post-war security architecture, judicial overhaul, ultra-orthodox exemptions, and regional diplomacy.
Brazil: General election (4 October and 27 October run-off)
President Luiz Inácio Lula da Silva (Lula), in office since 2023, is eligible for re-election and is widely expected to seek a second consecutive and fourth non-consecutive term. The opposition remains anchored in Bolsonarismo even though former-president Jair Bolsonaro himself is barred from running. Several governors and ex-ministers are potential standard-bearers, but there is a risk that a family member is appointed to run, splitting the race. Front runner is Tarcisio de Freitas, a market-friendly ex-minister and governor of São Paulo.
The new government will have to overhaul the fiscal framework and primary balance path to support the central bank in the fight against inflation and rebalance economic policy to a more sustainable path. Tarcisio is a champion of privatisation and infrastructure investment, exactly what the country needs to support its long-term economic growth. On the other hand, Lula will seek a renewed mandate to deepen his social-spending agenda and maintain his moribund party in power. Incumbency and Lula’s personal brand are strong, but polarisation, economic performance in 2026 and the opposition’s ability to unite behind a single candidate will determine whether Lula retains the presidency.
Key developed Markets (DM)
Portugal: Presidential election (18 January)
President Marcelo Rebelo de Sousa is term-limited, so the race is open. The field includes Admiral Henrique Gouveia e Melo (former vaccine-rollout chief, broadly popular) and several candidates from the fragmented left. The far-right Chega Party is polling strongly nationwide and could push its own candidate into a competitive second round. The traditionally moderate presidency may become more assertive if Chega performs strongly. Gouveia e Melo currently looks like the consensus front-runner, which would not bring an ideological shock.
Sweden: General election (13 September)
The right-leaning government of Ulf Kristersson depends on the Sweden Democrats (SD). However, the SD has consistently led the polls and could form a left-of-centre government with the Centre and Green parties. The odds of a change are high and migration regime, and energy policy (nuclear restart) are the main policy changes.
New Zealand: General election (est. October)
The National–ACT coalition governs with support from NZ First. Polls have been tightening as the cost of living, health-system strain and crime dominate public debate. Labour is rebuilding after its 2023 collapse but still trails. The main policy differences rests on fiscal tightening vs social spending; climate policy pace; foreign-policy positioning amid US–China competition in the Pacific. There is a moderate chance of change with a likely shift in coalition configuration, rather than a full reversal.
United States: Midterms, 3 November (full House, one-third Senate, governors)
The US mid-term elections in October 2026 will see every seat in the House of Representatives (lower house of Congress) contested, as well as one-third of the Senate. The Republicans currently hold narrow majorities in both the House and the Senate, giving them a strong mandate to enact policies. This could all change in 2026, however, with a strong possibility of both the House and the Senate flipping to the Democrats.
US presidents almost always become less popular in the year following their election. But Trump’s net approval rating, after one year in office, is the worst out of the last four presidencies, including his own first term. Trump has made good on many of his campaign promises, including reducing net migration and using tariffs to raise tax revenues and win concessions and investment from other countries. However, he has so far failed to bring down the cost of living, the factor that matters most to American voters, according to the polls. The pressure is now intensified on Trump’s administration to win back the median voter – or lose the Congress.
Losing the Congress would make it more difficult for Republicans to enact policy changes in the second half of Trump’s mandate, especially considering the ideological divide across both major parties. However, under Biden and not Trump, more governing was done via Executive Order than many thought possible. The Supreme Court is now largely Republican as well. Also, the most significant policy, the OBBBA, has been passed. Many policies in the bill, such as permanent tax cuts and subsidies for R&D and capex are unlikely to be unwound.
What may be contested by Democrats are spending cuts, particularly to Medicaid and Medicare, which brings the risk of derailing fiscal consolidation efforts in 2027 and 2028. What is more relevant for 2026, however, is how US policy might shift as Trump tries to regain popularity.
Following Zohran Mamdani’s victory in the New York City Mayoral election, Trump is likely to shift his focus away from geopolitics and trade, back towards domestic policy, increasing the chance of more populist policies to win votes. Populist fiscal expansion is perhaps the main risk to our disinflationary view of 2026. Nevertheless, large fiscal stimulus is likely to be contained as it would be inflationary and going against the reiterated promise to “end inflation and make America affordable again”. If Trump bides his time and unwinds tariffs on consumption goods, the deflationary impact from AI, and the fact that tariff-related inflation will likely be mostly behind us by April, may support his popularity as we approach October’s elections.
10 | Review of 2025 Outlook calls
Good
Tariffs and steps towards US fiscal consolidation in 2025 will likely lead to a weaker USD
Our strongest conviction view in our 2025 Outlook was out of consensus, but turned out to be correct. The DXY Index fell 10% in H1, as investors priced in the effect of tariffs on their portfolios. Falling US rates due to fiscal consolidation has kept the USD soft in the second half of the year.
Asset allocators should think about a big increase to EM assets at the peak of the trade tensions, probably around Q2 2025.
EM assets have outperformed across the board this year. Investing in EM equities and local currency bonds at the peak of the trade tensions would have been a good strategy. Unexpectedly, much of the outperformance in EM equities came in the month prior to the 2 April ‘Liberation Day,’ which was mostly down to the launch of open-source Chinese LLM DeepSeek. This led investors to re-evaluate the US hegemonic position in AI.
Trump will not levy large indiscriminate tariffs against Mexico and Canada.
Trump started trade negotiations more aggressively with Mexico and Canada than many expected, which rattled investors. However, the average tariff on Mexico and Canada has stayed low, with only non-USMCA goods falling into the tariff, and many other key areas of trade (such as energy and auto) exempt from tariffs.
The impact of tariffs will be deflationary for EM countries, particularly China.
Tariffs have been deflationary for China, with rising protectionism driving prices down and margins lower. This has had a tangible deflationary impact in the countries where more Chinese goods are being rerouted to, particularly for close neighbours such as Thailand, Malaysia, Vietnam and Korea.
Trump won the election largely due to dissatisfaction over price levels. Hence, inflation and the bond markets will act as a natural constraint to unfunded tax cuts and reckless tariffs.
After Trump’s ‘reciprocal tariff’ salvo on 2 April, a severe spike in market volatility ensued, which led to a strong sell-off in bond yields. Trump then delayed the implementation of tariffs after noticing bond markets were “yippy”. This story continued to play out in 2025, becoming known as the ‘TACO’ trade (Trump Always Chickens Out). We think this acronym is ultimately unjustified, given tariffs have been raised to levels not seen since before WWII. Still, it paid to follow the strategy this year.
Mexico trading two SD below average in P/E terms due to constitutional changes under Sheinbaum, this could prove good entry level considering Sheinbaum likely to take a market sensitive approach when effecting the changes.
Brazil, Mexico and Colombia offer very attractive earnings yields compared with elevated government bond yields, meaning equities can re-rate higher should inflation fall and central banks begin to ease.
South Africa stands out, trading 1 SD below its mean as new GNU likely to deliver better economic stability.
Korea and Malaysia trading well below average valuations offering attractive levels for investors seeking exposure to Asian high-tech manufacturing trade.
With an earnings yield at double-digit levels and healthy earnings profiles across many companies, Chinese stocks are likely to be supported even in a trade war scenario (see below) and have significantly more upside than downside as soon as the trade war is over.
Largely for the reasons we projected, all but one of our country picks, (Malaysia) outperformed the MSCI EM index this year, with China performing in line with the index.
Fig 25: EM Equities total returns quilt
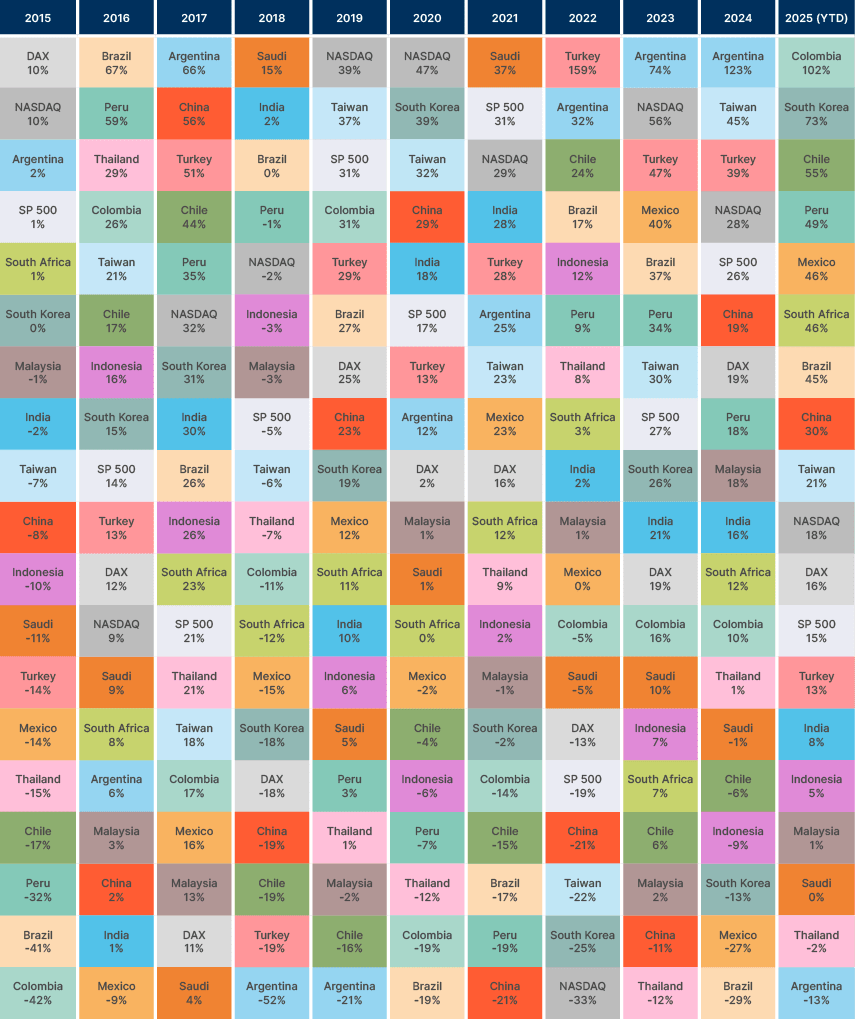
Debt
Investors should keep an overweight exposure to EM debt versus traditional benchmarks such as the Global Agg due to the all-in yield.
In 2025: EM USD debt outperformed the Global Agg by a wide margin, up 12.4% vs 7.2% for Global Agg.
There is a compelling case to be made that several countries implementing serious structural reforms, such as Argentina, Nigeria, Egypt, Ivory Coast, Türkiye, Pakistan, and several others, will keep receiving upgrades from credit agencies. On the other hand, countries with poor fundamentals, like Romania and Panama, already trade at spreads suggesting they will be downgraded to sub-investment grade.
Bad
Tariffs will start at much lower levels than feared, and increase gradually, pushing targets to come to US terms likely well before the tariffs reach the lofty heights Trump has threatened.
Tariffs were implemented at a higher level than we expected, with the US average tariff rate rising from 2% to over 15% in a matter of months. Many of the tariffs threatened on the campaign trail, including a tariff of close to 60% on China were put in place, which we did not expect. However, key sectoral carve-outs, such as on tech products and energy, helped cushion the impact on the US economy, and trade deal momentum and willingness to make further concessions in price-sensitive areas are supporting US business confidence. Overall, this is a better outcome and in line with what we expected based on our ‘constrained’ scenario.
EM equity return scenarios: Considering the price-to-earnings (P/E) ratio expands in earnings contraction and declines in expansion, we get to a return range of -12% in the bear case to +23% in the bull case. There would be scenarios where EM equities rise above the bull case (or below the bear case). For example, assuming the bull case EPS and 12.5x P/E would lead to total returns of 40%.”
While we noted the possibility of returns higher than our ‘bull case,’ our assertion that price-to-earnings ratio would decline as earnings expanded was incorrect this year. Valuations did rise with earnings expansions, driven by the return of capital flows into EM stock markets.
A structural overweight to HY versus IG based on pure beta is no longer justified, in our view. Instead, investors should focus on individual credit selection which will play a key role in alpha generation within 2025.
Partially correct. In corporate debt, IG and HY delivered the same performance YTD, at 8% (to 22 November). However, in the sovereign debt space, HY rose 16%, outperforming IG, which rallied 9%. This was mostly driven by the defaulted bonds and countries in debt distress, including Venezuela and Lebanon.
Summary and Conclusion
Three key macro themes will shape the narrative in 2026, in our view. The first is the sequencing of AI’s impact on the global economy, where we still expect a period of disinflation before any inflationary effects emerge as productivity gains filter through. The second is China’s ongoing role in exporting disinflation, which should help anchor global price dynamics. The third is the growing recognition that the debasement narrative does not match the reality in most DM and EM countries, where real interest rates remain elevated amidst efforts to rebalance fiscal positions. Taken together, these dynamics suggest financial conditions can improve further in 2026, with a softer USD as the Fed cuts giving more room for global central banks to lower policy rates.
Against this backdrop, we expect EM equities and fixed income to keep outperforming, supported by resilient growth, attractive local valuations, and favourable technicals. We see the potential for EM valuation expansion to continue in 2026 via accelerating inflows as investors try to play catch up from their current position: underweight and behind the curve.