
Frontier markets
An established case and emerging trends for Frontier Markets equity investing
The terminology ‘Frontier Markets’ inspires images of exotic geographies, colourful politics and investor adventurism. Yet the investment outcome for a globally diversified and liquidity focused FM portfolio is much more predictable and reliable; underpinned by over two decades of proof statement.
If the idea of investing in markets that have historically produced strong long-term US dollar returns (higher than Emerging Markets) with lower correlation to global markets and less volatility sounds attractive, then read on.
This strategy overview starts by summarising the well-founded advantages of investing in Frontier Markets and small Emerging Markets (abbreviated here and typically also in the industry simply as ‘Frontier Markets’), before turning to more recent drivers that are set to continue to transform the investment opportunity.
The proof statement for Frontier Markets investing
The long established investment case for Frontier Markets (FM) can be framed around four interrelated structural drivers:
1 | An incubator for future Emerging Markets
FM is a diverse and global universe that is undergoing periods of structural change and economic reform. In short, it comprises Frontier Asia and Europe, the Middle East, Andean countries and Africa. Each country has their own balance of domestic growth drivers and are each at their own stage of development. In common is their often-earlier stage of development than core Emerging Markets (EM) and their typically overlooked nature. Consequently, one way of considering FM in a global allocation is a ‘portfolio that considers all the markets you do not already own’ or the ‘next wave of EM’.
PROOF STATEMENT
The last decade has seen several FM reclassified to EM reflecting their success implementing reform, institutionalising their capital markets and meeting international regulatory standards. For example, the UAE, Qatar, Pakistan and Kuwait, with potentially Iceland and Vietnam next to follow suit.
2 | Strong historic US dollar returns
FM companies have generated sustainably high return on equity, above that of EM, given the underpenetrated nature of sectors of their economy as well as their often-oligopolistic position in the local market. This structurally high ROE, above and beyond that of the cost of capital, has historically produced strong stock US dollar market returns.
PROOF STATEMENT
The most indicative case study is to reference the early stage normalisation of EM when the MSCI EM returned 15% p.a (defined as the first two decades of the MSCI EM index) almost twice the return of the MSCI World).1
3 | Ample alpha generation opportunity
FM are dynamic, little covered and inefficient. Local retail investors, who can often have home bias and do not benefit from global perspective, dominate market-trading flows. Local investors do not necessarily appreciate potential longevity of structural change and consequently do not price these or other factors like liquidity and governance correctly. This means markets can be overly focused on the short term, for example the latest reported earnings, and under-appreciate longer-term structural value.
4 | Strong diversification benefits
FM growth drivers are primarily domestic in orientation which leads to low intra-market correlations. FM can also be less entwined in global capital flows and less distorted by passive trackers compared to EM. Hence, they tend to experience lower correlation with global markets.
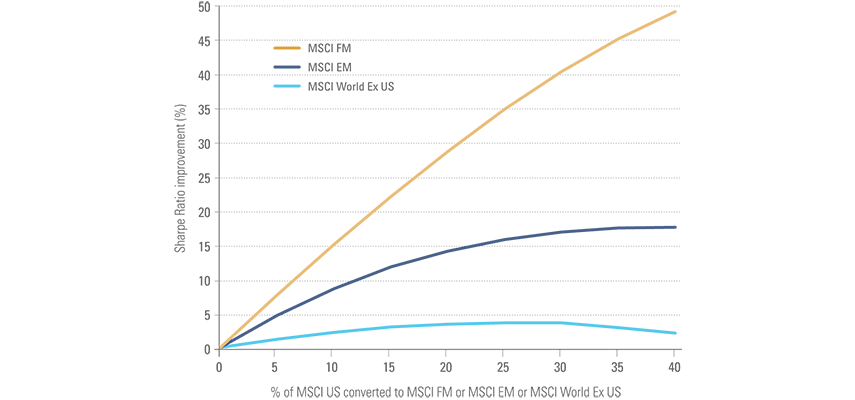
FM have exhibited high single country volatility, yet, a virtue of their low cross-country correlations means that a globally diversified FM portfolio actually exhibits lower volatility than EM. Consequently, FM is an effective, and liquid, diversification tool in global portfolios.
Fig 1: Sharpe ratio improvement by adding FM
PROOF STATEMENT
The MSCI FM index standard deviation is 22% lower compared to MSCI EM on a rolling three year basis.4 Moreover, the correlation of MSCI FM to MSCI World is 0.51 compared to 0.82 for MSCI EM.5
Alternatively, and most relevant for US focused portfolios; by diversifying 10% away from the US and adding it to FM, it has historically improved the portfolio’s Sharpe Ratio by 15%. This is almost double the effectiveness of EM and over six times the impact compared to adding other developed markets!6
Newer trends
There are a further four, more recent developments, that we believe bolster the case for investment.
1 | Enhanced investability
The liquidity and market breadth of FM continues to expand, underpinned by increased local retail participation. We have seen increased capital market activity with recent IPOs in Egypt, Morocco, Mauritius, the UAE, Kazakhstan, Vietnam and Philippines, to name a few. New issuance has been diversified across traditional industries (eg. finance, infrastructure and basic services) as well as ‘new age’ industries (eg. digital focused industries).
For example, the average daily traded volume for the Ho Chi Minh stock exchange has increased fivefold over the past five years and there are over 400 companies listed. The UAE and Qatar have recently liberalised their markets by permitting 100% foreign owned companies (compared to prior limits of 49%). We expect these trends to continue as FM governments seek to attract capital to promote economic diversification, while reform engenders greater investor confidence and participation.
2 | Enhanced sustainability
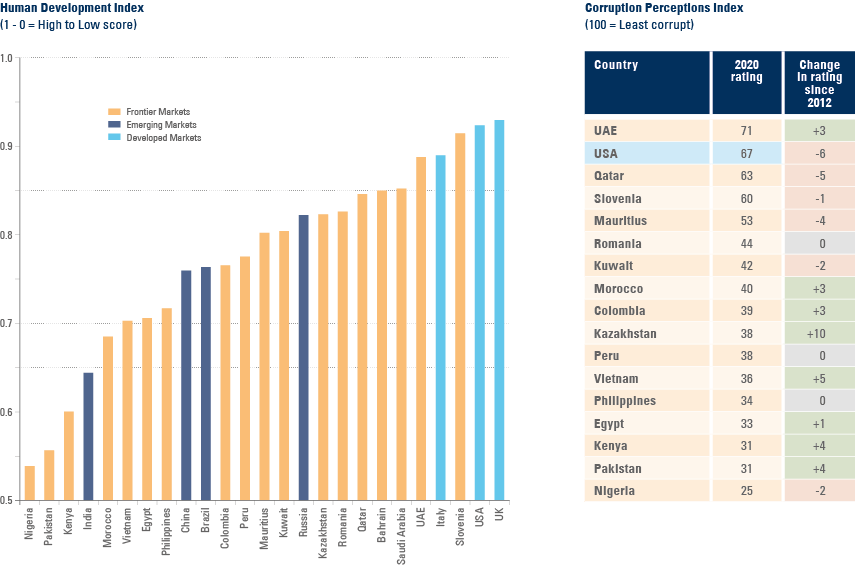
The ESG performance of FM countries varies, although in general there has been significant improvement as global standards become better recognised and implemented. FM include some of the high scoring countries on indicators such as Human Development and Corruption, often ahead of more well-known markets. It is a similar picture at a company level reflected by our average FM portfolio ESG score which is broadly comparable to our EM portfolios.
Overall, FM are in an earlier stage of responding to the ESG demands of institutions and lag in terms of their ESG disclosure. However, their willingness to improve is encouraging, which itself can be a positive market driver.
Fig 2: Human/Social Development and Government Corruption
3 | Enhanced digitalisation
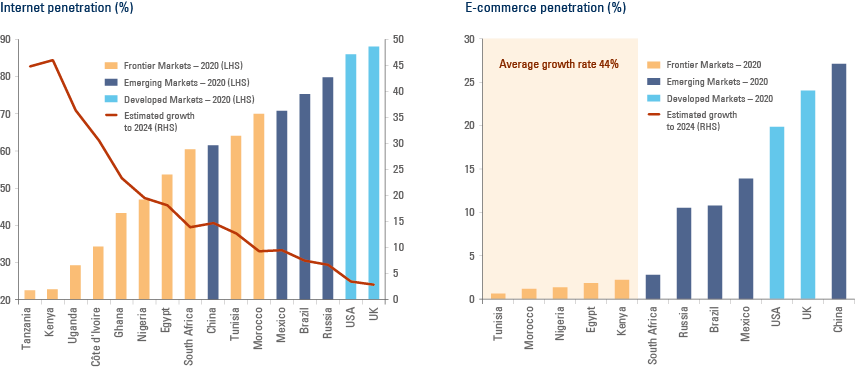
FM have embraced technology to accelerate their development and to participate in the global trend towards digitalisation. In some cases, this has included ‘leap-frogging’ the developed world. For example, there are investment opportunities in FM across payments, outsourcing, hardware and e-commerce. The structural drivers of technology can be more powerful compared to their developed peers given a combination of: their lower penetration; lower complexity; faster growth; and more domestic orientation.
They serve the locals rather than the global supply chain. The authorities also tend to actively support them, which is no longer always the case in EM and DM.
Fig 3: Human/Social Development and Government Corruption
4 | Future catalysts
FM should also benefit from a number of future catalysts.
These include:
- Increased global supply chain diversification with companies attracted to FM’s low cost skilled workforces and strategic locations.
- Increased FDI attracted to their structural growth drivers including energy and food resources.
- Increased domestic mobilisation of capital and participation in markets.
1. Source: Bloomberg, MSCI. Data has been provided from December 1987 to December 2007 for the MSCI EM. The MSCI World returned 8.4% p.a.
2. Source: Evestment. FM managers has been defined as all strategy’s in Evestment’s Frontier Markets investment universe. Alpha is measured against the MSCI FM. Data as at March 2022.
3. Source: Bloomberg. Please note FM is based on MSCI FM + Select EM. Emerging Markets is based on MSCI EM.
4. Source: Ashmore, MSCI. Data compares the average 3-year standard deviation of the MSCI FM against the MSCI EM over the past decade on a monthly basis. Data as at March 2022.
5. Source: Morningstar. Correlation is based on weekly returns over the previous 15 years. Data as at March 2022.
6. Source: Ashmore, MSCI. Calculated by reducing MSCI World allocation and adding either MSCI EM or FM or MSCI World Ex US, based on data from 31 May 2002 to 30 April 2022.