

Introduction
We went to Brazil to speak with investors, economists and market participants after the presidential elections. The mood was sombre. The largest wealth managers we met already have 40-65% of client assets offshore; medium and smaller players are around 5-25%. Importantly, all were looking to add offshore exposure because of fiscal and political risks.
The big question is how President Luiz Inácio ‘Lula’ da Silva will manage the economy in his fourth term, starting in January 2027. Most locals expect more of the same: higher spending and taxes, and primary surplus targets that are too small to stabilise debt/GDP and may not be met. Local banks expect growth to slow to c. 0.5% in 2027, from 2.3% in 2025, with inflation rising to c. 6%.
A credible four-year plan, announced at once, to take the primary surplus towards 2.5-3.5% of GDP by 2030 is the most effective way to anchor inflation expectations and the currency, and to allow lower interest rates. Without it, the BRL, local rates and equities are likely to remain under pressure, and Brazil risks missing the weak-Dollar cycle that most emerging markets are benefiting from. Lula began his first term in 2003 by raising the primary surplus target. Ending his fourth term the same way would leave a strong legacy.
A credibility problem
Brazil has many strengths. The current-account deficit of 2.3% of GDP is more than covered by USD 88bn of foreign direct investment, reserves are USD 366bn, and only 3.75% of public debt is in foreign currency. Oil output has risen from 2.9 million barrels per day (mbpd) in 2020 to a record 4.7mbpd in September 2026. New regulatory frameworks in energy, infrastructure and sanitation are attracting private investment.
The problem is fiscal. Gross debt is 83% of GDP, the interest bill is 9% of GDP, and the primary balance is a deficit of 0.5% of GDP against a debt-stabilising surplus we estimate at 2.9-3.6%. With the Selic at 13.75% and inflation near 4.6%, the real policy rate is around 9%, among the highest in the world.
The form of the adjustment matters as much as its size. Small packages tend to be judged insufficient on arrival and leave the risk premium unchanged. Brazil has adjusted successfully before. In 2003 the incoming Lula government raised the primary surplus target to 4.25% of GDP and the Selic fell from 26.5% to 16.5% within the year. In 2016 a constitutional spending ceiling allowed the Selic to fall from 14.25% to 6.5% by 2018.
Missing the global weak-Dollar wave
We remain bearish on the US dollar over the medium term. Large US twin deficits and rising institutional and credibility concerns, with the Dollar still expensive, are pushing investors to diversify away from US assets. A weaker Dollar supports commodity prices and flows into emerging markets.
Most emerging markets meet this cycle with improving fundamentals. As we discussed in our latest Market Commentary, we estimate 22 upgrade candidates for every 11 downgrade candidates in the EMBI GD.1 Frontier economies such as Egypt and Pakistan are delivering orthodox adjustments. Among the larger countries with fiscal problems, South Africa, Malaysia and India have adjusted, and Romania, Panama and now Colombia are in the process. Brazil stands out. Its debt/GDP is the highest in its rating peer group, and without an adjustment it is likely to miss the external tailwinds.
Debt dynamics: interest rates versus growth
Debt/GDP rises when the interest rate on the debt exceeds nominal GDP growth, unless a primary surplus covers the gap. Over the past 20 years Brazil’s nominal growth averaged 9.3%, with lows of 3.0% in 2020 and 3.8% in 2015 and a high of 18.4% in 2021. With inflation at the 3% target, a GDP deflator running about 0.75pp above CPI and real growth of 2%, nominal growth would be about 6%. Next year’s 6% inflation and 0.5% growth give about 7%, but only because inflation keeps rates high. Meanwhile the average funding cost is 12.6% and new issuance costs over 14%. At 12% rates and 6% nominal growth, debt reaches 104% of GDP by 2030 without a primary surplus (Table 1).
Table 1: Gross debt/GDP in 2030 (%) by interest rate and nominal GDP growth, zero primary balance, from 83.3% in 2026
| Interest rate \ Nominal growth | 4% | 5% | 6% | 7% | 8% |
|---|---|---|---|---|---|
| 8% | 96.9 | 93.2 | 89.8 | 86.5 | 83.3 |
| 10% | 104.3 | 100.3 | 96.6 | 93.0 | 89.6 |
| 12% | 112.0 | 107.8 | 103.8 | 100.0 | 96.3 |
| 14% | 120.3 | 115.7 | 111.4 | 107.3 | 103.4 |
| 16% | 128.9 | 124.1 | 119.5 | 115.1 | 110.9 |
Source: Banco Central do Brasil (BCB; SGS 4382, 7326, 5727, 5793, 13762), Tesouro Nacional, Ashmore.
Three scenarios
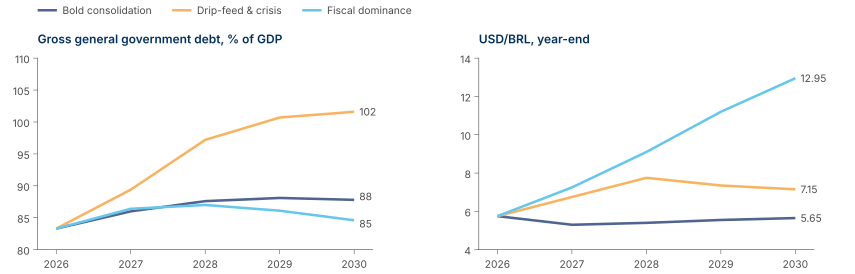
Figure 1 shows three stylised debt scenarios. They illustrate the direction of travel rather than forecast it.
Bold consolidation. A primary surplus of 0.5% of GDP in 2027, tax-rebate cuts worth 1% of GDP in 2028-29 and primary spending growing 0.75% a year in real terms (with the minimum wage de-indexed and pensions and health and education floors brought within the spending ceiling) take the primary surplus to 2.6% of GDP by 2030. If real rates fall to 6% within two years and the Selic to 8.5% by 2030, gross debt peaks at about 88% of GDP in 2029 and declines thereafter.
Drip-feed & crisis. Small adjustments do not stabilise expectations. The BRL weakens to 6.75 by end-2027 and 7.75 in 2028, the Selic rises to 17%, and tighter credit conditions push the economy into recession in 2027-28. The government is then forced into a faster adjustment, with the primary balance moving from −0.6% to +2.5% of GDP in two years. Debt still reaches about 102% of GDP by 2030 and keeps rising.
Fiscal dominance. The Selic is cut to 10% in 2027 and 7.5% in 2028 without fiscal adjustment. Inflation reaches 17% and USD/BRL about 13 by 2030. Debt/GDP falls to about 85% as inflation lifts nominal GDP, but real incomes and the currency take the hit.
Figure 1: Three scenarios for Brazil’s debt and currency
The base case: drip-feed, dollarisation and a sharper slowdown
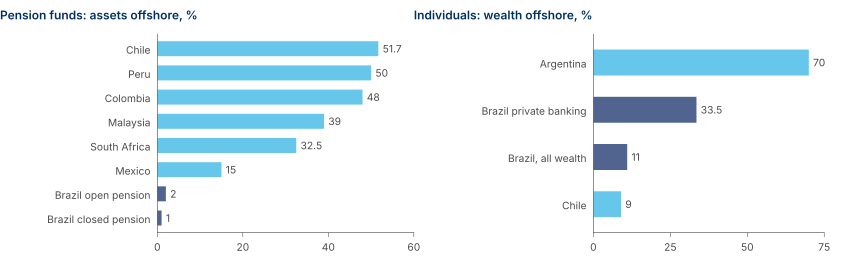
Brazilian savings are among the least internationally diversified in emerging markets. Our research suggests closed pension funds hold BRL 1.36trn with about 1% offshore, open pension plans BRL 1.9trn with an estimated 2%, and retail investors about BRL 6trn with little offshore exposure. Pension funds in Chile, Colombia and Peru hold close to half their assets abroad. Private-banking clients hold about a third of their wealth abroad (Figure 2).
Figure 2: Offshore allocations, Brazil versus peers
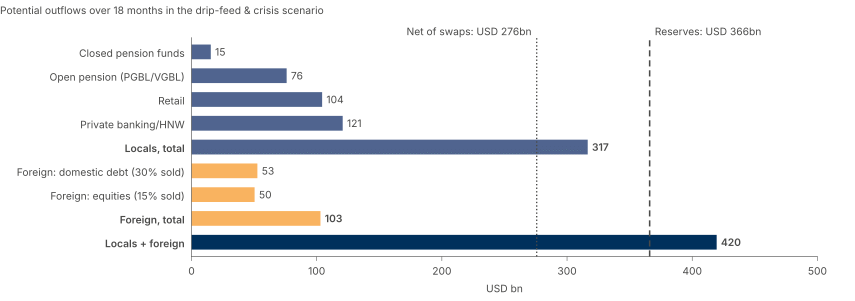
If, in the drip-feed scenario, closed pension funds move to 7.5% offshore, open pensions to 25%, retail investors to 15% and private-banking clients to 50% over 18 months, the outflow can reach USD 317bn, or 12.3% of GDP. Non-residents hold USD 336bn of Brazilian equities and USD 175bn of domestic debt. In past credibility shocks (Brazil 2015-18, Mexico 2020-23, South Africa 2018-24) foreign holders cut local-bond holdings by 15-35% over 12-24 months. Selling 30% of bonds and 15% of equities would add about USD 103bn, taking the total to about USD 420bn, or 16% of GDP, above the USD 366bn of reserves (Figure 3).
Figure 3: Stress test: Potential outflows estimate (USD bn)
Using IMF elasticities of 1.7-2.0% per 1% of GDP of flows, the gross outflow would take USD/BRL from 5.75 to 7.3-7.6 by mid-2028. Stabilising flows offset part of this: exporters gain, wealthy locals buy back shares or acquire assets, and companies sell assets to repay debt. Net of these and the basic balance, USD/BRL reaches 6.9-7.1, or 7.7 under stress (Table 2). With an 18-month BRL carry of 21% against 7.5% in Dollars (a portfolio yield above US Treasuries), the break-even for holding reais is near 6.45.
Table 2: USD/BRL by mid-2028 from 5.75, drip-feed & crisis scenario
| Flow | USD bn | % GDP | Elasticity 1.7 | Elasticity 2.0 | Stress (3.0) |
|---|---|---|---|---|---|
| Locals, gross | 317 | 12.3 | 6.95 | 7.16 | 7.87 |
| Locals + foreign, gross | 420 | 16.3 | 7.34 | 7.62 | 8.56 |
| Net of basic balance, stabilising flows & trade response | 330 | 12.8 | 6.90 | 7.09 | 7.67 |
Source: Ashmore; elasticities from Adler, Lisack & Mano (IMF Working Paper 15/130); trade response from IMF World Economic Outlook (Oct 2015, ch. 3). Gross of central-bank intervention and any Selic response.
Brazil versus Peru: the price of a large state
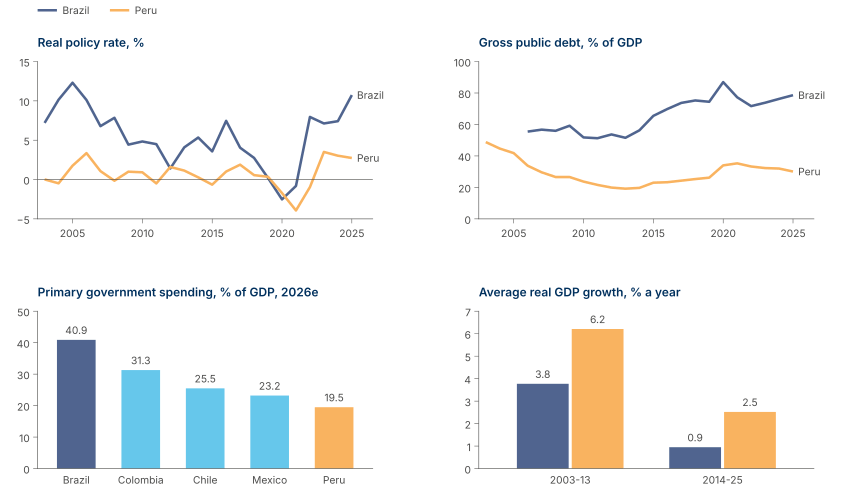
Emilio Ocampo argues that Brazil’s high real rates reflect the cost of holding reais issued by a large, indebted state that spends too much and poorly.2 In 2002-13 Brazil ran a higher average primary surplus than Peru (2.6% against 2.1% of GDP). Yet Peru cut its gross debt from 49% of GDP in 2003 to 19% in 2013, while Brazil’s was little changed (56% in 2006, 52% in 2013) and has since risen to 79%. The IMF puts primary spending at 19.5% of GDP in Peru in 2026 against 40.9% in Brazil, up from 38.2% in 2022.
Since 2010 Peru’s real policy rate has averaged about 0.6%, against 4.3% in Brazil, and Peru has outgrown Brazil by more than 2pp a year in 2003-13 and about 1.5pp a year since 2014 (Figure 4), despite political instability and frequent changes of president.
Figure 4: Brazil and Peru
The tail risk: cutting rates without fiscal adjustment
In September, André Lara Resende, an influential economist who worked on the Real Plan, wrote a paper criticising Brazil’s elevated interest rates. We believe this was a provocation and some of his ideas were misunderstood, but it led to growing speculation on a possible path where the central bank would lower interest rates without a proper fiscal adjustment.
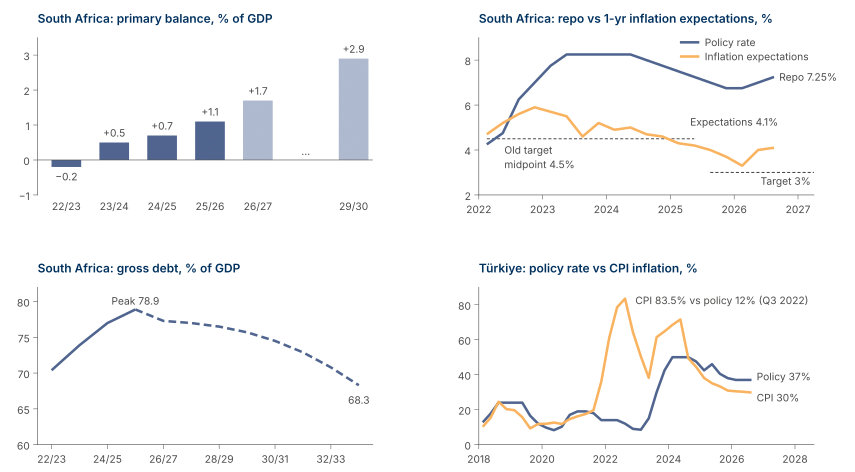
Türkiye cut its policy rate from 19% to 8.5% between September 2021 and February 2023 while inflation rose. As a result, inflation peaked at 85.5%, the lira lost more than 90% of its value between 2017 and 2025, and the return to orthodoxy required a 50% policy rate. In contrast, South Africa’s central bank stayed orthodox while fiscal slippage took gross debt from 49% to about 80% of GDP between 2017 and 2025, with growth below 1%. Primary surpluses from 2023/24 and state-owned enterprise reforms then allowed a lower 3% inflation target. Ten-year yields fell from 11.5% to below 9%, and gross loan debt is projected to peak at 78.9% of GDP last fiscal year and fall towards 68% by 2033/34 (Figure 5).
Figure 5: South Africa’s fiscal repair and Türkiye’s rate cuts
Conclusion: what would it take?
The best-case scenario is Geraldo Alckmin as finance minister, supported by a trustworthy team of economists, with a clear mandate to fix the fiscal accounts while preserving Lula’s social agenda. The package could be less demanding than those Colombia has announced and Romania is implementing, but it needs to be announced at once: de-indexing the minimum wage from GDP growth, unlinking health and education floors from revenue, tightening eligibility for social programmes and cutting tax rebates.
Table 3 sets out 18-month US dollar returns, using the recent election results as a template. The first round moved the Ibovespa up 7.7%, the BRL 4.1% stronger and the Jan-2031 rate futures 122bps lower as the market priced a positive credibility shock. Then the runoff took the Ibovespa down 13.9%, the BRL 8.2% weaker and rates 255bps higher. The bold scenario reverses the runoff move by restoring the credibility anchor. We also assume that, under fiscal dominance, equities broadly hold their Dollar value, as Turkish stocks did in 2021-22 and Argentine stocks in 2019-23, while local bonds and cash lose value.
Table 3: US dollar total returns over 18 months (Nov 2026 to May 2028), by scenario
| Scenario (mid-2028) | USD/BRL | 10y local yield | Ibovespa (BRL) | Ibovespa, USD return | NTN-F 10y, USD return | CDI, USD return |
|---|---|---|---|---|---|---|
| Bold consolidation | 5.35 | 12.0% | 215,000 | +44% | +49% | +28% |
| Drip-feed & crisis | 7.25 | 18.5% | 147,000 | -27% | -12% | -1% |
| Fiscal dominance | 8.20 | 19.5% | 234,000 | +2% | -25% | -20% |
Source: Ashmore; B3, BCB, Tesouro Direto (election-day moves); BIST, Rava (Türkiye and Argentina). Start: USD/BRL 5.75, Ibovespa 172,458, 10y Nota do Tesouro Nacional, Série F (NTN-F) 15.3%, Certificado de Depósito Interbancário (CDI) 13.65%. Ibovespa includes a 5% dividend yield. Illustrative, not forecasts.
Brazil has the reserves, external accounts and institutions to avoid a crisis. What it lacks is a credible fiscal anchor. Ending his fourth term as he began his first would put Lula among Brazil’s most consequential leaders and allow Brazil to share in the weak-Dollar cycle; the alternative is a slower, more costly adjustment that would rhyme with 2015-16.