Today, oil exposure among Emerging Market (EM) nations is very diversified. Of course, there are major EM oil exporters, but most countries are net energy importers. In weighted terms, only 17% of the JP Morgan index of EM sovereign bonds (EMBI GD) are currently issued by net oil exporters.
The relationship between EM sovereign credit and oil prices is positive, but not linear. EM credit spreads will often widen when oil sells off, but most of this correlation comes during major global slowdowns. In these scenarios, oil exporters tend to underperform, but most risk assets, including oil importers’ debt, are likely to struggle too. Equally, during periods of strong expansion (or recovery) in the global economy, investor sentiment will usually drive prices of commodities up and credit spreads down. An overweight in oil exporting countries can then provide some high beta returns or help to hedge against the inflation that often results from high energy prices.
At a time when there is ample excess supply from OPEC+ waiting to return to the market, a sluggish economy and accelerated energy transition in China is lowering the demand for crude. Commodity traders have been bracing for lower oil prices. For investors hanging on to the stereotype of EM as a commodity play, this might be a turn off. But next year EM gross domestic product (GDP) will likely remain robust, with only a shallow downturn expected in the West. In this benign economic backdrop, lower oil would be a net benefit for EM. Most countries would enjoy lower inflation and better consumer sentiment via lower tradable goods costs. Not to mention, the US is the largest oil exporter, so lower prices would weigh on the dollar – another positive.
While there are several elements pointing towards lower oil prices in the short term, when thinking longer term about commodities it is important to separate short-term cyclical and structural factors. Of course, the energy transition lowering oil demand is a structural trend that will continue. But oil demand will also be structurally supported by: (1) the fast development of poorer EM countries with large populations, such as India; (2) AI adoption; (3) nearshoring capex; and (4) the reversal of inequality.
Wide exposure: EMBI GD and oil related little, until big moves
Since 2000, the correlation between monthly changes in Emerging Market Bond Index (EMBI) spreads and monthly oil price changes has been -0.40. This suggests a relatively strong relationship between oil prices and EM sovereign bonds. Intuition would probably tell you that much of this correlation comes on big risk-off moves. Fig 1 shows this to be true.
Fig 1: Brent oil prices and 3-month moving avg. correlation of Brent vs. EMBI spreads
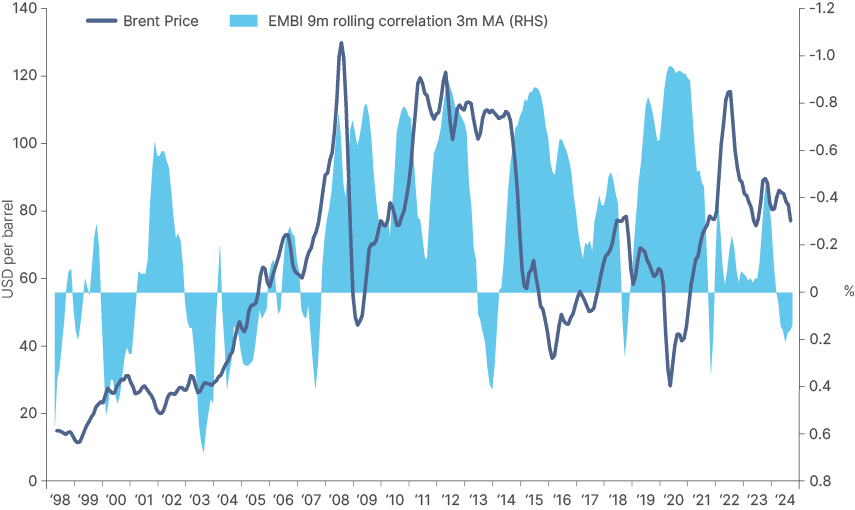
During these periods, the higher correlation can be attributed largely to major shifts in investor sentiment around economic activity and demand, at which time almost all risk assets will move together. As Fig 1 shows, since 1998, correlation has tended to spike when plunges towards USD 50, and when it rallies above USD 100. Naturally, the correlation is highest when the momentum is strongest. If you remove just two big global volatility events from the data set, i.e. 2008 and 2020, the correlation becomes far weaker, dropping to -0.19.
One standout event of high correlation was the August 2014 to August 2016 period, when the correlation between EMBI spreads and Brent prices rose to -0.71. Context matters: Brent prices had been above USD 100 per barrel from January 2011 to September 2014 before rapidly declining towards USD 50. The trigger here was supply. Production of US shale oil was skyrocketing, and OPEC, led by Saudi Arabia, had been cutting output in response. But in September 2014, OPEC decided to defend market share rather than prices. They unleashed more supply, hoping to push the higher cost US shale producers out of the market by letting prices fall.
The sell-off coincided with the tail-end of the ‘Taper Tantrum’ episode, a severe balance of payment adjustment period within EM. This started in May 2013 when the US Federal Reserve started to taper its quantitative easing programme, forcing EM countries running large current account deficits to undertake a painful adjustment. As oil prices declined, other commodities followed, and EM commodity exporters had to adjust their external imbalances amid deteriorating terms of trade. This led to a large spread widening in EM in 2015, when Brent averaged USD 54. Unlike in 2008 and 2020, the fall in commodities was the trigger forcing this macro adjustment, rather than a global recession.
This scenario is unlikely to repeat, as the conditions prevailing in 2013 to 2015 are no longer evident today. Far fewer EM countries have severe balance of payment and fiscal issues. Those that do are smaller nations and have mostly been working hard to improve their balance sheets (e.g. Oman, Angola, and more recently, Nigeria). These countries have repeatedly said lower oil prices would lead to expenditure cuts. In our view, if commodity prices decline in the absence of a recession, this would lead to winners (importers) and losers (exporters), but not an acute sell-off, as in 2015. Furthermore, the US is today the largest oil producer in the world. Thus, weaker oil price should bring the dollar down, which would help, rather than hinder, EM assets.
Mapping exposures: Negative correlation to oil prices
Of the 73 countries currently in the EMBI GD index, 24 are net energy exporters. The 16 countries in Fig 2 are members of the EMBI GD index with a net energy trade of 5% or more. These are mostly in the Middle East, but some are in Africa and South America too. 12 of these countries’ USD bond spreads exhibit a correlation of -0.4 (average) or more with oil prices.
Fig 2: EMBI GD countries with largest correlation with oil prices
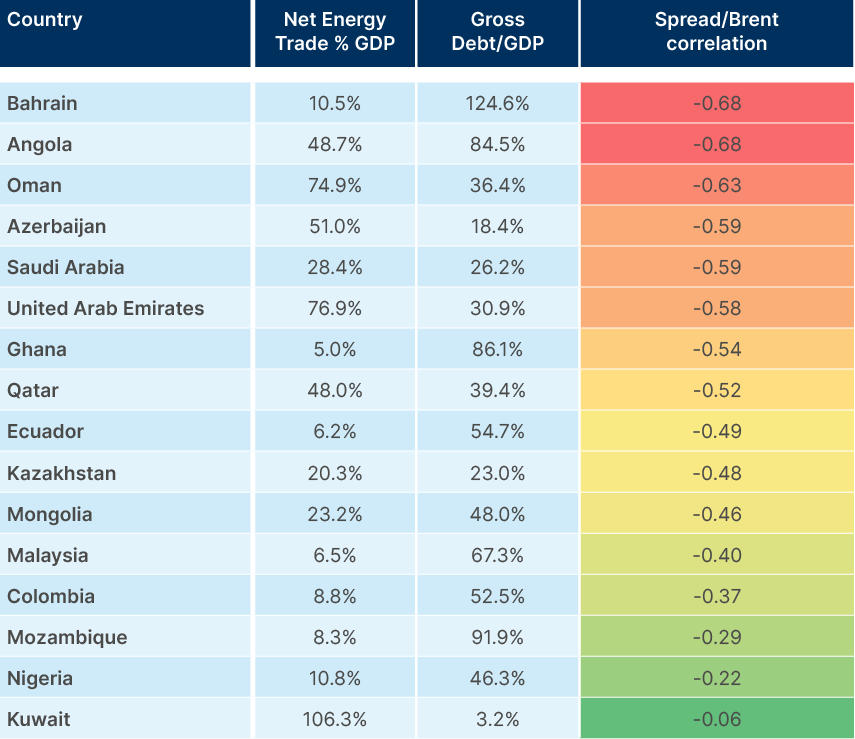
The spreads of large net energy exporters, including Angola, Oman, Azerbaijan, Saudi Arabia, United Arab Emirates, and Qatar, are correlated to oil prices because of the huge effect oil revenues have on fiscal and external balances. In these countries, oil exports tend to be dominated by a state-owned-enterprise such as Saudi Arabia’s ARAMCO. So, revenues from oil sales flow directly to the government. When oil prices are up, these countries do very well, but a crash can change the picture quite quickly. This is one of the reasons why the Gulf countries that can afford to do so are investing aggressively in economic diversification, particularly as the energy transition calls for a major reduction in global reliance on oil. Saudi Arabia’s ‘Vision 2030’ is one of the most ambitious development plans ever conceived.
Debt levels matter as well. Countries with a much smaller net energy surplus, but high debt levels – like Ecuador, Ghana, and Bahrain – display a much larger correlation with oil prices. Despite having a more diverse economy than its Gulf Cooperation Council (GCC) neighbours, Bahrain’s high debt burden means oil price volatility causes big moves in its spreads. On the other hand, Kuwait is by far the largest net energy exporter, at 106% of GDP, but its risk premium has almost no correlation to oil prices, as there is so little outstanding debt, and issuance has been very limited over the last years for domestic political reasons.
Energy importers
Countries with large net energy imports relative to GDP should be hurt by higher oil prices via their current account. Fig 3 filters countries with debt/GDP greater than 40% which would be vulnerable to upward swings in energy prices and would benefit from lower prices.
Fig 3: EMBI GD countries with lowest correlation with oil prices?
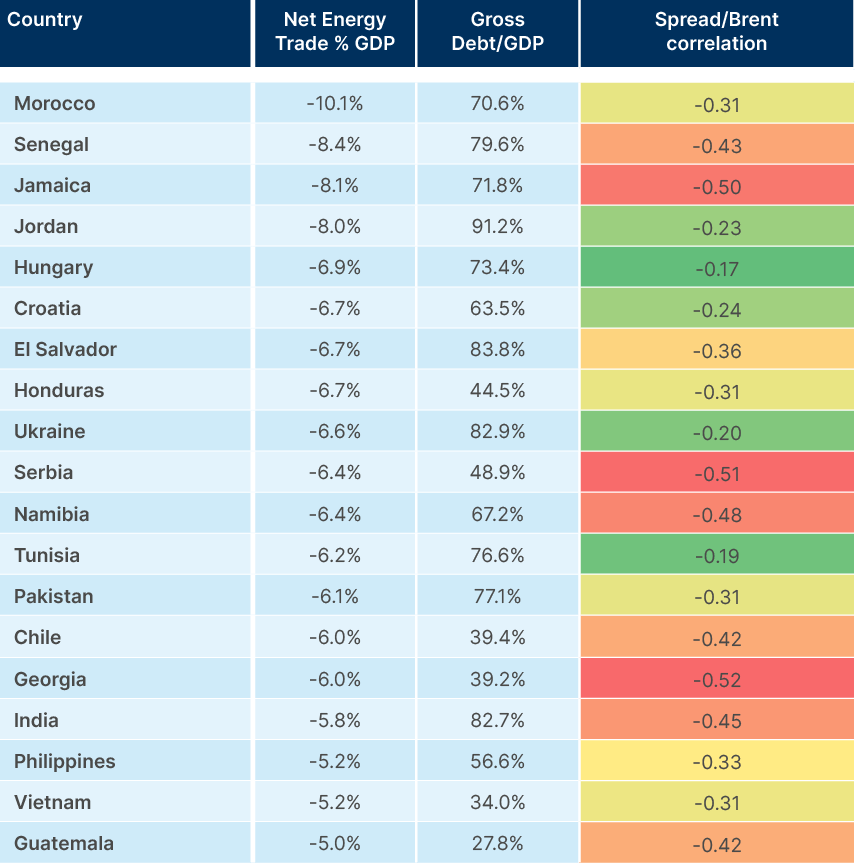
The relationship here is far less obvious for a few reasons. The first is the fact that oil volatility only has an indirect impact on net importers fiscal balances. Because the private sector is usually the largest buyer of oil, higher prices primarily impact the current account, rather than the budget balance. Government finances are affected, but less acutely, through lower profit margins and therefore tax revenues from domestic businesses, as well as inflation and foreign exchange rates. Second, net energy deficits for importers are far less pronounced than many of the surpluses in the exporters. Third, some energy importers are also exporters of other commodities, which often oscillate with oil prices, providing some hedge to oil volatility. But perhaps most of all, when oil prices rise during periods of strong demand and ‘risk-on’ sentiment, all EM spreads tighten, regardless of whether their current account will suffer. Equally, when oil prices go down during periods of economic distress, spreads will almost always widen. Over a longer period, these effects mean some energy importers’ EMBI spreads also display negative correlation with oil prices (i.e., spreads rise when oil prices decline).
Nevertheless, oil importers tend to be less sensitive to price swings. Examining specific periods demonstrates more clearly why active investors need to take oil prices into account for importers. There have been multiple instances where spreads have widened noticeably against higher oil prices for certain countries. Normally this happens when oil prices have been high for a sustained period, long enough to impact the economy. All else equal, higher oil typically negatively impact bond prices for net oil importers. All else is rarely equal, however. Therefore, considering the extreme variation in sensitivity to commodities in EM, active investors should establish commodity profiles for each country, and use them as inputs in investment analysis exactly as one would do with other unique, country-specific macroeconomic variables.
Energy trends: Cyclical factors
One of the most succinct global economic cycle indicators, the OECD G-20 leading indicator composite, shows that the global economy is still in expansion, but not far from downturn territory (Fig 4). This matters for energy (and commodity) prices, which typically suffer during downturns and sell off hard in recessions. The proximity to a downturn and large spare capacity within OPEC+ explain why speculative position in oil futures have moved to the lowest historical levels, putting downward pressures on prices.
Fig 4: OECD G-20 Leading Indicator: Index level vs. mom change
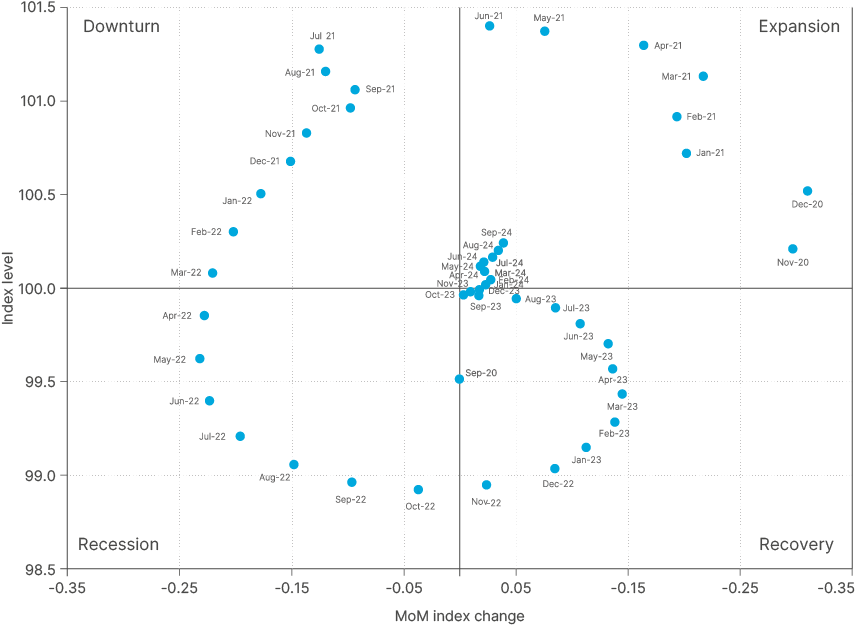
However, a steep activity downturn next year is not our base case. First, the current expansion has been one of the narrowest on record as the index barely crept above 100 in 2024 after being in negative territory in 2023. Shallow downturns are usually the pattern following shallow expansions. Further, global central banks have a lot of room to ease monetary policy, not just in the US, but across the world, which should provide a backstop to a cyclical downturn, should it happen in 2025.
Demand
With only a shallow expansion in the global economy in 2024 so far, oil demand growth has been tepid. China is the world’s top buyer of crude on international markets, and has been very weak, using fewer barrels of oil per day (bpd) over the summer months than it did last year. Its yearly usage is only expected to rise 180k bpd on a 2024 average basis, according to the International Energy Association (IEA). To put this into perspective, Chinese oil demand rose by a million bpd 2023 on a post-Covid surge and has grown on average 600kbpd annually over the last decade. News of monetary and fiscal stimulus from the People’s Bank of China and the Politburo may have restored some ‘animal spirits’ in Chinese equity markets, but whether this will translate into a sustained recovery in economic activity and oil demand growth remains to be seen.
In the US and Europe, oil demand is expected to rise only c. 1% in 2024. This partially reflects that, despite some economic growth, manufacturing has remained depressed, with economies largely propped up by less energy-intensive service industries. Energy efficiency is also a big part of the story, particularly in China and Europe, where adoption of electric vehicles (EVs) is accelerating at a much faster pace than in the US.
If 2024 demand growth in developed markets has been weak, 2025 will probably be even weaker, considering the cyclical backdrop. Accordingly, the EIA expect oil demand next year to rise just 100k bpd in the US, from 20.4 to 20.5 million bpd (mbpd). World demand, however, is expected to grow by 1.2 mbpd, driven primarily by EM (which contribute 55-60% of total oil demand). This number is expected to rise this decade, with robust expansion in fast markets such as Indonesia and India contributing to the majority of oil demand growth as Europe and the US begins to slow down.
Supply
There is already a lot of excess oil supply in the market, after deep OPEC+ supply cuts were extended into 2025. Furthermore, non-OPEC supply is expected to grow by 1.7 mbpd, surpassing the 2024 growth of closer to 1.0 mbpd. This will be driven primarily by new oil fields coming online in Brazil, the US, Guyana, Canada and Norway. In other words, supply growth, even if OPEC do not unwind any cuts, new supply is expected to outstrip any growth in demand in 2025. The growing preference for liquified natural gas (LNG) as a less carbonintensive oil alternative has also led to a quickly expanding supply of the commodity, primarily from the US, Qatar, and Russia.
Balance
All else equal, this supply/demand balance outlook points towards downside pressure on oil prices in 2025. The EIA expects the Brent price to average USD 78 per barrel over the year, which should be a benign level for markets and EM sovereign bond spreads. Commodity traders are currently bracing for lower oil prices as the result of the accelerated energy transition in China lowering demand, while there is ample excessive supply that can return to the market. There are various swing factors to this story, however.
Known unknowns: Key swing factors
1. China
Policymakers’ efforts to restoke consumer demand and reflate the economy will likely raise oil demand for the world’s largest oil consumer in 2025. The larger the fiscal support package is, the more this should transmit into a resurgence in oil demand growth, particularly if China’s housing market recovers.
2. Geopolitical disruption tail risks
The main tail risk for higher oil prices in the very short term lies in the conflict in the Middle East. Israel’s retaliation against Iran focused on military strikes, but the situation in the region remains fluid and perhaps contingent on the US election outcomes. Should Israel go after Iranian oil fields in the future, a significant loss of production may ensue. Iran has exported 1.8 mbpd over the last 12 months. But the biggest tail risk is whether Iran decides to retaliate further by restraining access to the Strait of Hormuz, where c. 20% of global oil trade flows as well as nearly a quarter of LNG. Iran could decide to attack and destroy other oil fields in the region, in Saudi Arabia for example.
A less disruptive scenario would be simply an escalation of sanctions against Iran by the US, which started a few weeks ago. Sanctions could be tightened further should Trump be elected President, or in a scenario where Iran attacks Israel again following the Israeli response.
3. US shale oil production declining
So far, oil pundits calling for a drop in shale oil production have been ‘waiting for Godot’. Nevertheless, if rig count keeps declining, eventually production will follow. This is particularly true as it is well-known that the more productive fields in the Permian Basin are close to exhaustion. However, the shale revolution is entering a new phase as infrastructure allows for better commercialisation of the natural gas byproduct of fracking. An expanding LNG capacity could offset at least some of the deterioration in shale oil yields.
Structural changes
Beyond short-term supply and demand dynamics, structural socioeconomic changes will reshape fossil fuel demand in the long-term. Some of these are conflicting, and happening at the same time. For this reason, there is a significant divergence in the oil demand outlooks of the IEA and OPEC, highlighting the differing assumptions about how quickly the world will shift from fossil fuels to cleaner energy sources. While the IEA’s projections align more closely with global climate targets, OPEC’s outlook reflects the importance of oil for economic development in non-OECD countries.
The IEA expects global oil demand to peak at around 106 mbpd by the end of the decade, from 102 mbpd in 2024. This outlook is largely influenced by the projected rise of EVs, and the global shift toward renewable energy sources, particularly in developed economies where demand is expected to decline.
Of course, because most of OPEC’s members are large net-oil exporters, they may have a bias. Still, the cartel forecasts that oil demand will continue to grow through 2030 and beyond, driven by strong demand in emerging economies, particularly in India and others in Asia, the Middle East, and Africa. Part of this expansion is explained by petrochemicals, which explains why the Gulf countries have been investing in such facilities around the world. OPEC does not foresee a peak in global demand until at least 2045, citing resistance to rapid energy transitions and the continued importance of oil in these emerging economies.
In our view, the five dynamics below will be the main drivers of structural oil demand:
1. Energy Transition: Leaning against all the four following factors that point to higher energy demand is the energy transition. Under the IEA’s ‘announced pledges’ scenario, global oil demand would start declining from 2025, with annual consumption 2 mbpd lower by 2030. While the ‘announced pledges’ scenario is perhaps not a realistic one, it does demonstrate the public intention by both sovereigns and corporates to reduce dependence on fossil fuels soon.
So far, China is the big champion in scaling-up the manufacture of solar panels and wind turbines and EVs. Already, China’s fast EV adoption is a key factor weighing on lower global demand for energy in 2024. The IEA said in a report last week that it believes OPEC has been “wrong-footed” by the surge in electric mobility in China this year, leading it to revise down its short-term demand outlook numerous times. According to the CEO of Vitol Group, the world’s biggest independent oil trader, China’s rapid shift towards EVs is likely to bring about a peak in domestic gasoline demand by 2025. As the largest driver of oil-demand growth, China’s trajectory will likely remain the most important swing factor for global consumption in the coming years.
2. GDP per capita: The structural growth of GDP per capita of low-to-middle income countries with large populations and favourable demographics, such as India, Indonesia, and most of the African continent, has the potential to add a significant source of demand for energy, including not only fuel, but other oil derivatives from the petrochemical industry. India is expected by the IEA to replace China as the world’s primary driver of oil demand growth as soon as 2027, as more oil and gas will be needed to bring roughly a billion people out of energy poverty.
3. AI and datacentres: Another bullish element to take into consideration is AI and datacentres, which are incredibly energy intensive. For example, a simple query to a large language model such as Chat GPT consumes 10x as much energy as traditional internet search engines such as Google. Even if these tools become more efficient, their mass adoption and the possibilities of automation of services and electronics thanks to AI will probably lead to more, not less, energy consumption.
4. Nearshoring: One of the greatest deflationary elements of the 1980s-2020s great globalisation period was from production being outsourced from places with elevated labour costs and less efficient supply chains to, mostly, China. Today, nearshoring is adding a renewed demand for capex everywhere else in the world but China, and even Chinese manufacturers are part of it. But the world is decades and hundreds of billions of dollars’ worth of Capex away from reducing its dependency on Chinese manufacturing. The process of doing so will be energy intensive.
5. Reversal of inequality: As China became the factory floor of the world, it boosted billions out of poverty – both in China and in countries supplying China with muchneeded commodities like iron ore, copper, oil and coal. However, in the West, the process of de-industrialisation created many losers, whose living standards either deteriorated or ceased to improve. This widening inequality in the west was the root cause of the political instability that brought populists from the right and left to power, starting with Brexit in 2015 and Trump in 2016.
Post Covid-19, even countries with sensible politicians had little option but to implement policies to reverse this inequality, with most of the western world spending big. Policies to reverse inequality have historically been associated with commodity super cycles, as the lower income cohort has much higher pent-up demand for durable goods than higher income ones who tend to have higher saving rates. Hence, inequality is deflationary as it leads to lower demand for durable goods, and higher demand for financial assets. Reversing it is inflationary.
Allocation considerations
Over the last few decades, many investors have been shunning commodities and assets with a relatively high correlation to them. Commodity prices tend to do very well during the recovery and expansion phases of the business cycle, but so do assets investors already own, like equities. Furthermore, commodities have underperformed cyclical assets since at least 2009, as demand softened and supply improved.
But the fact that commodities were a poor asset to own from 1980 to 2020 (except for the 2002-07 period) doesn’t mean they won’t ever have a role in portfolios. Structurally, commodity prices outperform in high inflationary environments, such as in 2022 following Russia’s invasion of Ukraine, when commodities eclipsed all other asset classes. Commodities can also protect portfolios in the worst-case scenario of the global economy moving to a low growth and high inflation scenario – ‘stagflation’ in financial jargon.
Another element favouring some allocation to commodities is the fact that investors have sold most of their exposure to it. That means commodity futures prices are in many markets trading below their spot prices, giving investors a positive carry on their positions!
The risks mentioned above suggest asset allocators should consider increasing exposure to commodities during the upcoming cyclical downturn. Investors unwilling to have yet another asset class in their portfolio should at least consider adding allocation to assets that tend to do well in expensive commodity environments, such as EM energy exporters’ bonds and commodity companies within EM. These assets can often offer an excessive risk premium that is attractive.
Conclusion
Much of the historical correlation between oil prices and EM bond spreads has been driven by extreme market events, such as global recessions in 2008 and 2020, or significant supply shifts like the crash in oil prices of 2014. Outside recessions and ‘black swan’ events, the correlation between oil and EMBI spreads is quite low. Most EM countries are either net-importers of energy or have economies diverse enough to reduce their vulnerability to commodity price declines. But several net energy exporters in EM remain highly sensitive to oil price fluctuations, particularly in the Middle East. During periods of commodity strength and higher inflation, investing in these countries’ assets can be a useful way for investors to maximise returns, or to protect capital.
Therefore, a blanket approach of viewing Emerging Markets (EM) as simple commodity plays is increasingly outdated. Instead, a nuanced understanding of each country’s unique commodity exposures and structural dynamics is essential for informed investment decisions. To capitalise on the evolving relationship between oil prices and EM debt, active management that emphasises country-specific factors will be critical in the coming years. This targeted approach will better capture the complexities and opportunities within each EM economy, allowing investors to better navigate shifting global and local economic landscapes.