
Seismic US policy shifts have been advancing political and policy changes across the world in response. In this piece, we offer an overview of the global macro context behind Germany’s historic fiscal reform, and the impact it can have on emerging markets (EM).
1. Global context
Our 2025 outlook was centred on US policies (fiscal, tariffs, geopolitics, immigration) and their likely impact on the rest of the world. In January, we highlighted that US exceptionalism was anchored in a pro-cyclical fiscal stimulus programme that was coming to an end.
After only two months in power, the actions of Donald Trump and his cabinet have already led to major developments in global markets. Elon Musk’s DOGE driving spending cuts and a smaller government is important. So are, of course, tariffs. But perhaps most consequential has been President Trump and Vice-President JD Vance’s cavalier approach to foreign policy, characterised thus far by Vance’s speech at the Munich security conference and then a fiery televised meeting with Ukraine President Volodymyr Zelenskyy in the Oval Office. These events have shocked the Europeans into action and transformed the global macro landscape.
Below are our views on the main policy drivers shaping the global macro narrative, along with asset prices:
- The US government wants to consolidate its 7% gross domestic product (GDP) fiscal deficit via expenditure cuts (i.e., Pentagon and military spending cuts by 8%, DOGE) and tax hikes (tariffs).
- Fiscal consolidation will lead to softer economic activity and downward pressure on long term yields, in our view. The impact on inflation is ambiguous and contingent on trade policies.
- Trump has been more disruptive with tariffs than many investors had expected/hoped.
- Trump’s unpredictable and fluid trade policies have unsettled markets. However, we still think milder tariffs will be implemented as a revenue mechanism (akin to sales tax), while aggressive tariffs will remain a bargaining tool.
- Corroborating this view is the fact that the pressure on currencies of countries threatened with aggressive tariffs (CAD, MXN, RMB, EUR) has been relatively modest vis-à-vis the tariff levels.
- Germany/EU historic shift to fiscal stimulus when European Central Bank (ECB) nominal policy rates are much lower than in the US. This can lead to a much-needed rebalancing, due to:
- Higher defence and infrastructure spending boosting EU nominal GDP growth.
- Higher wage growth raising GDP further, given the EU unemployment rate is close to a 30-year low.
- Bunds converging towards US Treasuriesyields, pushing EUR higher.
- Stronger EUR and wage growth will drive purchasing power higher, leading to more consumption and a smaller external trade surplus.
- So far, Chinese monetary and fiscal stimulus has mostly benefitted advanced manufacturers. A larger stimulus programme is necessary to rebalance the wider economy. This might include:
- Increasing payments to c. 180m rural pensioners that have miserable pensions upon retirement.
- Higher incentives (subsidies and handouts) for couples to have children.
- These policies would support lower savings rates, higher consumption and an increase in demand for houses. They would also support local assets (equities and housing), lowering the currency outflow pressures, which is bullish for the RMB.
- This next leg of fiscal stimulus will probably be implemented once China is confident the trade war is close to an end. Beijing is keeping some dry fiscal powder for the eventuality of very aggressive US tariffs (40%+).
- Japan hiking interest rates slowly leading to stronger JPY.
Each of these shifts would be very consequential in isolation; they are even more impactful in conjunction. The US has moved from running a large pro-cyclical fiscal expansion programme to consolidating its deficit just as Europe and China are doing the opposite, and Japan is hiking rates. All this points to a weaker dollar. The European shift is truly historic and the focus of this Emerging View.
2. Fundamentals
German fiscal bazooka economic impact
Led by Chancellor-elect Friedrich Merz, the Bundestag has voted in favour of reforming the German ‘debt brake’, passing a EUR 1trn defence and infrastructure investment package. Merz said that the vote to unleash borrowing was the ‘first major step towards a new European defence community”. Under Trump 2.0, the US is no longer a credible guarantor of EU security, as it has been since 1945. Fortunately, Germany has plenty of room to spend more, considering its debt burden is only 60% of GDP, down from 85% in 2012.
Such large stimulus will reverberate through European economies, with meaningful effects for exporters across the world. Countries with trade links to the EU, and manufacturing capacity to meet higher demand for defence and energy infrastructure related goods, will likely benefit most.
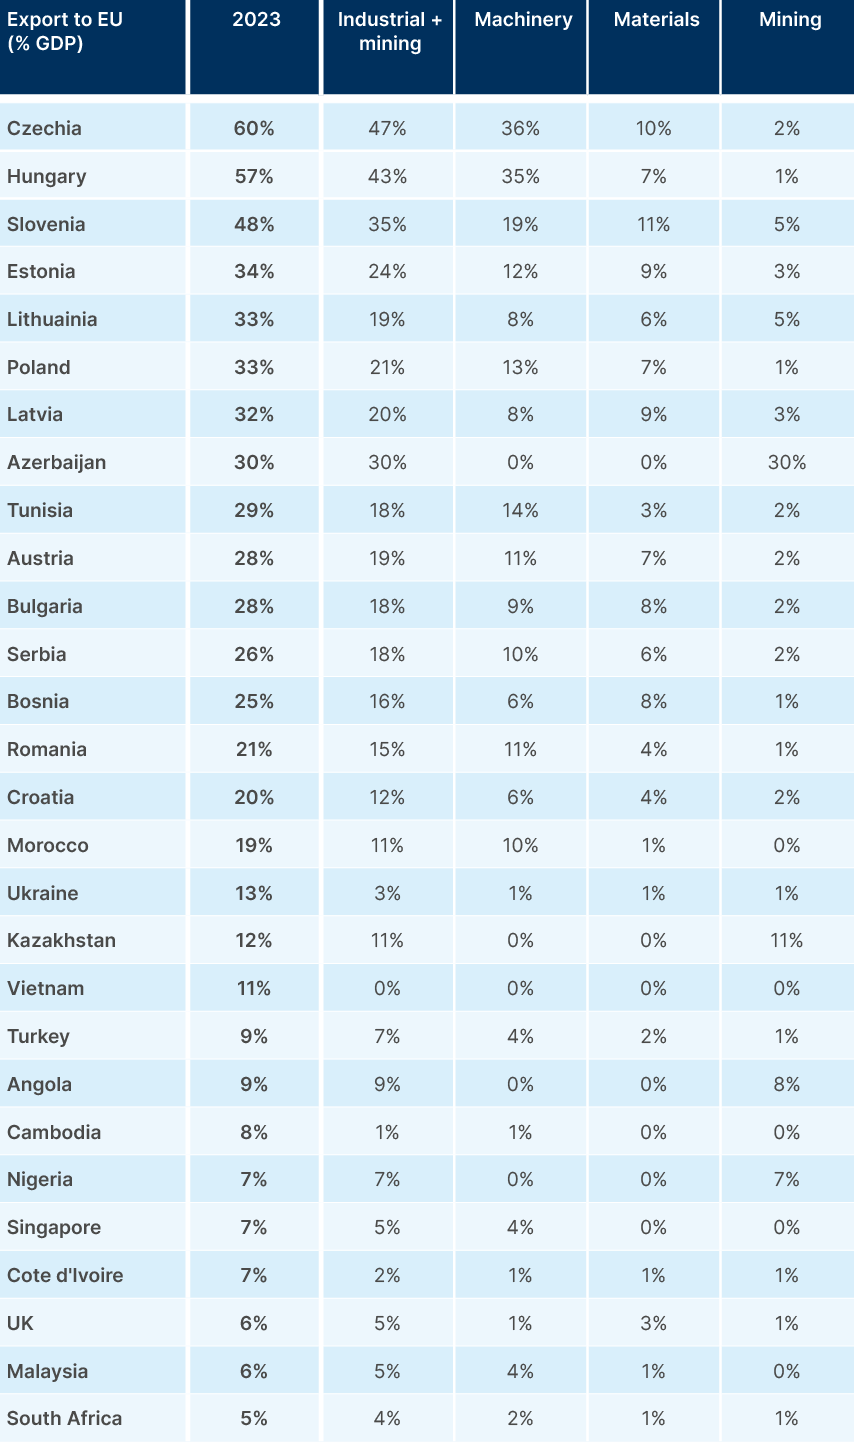
Exports to EU represent more than 30% of GDP for Czechia, Hungary, Slovenia, Estonia, Lithuania and Poland. Czechia and Hungary export the largest quantities of machinery, materials and electric goods to Germany; sectors primed to benefit from an expansion of the German industrial base. This should be very supportive for Central and Eastern Europe (CEE) currencies which have been on a 14-year weakening trend against the Greenback, but also underperforming the EUR (except for the Czech Koruna), as per Fig 1.
Fig 1: CEE currencies and EUR normalised at 100 on 31 March 2005

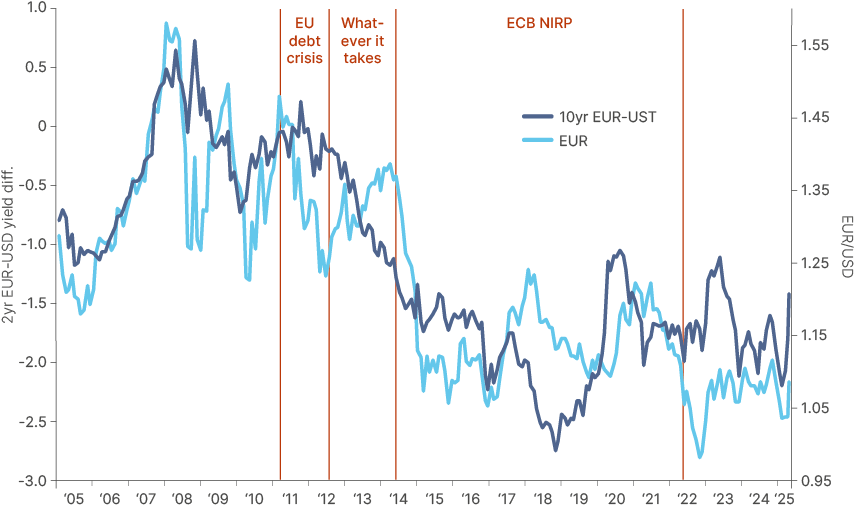
The Euro is likely to have a lot more upside from here as EU and US fiscal policies diverge. Fig 2 shows Bunds spreads to Treasuries converging which already points to further Euro strength.
Fig 2: 10-year UST vs. Bunds & EUR
Second-order effects
Given the interconnectedness of the European Union, fiscal expansion in Germany will fuel intra-EU investment and boost growth across the bloc. All else equal, this will lead to higher wages, higher interest rates and a stronger Euro, boosting the purchasing power of EU populations and lowering their savings rates. This will stimulate consumption of goods in general. The broad EU benefits will be particularly powerful if infrastructure spending comes together with productivity boosting structural reforms, in line with the Mario Draghi plan, which would boost long-term potential GDP growth, ensuring the avoidance of inflation.
The EU is the second-largest importer in the world, with EUR 2.5trn of purchases from foreign countries in 2024 (14% of global imports, close behind the US at 16%). So, stronger EU consumption is very meaningful for all countries for whom the EU is a customer. When looking at exports to the EU as a percentage of GDP, CEE countries remain first in line to benefit from more robust EU demand. However, outside of Europe, many other exporting countries will also probably be preparing for greater demand for their goods. For example, the EU is the largest customer, by far, for Tunisia and Morocco with sales to Europe responsible for 18% and 11% of respective GDP. Both countries’ principal products are electrical equipment and parts, essential equipment for powering new production lines, and building out energy infrastructure. This will be a key focus for the proposed EUR 500bn German infrastructure fund, especially after concessions have been made to the Green Party, and will raise demand for many commodities, including energy transition-related metals like copper, lithium and cobalt.
Building out this capacity, along with its defence capabilities, will also require incremental fossil fuel consumption, given Germany’s energy mix remains around 78% coal, oil, and natural gas. Azerbaijan, Kazakhstan, Angola, and Nigeria stand to benefit the most, as per Fig 3. Nuclear power currently represents 28% of the EU’s energy mix, but this is expected to rise in the next few years, likely boosting Kazakhstan’s uranium sales to the EU.
Fig 3: Exports to EU as % of each country’s GDP
3. Financial Sector
The end of US exceptionalism is a boon for EM
a. The ‘Dollar Smile’ broken
The main driver of returns for EM assets will be the end of US exceptionalism. We have long posited that US exceptionalism was backed by pro-cyclical fiscal policies, and we warned of the significant negative risk skew to US stocks in our 2025 outlook.1 The fact that US assets are selling off together with the USD confirms our thesis of a ‘Dollar Smile’ breakdown, which could trigger major asset allocations away from the US into the rest of the world.
b. The asset allocation tsunami
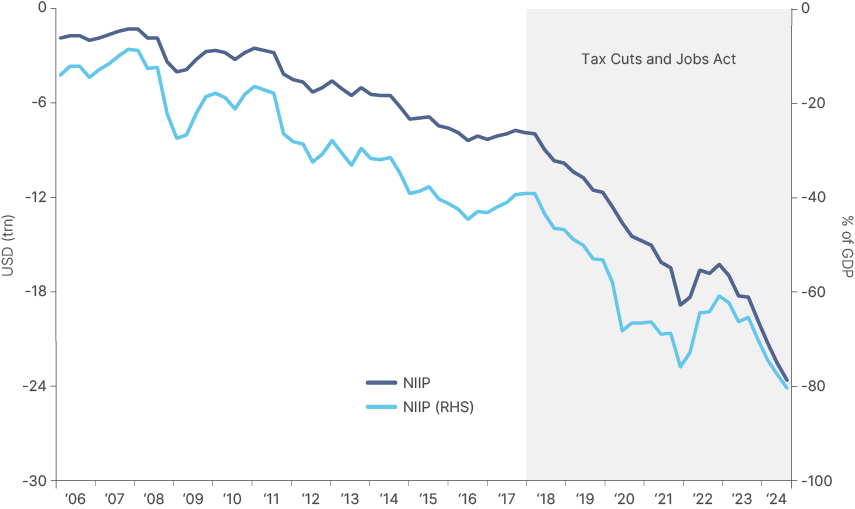
This asset allocation shift is likely to be a decade-long trend, considering the huge overexposure by global investors to US equities. A December 2024 survey of global fund managers by Bank of America showed investors had the largest overweight in US stocks in its 25-year record. The same survey also showed investors had the longest equity vs. fixed income positioning in 25 years. Passive investors have a much larger exposure than they might like, as the MSCI World had 70% weight in US stocks at the end of the year – the highest since the ‘Nifty Fifty’ bubble. Overall, foreign investors have USD 61trn (c. 200% of GDP) invested in the US, of which USD 18trn is in US stocks and USD 9trn in US Treasuries. Americans have only USD 38trn of assets invested abroad, resulting on a net international liability of USD 24trn or 82% of GDP, the highest of any G-20 country on record as per Fig 4.
Fig 4: US Net International Investment Position (NIIP)
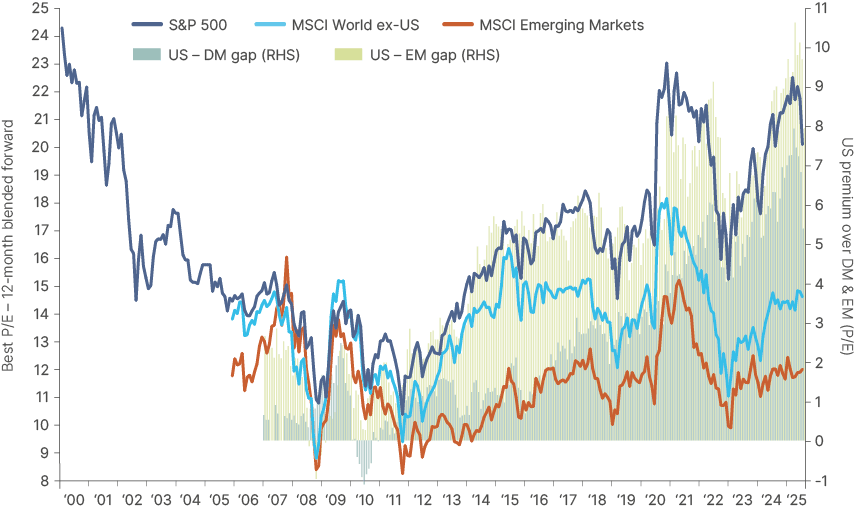
Against this backdrop, US stocks still trade at the highest-ever valuation premium to both DM ex-US and EM, as per Fig 5.
Fig 5: Price-to-earnings ratio (1yr blended forward): S&P 500 vs. DM ex-US vs. EM
c. Currency revaluation compounding the effect
As mentioned before, the US-German fiscal policy divergence (US fiscal consolidation, German fiscal expansion) will also likely drive the Euro significantly higher. A stronger Euro has always been the main driver of a weaker US Dollar, as the Euro is 57.6% of the Dollar Index (JPY 13.6%; GBP 11.9%, CAD 9.1; SEK 4.2%, CHF 3.6%) as per Fig 6. And EM assets always benefit from a weaker Dollar. When the Dollar weakens, investors diversify to the rest of the world, driving portfolio and foreign direct investment into EM countries, which supports higher GDP growth and stronger EM currencies.
Fig 6: Dollar Index vs. USD-EUR parity
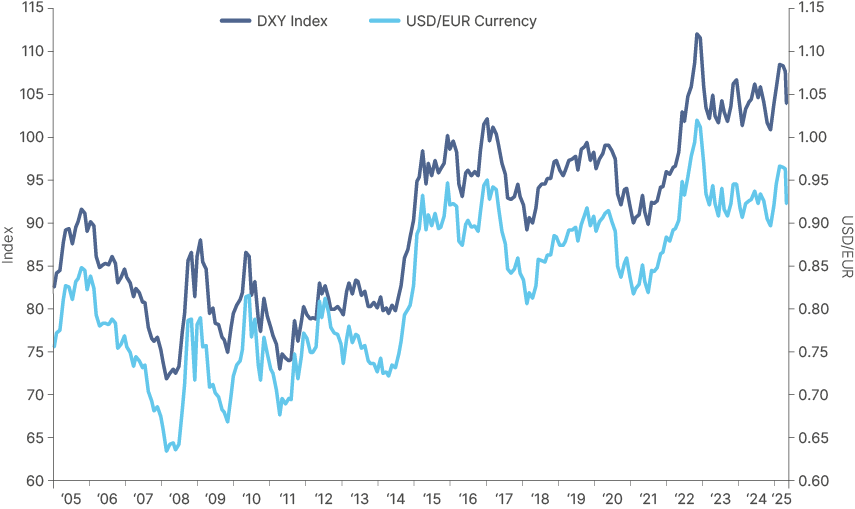
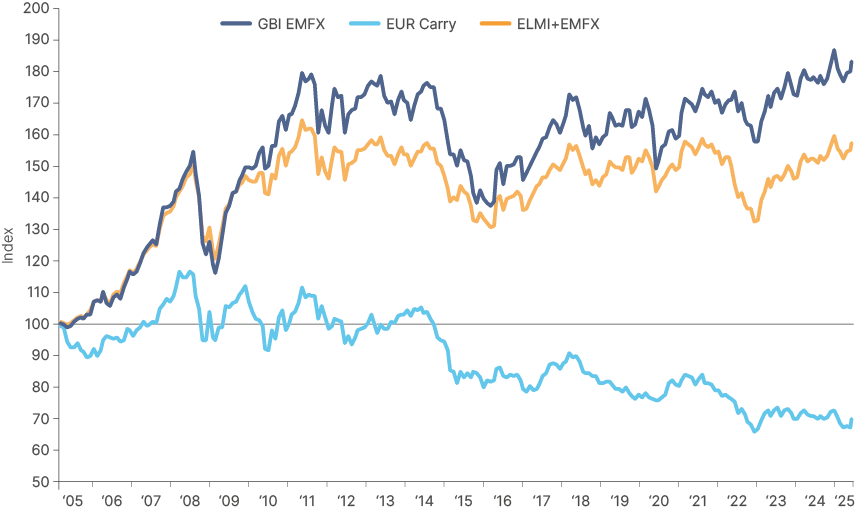
Fig 7 shows that, despite having a strong correlation, EM currencies have lagged the Euro, in nominal terms, over the last decade. However, positions in EUR had negative interest rates, leading to a very negative carry in EU assets. In carry-adjusted terms, EM currencies massively outperformed the EUR, as per Fig 8.
Fig 7: EMFX vs. EUR Nominal
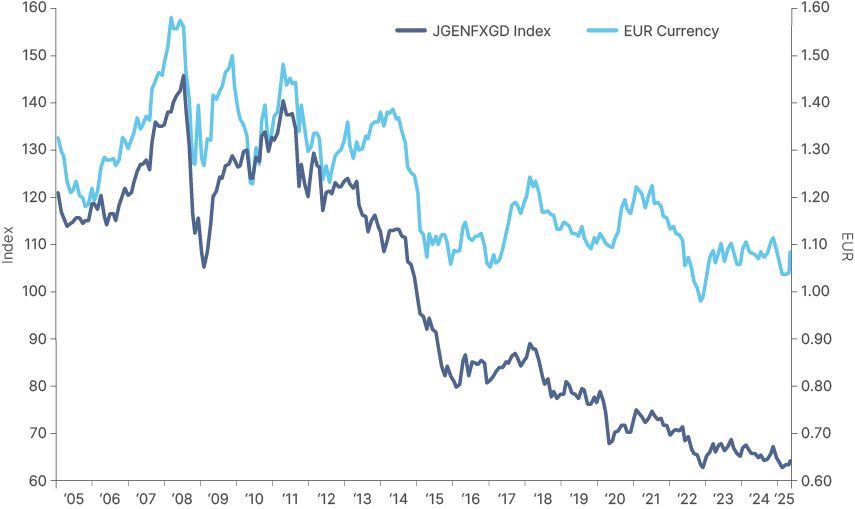
Fig 8: EMFX vs. EUR: Adjusted for Carry
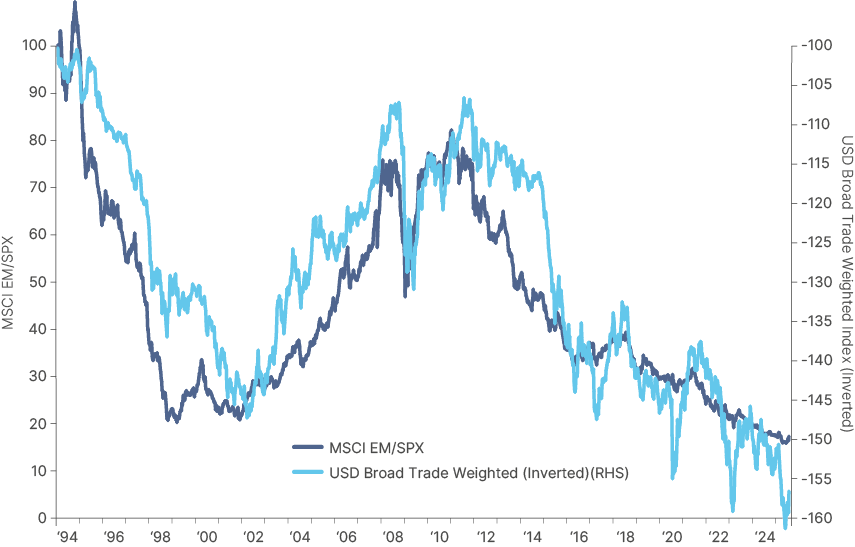
The end of US exceptionalism trade has a long way to run. Higher capital flows and capex supports GDP growth in EM, which supports higher capital flows – a virtuous cycle. In our view, this dynamic will likely support a multi-year outperformance of EM stocks per Fig 9
Fig 9: Relative stock market returns MSCI EM to S&P 500 vs. US Dollar
d. EM Asset allocation: Equities vs. debt
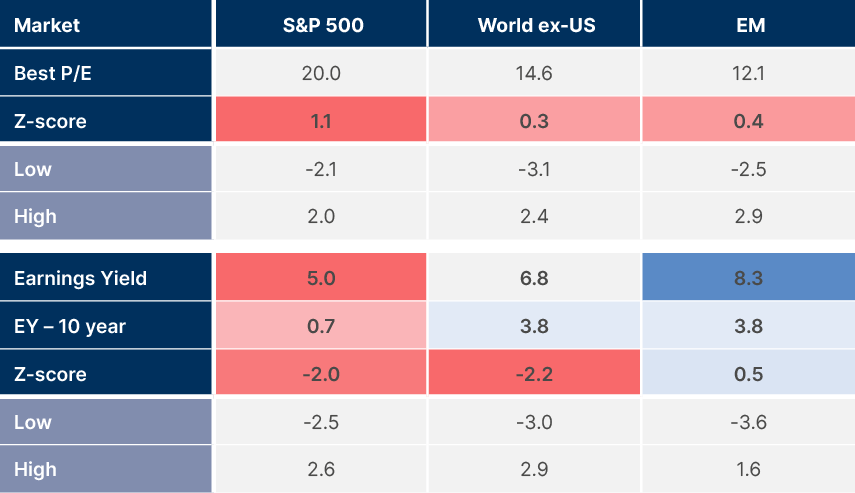
Despite the correction in US stocks, their valuation is still one standard deviation expensive historically. It remains two standards deviation expensive versus US Treasuries, as per Fig 10. DM ex-US and EM equities offer a much higher earnings yields, yet relative to their 20-year history, EM equities are 0.5 standard deviation cheap to bonds.
Fig 10: Price-to-earnings ratio; earnings yield; and dividend yield: S&P 500; World ex-US; EM
e. EM debt
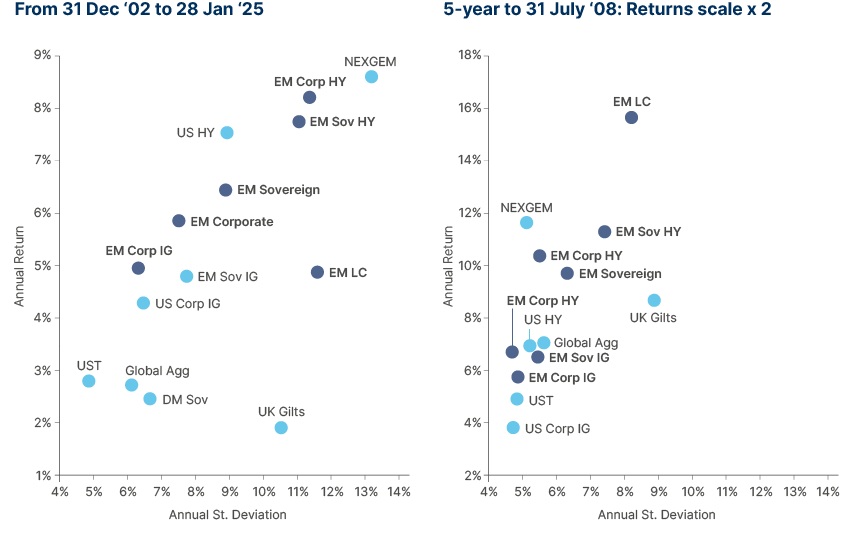
History suggests EM debt also stands to benefit significantly from a weaker Dollar environment. Figs 11 and 12 show that all EM debt asset classes had higher returns and lower volatility in the five years up to July 2008, a period when the US Dollar was weakening amidst higher economic growth. The asset class that benefits the most in this backdrop is EM local currency bonds, which had returns 3x higher than its historical average with c. 50% less volatility during this period. Nevertheless, all dollar-denominated EM benchmarks moved to the top left quadrant of the efficient frontier when the Dollar was weakening.
Fig 11 & 12: EM Debt Efficient Frontier (longest available vs. 5-year up to July 2008)
The fiscal stimulus and economic reforms from Europe, US, and many frontier market (FM) economies suggest we may be entering another similar period, where GDP growth accelerates amidst a weaker Dollar environment. Of course, in the short term, tariffs and expenditure cuts in the US risk a slowdown that could spill over to other economies. However, within a medium-term time horizon (6-18 months) the ‘government reprivatisation’ and deregulation agenda is likely to have a very positive effect on economic activity.
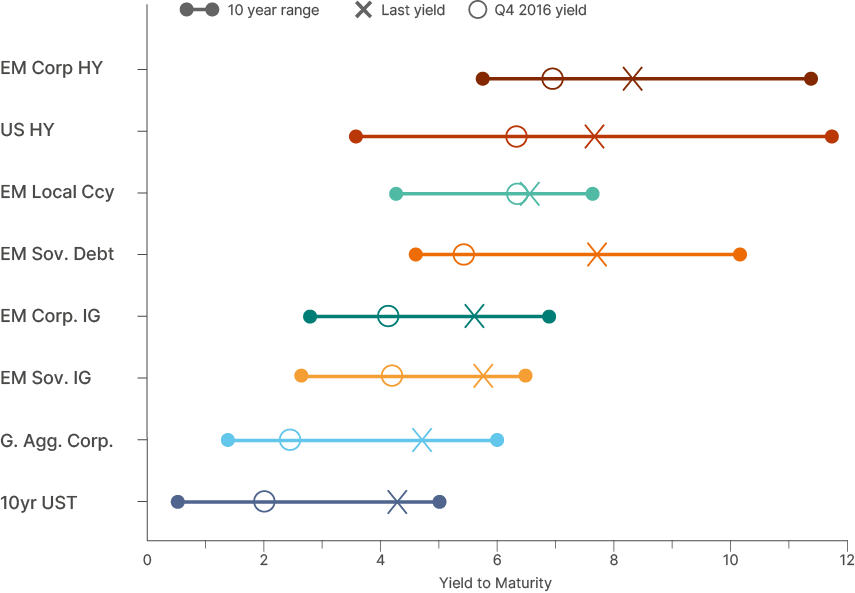
The fact that all EM debt asset classes trade at a wider yield-to-maturity to global and US indices (Fig 13) suggests there is room for compression, particularly considering the lower debt/GDP and debt/EBITDA ratios of EM credit indices compared to DM countries.
Fig 13: Yield to Maturity of selected EM and DM debt benchmarks
4. Risks
a. EU nominal rates rise more than nominal GDP growth.
- This risk is particularly acute for Italy and France, as both have a high debt burden.
- But in our view, the fiscal expansion in Germany will drive nominal GDP growth in these countries higher by a larger extent than the increase in their interest costs.
b. EU periphery (and French) spreads widen too much vs. core.
- The widening of periphery countries’ spreads alongside German Bunds could lead nominal rates to increase faster than nominal GDP growth.
- Thus far, the increase in yield has been entirely driven by wider German Bunds as the yield differential between Germany to France, Spain, and Italy remained close to a 10-year low, as per Fig 14.
- Furthermore, the recent increase in EU bond yields has been modest vis-à-vis the potential increase in nominal GDP of the stimulus measures announced, in our view.
- Overall, yields are still reversing to their pre-2008 levels, as per Fig 15.
c. Fiscal spending doesn’t lift EU’s productivity, raising inflation.
- The key to mitigate such risk is implementing Mario Draghi’s reforms which are supportive of fewer labour market frictions and boosting efficiency.
- We think there is political consensus across most countries to approve structural reforms, thus, creating a favourable environment for the passage of a good number of items within the Draghi report.
d. Current US stock market correction morphing into a bear market and leading into a recession.
- This risk is directly related to poor US policy decisions. We still think large tariffs are a bargaining chip and expect manageable tariffs to stick with the objective of raising tax revenues. We estimate a 12% effective tariff rate to generate c. 0.8% GDP of tax revenues.
- Anything much higher would be stagflationary and could destabilise asset prices further.
- The other risks for a prolonging of the sell-off would be a significant drop in unemployment due to DOGE, a severe deterioration in the institutional rule of law, leading to a collapse in investments or geopolitical miscalculations.
- Compensating for this would be deregulation efforts and productivity gains form a smaller government.
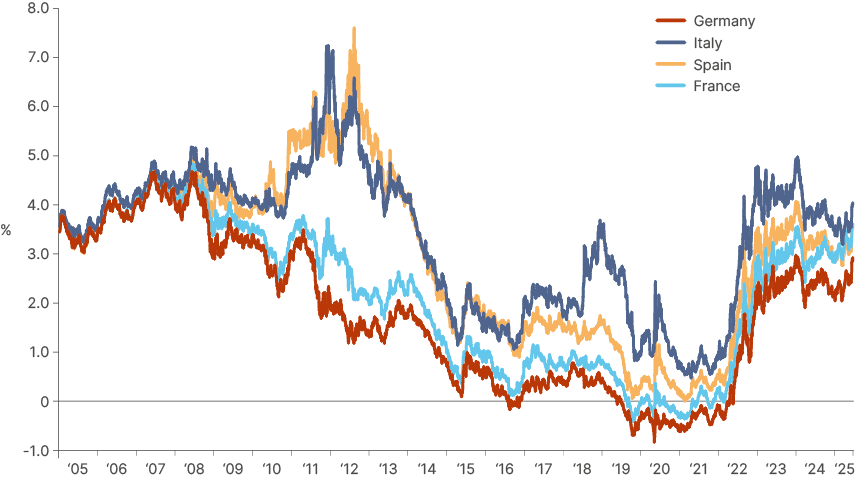
Fig 14: 10yr Government bond yields of largest EU countries
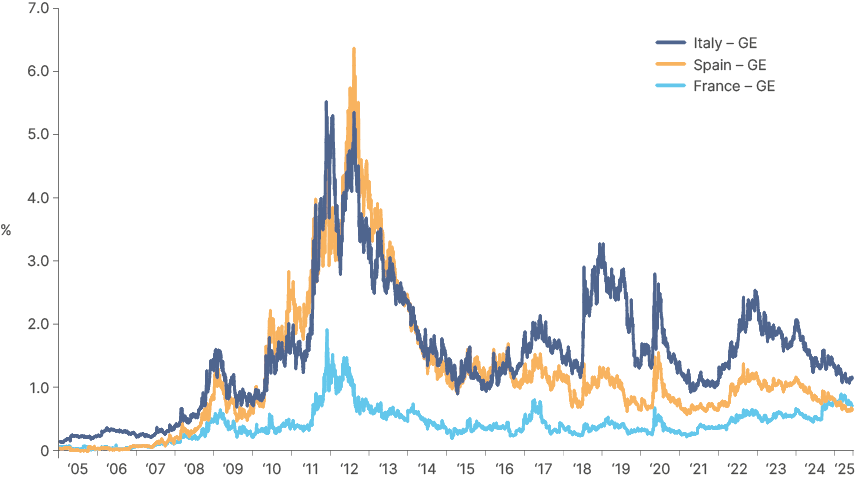
Fig 15: Spread over 10yr Bunds of Italy, Spain, and France
Conclusion
Trump’s brash approach to policymaking has ramped up uncertainty and volatility in markets. So far this year, US headlines have been largely negative with sticky inflation, tariffs and America-first geopolitics in the spotlight, rather than tax-cuts and the deregulation agenda. This has caught investors overexposed to the US off guard.
Yet the fiscal excesses of Trump 1.0 and the Biden administration could not continue unabated. Even if ‘The Magnificent Seven’2 do continue to dominate the tech world, as Scott Bessent correctly pointed out in a recent interview, there is no such thing as a one-way trade. A sell-off in overbought US assets and the dollar, and a recovery in undervalued global stocks was not a question of if, but of when, and perhaps more importantly, how.
The ‘how,’ this time, is big. German fiscal reform should not be viewed as part of a political cycle, but as a response to tectonic shifts in geopolitics. Executed alongside positive structural reforms, it can completely change Europe’s economy and lead to an extended period of Euro strength against the dollar. This backdrop will be very positive for emerging market assets, particularly at a time when China is likely to turn on the fiscal taps too, as part of their own long-term strategic plan.
As it turns out, there is no evidence that Vladimir Lenin ever actually said, “There are decades where nothing happens, then weeks where decades happen.” Nevertheless, these past few weeks have proved the adage true. If there was ever a time for investors to rethink their exposure to emerging market assets, it is surely now.
1. See – ‘The inconvenient truth behind US exceptionalism’, The Emerging View, 31 January, 2025.
2. Nvidia, Microsoft, Apple, Amazon, Google, Meta, Tesla.