
Short on time? Download the one-page summary.
Introduction
In our 2025 outlook, we highlighted that the balance of risk for US stock returns was tilted to the downside. In recent meetings, we have warned investors that positioning in US equities is very crowded and an early rotation to EM was warranted despite the risks of trade disruption.
We have also been highlighting our view that large US fiscal deficits since Trump’s 2017 tax cuts have been a core macro element behind the US exceptionalism.
This month’s Emerging View quantifies the magnitude of the fiscal stimulus, which turns out to be surprisingly close to the market capitalisation (market cap) surge over the past eight years.
US exceptionalism now has a disruption narrative with DeepSeek emerging as a serious potential threat to the hitherto near US-monopoly on Generative AI and its supply chain. The combination of a micro narrative (DeepSeek) with a macro driver (fiscal consolidation) should encourage investors to rotate away from US assets.
The narrative
Much ink has been spilled in recent years over the factors that make the US economy ‘exceptional’. Two are perhaps most important. First, the US remains the world’s dominant economic and military power, and therefore retains the reserve currency status. This gives it the ‘exorbitant privilege’ of low borrowing costs and a strong currency. The strong Dollar has been seen as a disadvantage by the US administration, but that’s another story.
America also remains the world’s most dynamic economy. Silicon Valley is the global epicentre of cutting-edge technological development, which has been increasingly monetised by a small number of US companies that use their sheer scale, M&A and other practices to build oligopolistic power in their respective sectors.
However, it is very hard to quantify how far these two factors explain US exceptionalism today, particularly because the US already had both characteristics 15-years ago when US stocks traded at much lower levels. Since then, valuations and earnings growth would tell you that the US has become much more exceptional. The market cap of MSCI ACWI has expanded from USD 30tn to USD 100tn, with the S&P 500 growing from USD 12tn to USD 54tn. This market cap moved from the equivalent of 35% of the MSCI ACWI to 55%. After MSCI adjustments for free float and other factors, the US represents 66.6% of the MSCI ACWI. What has changed? Is it possible to quantify this ‘extra’ exceptionalism (or some elements of it)?
Quantifying US exceptionalism
In macro terms, there were two sources of US growth over the past 15 years where America was exceptional. The boom in oil (and gas) production from 2012 to 2020, and the large pro-cyclical fiscal stimulus starting in Trump’s first administration and accelerating after the Tax Cuts and Jobs Act (TCJA):
1. Oil & Gas boom
Oil production increased by 142.5%, or the equivalent of 8 million barrels of oil per day, from 2010 to 2024. The fastest growth was between 2012 and 2016, when output rose by 15.5% per year. Growth slowed to 6.8% from 2016 to 2020, and then to 0.8% since 2020:
- Golden Era 2012-2016: +65% (15.5% CAGR)
- Post OPEC price war 2016-2020: +36% (6.8% CAGR)
- Post pandemic (2020-2024): + 4% (0.8% CAGR)
The energy production surge in 2012 to 2016 was a gamechanger for the US economy. Oil very quickly became cheaper. The lower cost of energy relative to the rest of the world, represented by the WTI vs Brent spread in Fig. 1, and the reduced exposure to imports were important determinants to US fundamental outperformance, in our view. This lower energy costs are even more important when looking at natural gas.
Fig 1: Crude Oil WTI vs. Brent
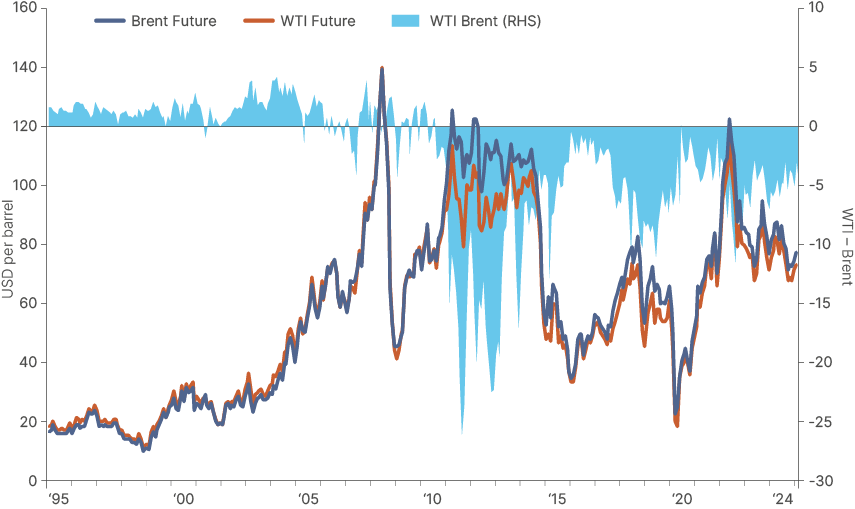
Simply multiplying the excess barrels produced since 2010 at average prices, adds up to USD 1.65trn, or an average of USD 118bn per year since 2011. These dollar numbers are meaningful, but remain tiny compared to the increase in the US stock market capitalisation.
2. Pro-cyclical fiscal deficits post TCJA
The 2010s oil boom was truly historic, but pales in comparison with the fiscal bonanza that began during Trump 1.0. The relationship between the unemployment rate and the fiscal deficit allows us to quantify the size of the ‘pro-cyclical’ largesse.
Keynesian economics suggests the US government should run a balanced budget with the economy at full employment and run deficits that are proportionate to the size of the increase in unemployment rate during a crisis. After all, as companies start losing money in an economic downturn, they will pay less, or no tax and also lay off workers, who then cease to become taxpayers and start claiming unemployment benefits. The government then needs to fill the gap. This linear relationship worked like a clock for more than 30 years, as shown by Fig 2 and Fig 3, until 2016.
Fig 2: US unemployment rate (inverted) vs. Fiscal deficit
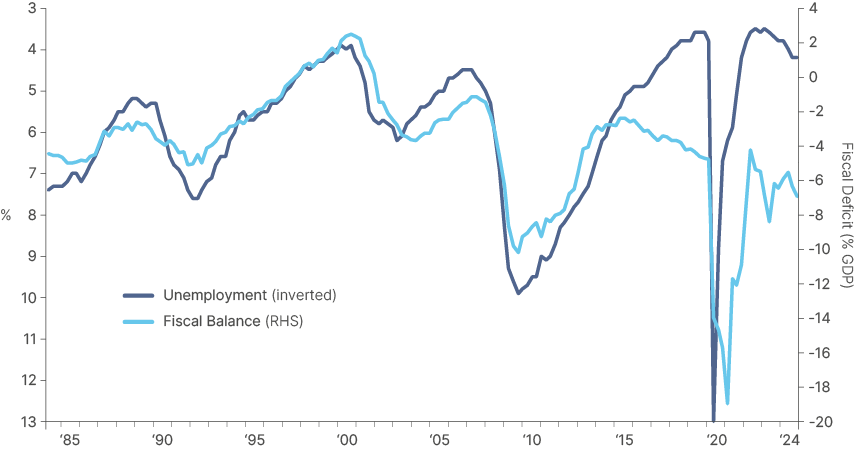
Fig 3: US unemployment rate vs. fiscal deficit: 1984-2016 vs. 2017-2024
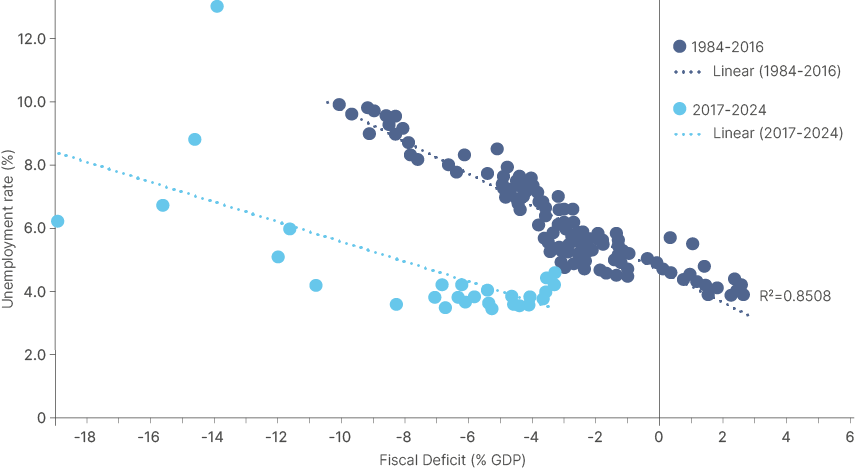
Fig 3 allows for a rough estimate of the size of the untethered government spending. If the relationship between unemployment and the fiscal deficit had remained in line with the 1984-2016 period, US fiscal deficits would have been 6.5% of GDP per year lower than observed over the past eight years, or 5.7% of GDP when excluding the Covid-19 period from Q2 2020 to Q2 2022.
Mind the (USD 13 trillion) gap
Multiplying these excess deficits by nominal GDP leaves us with c. USD 12.6trn gap of excess spending.
Although the competitive advantages and global influence of America’s best companies have expanded during this period, simple logic and macroeconomics says this gap has been the single main reason behind US exceptionalism. After all, the government deficits have been absorbed by both US companies’ bottom line (thanks to tax cuts and subsidies), and top line (pay cheques, infrastructure, tech stimulus). Household savings declined from pre-pandemic levels and little to none of this stimulus has flowed to companies outside of the US.
The same logic suggests that companies benefiting from oligopolistic market structures and competitive advantages, such as the Magnificent Seven (Mag. 7) would benefit the most from the fiscal largesse.
Two sides of the same coin: pro-cyclical deficits vs. US stock markets
The S&P 500 earnings per share (EPS) trendline also broke down post TCJA. From 1955 to 2016, the S&P 500 EPS increased by 6.3% per year. Interestingly, the EPS growth barely moved up from the 1955-1990 period to the more dynamic TMT-Internet era in 1990-2016.
Since the approval of the TCJA, EPS annual growth surged to 9.0%. This increase, alongside the lofty 25.5x price-to-earnings ratio, brought the market cap of S&P 500 companies to USD 53.8trn. Should the S&P have maintained the previous 60 years EPS trend growth up to 2016, the index would be trading at 4,615, assuming the same lofty multiple of 25.5x earnings, not the 6,101 levels at the end of last week, resulting in a theoretical market cap of USD 40.7trn without the TCJA. A more reasonable 20x multiple and the normal earnings growth would bring the S&P “fair value” to 3,615, some 40% below Friday’s close.
Remarkably, the market cap difference at a stable multiple – USD 13.1trn – is eerily close to the USD 12.6bn fiscal deficit largesse we have quantified.
Yes, it’s the fiscal, stupid!
One of the most common pushbacks we hear on this thesis is that the US companies driving much of the stock market exceptionalism have a large share of foreign sales. Rather than domestic factors, it is their expanding market share across the world that is driving their exceptional performance.
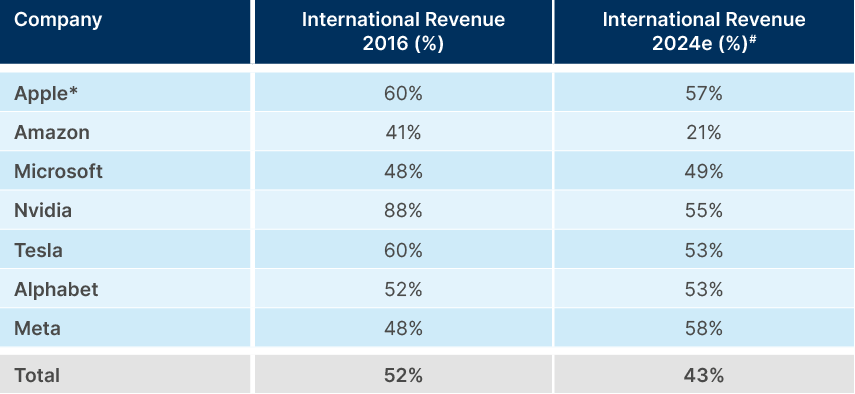
Yet, the data shows that the weighted average share of international revenue of the Mag. 7 has declined 9% to 43% since the fiscal largesse began. Since the US economy is growing at a slower pace than the developing world, and each company’s share of the domestic market is much larger, you should expect faster, not slower growth in foreign sales. What explains the gap is, again, likely to be the exceptional fiscal deficit.
Fig 4: Mag. 7 international revenue as % of total
Concentration, valuations, and bubbly signs
Several renowned investors, including Howard Marks and Warren Buffet, share our concerns about excessively concentrated markets, with the top eight companies in the US responsible for 49% of the Nasdaq.1 It is also well-known that these companies are trading on, historically, very elevated multiples, which raises the valuation of the entire index to levels rarely seen in the past (i.e., 2021, 2001 and 1929). The current narrative is that these companies are truly extraordinary and stand to monetise the most important technology trend ever, AI.
We’d caution and remind investors and readers that novel situations, market structures, and new technologies have been the key reason behind most major stock market bubbles in history. The Tulip Mania in Amsterdam’s 16th century, the twin perpetual motion machines built by of John Law (France) and John Blunt (UK) responsible for the Mississippi and South Sea bubbles respectively, and the more recent Dot-com bubble of the late 1990s.
Of course, this time round, there has been a tremendous boom in EPS from these companies. And such boom is now expected to increase, thanks to AI. However, as we have demonstrated, a good part of this boom is the other side of the coin of large fiscal stimulus. And within AI, we see some clear signs of George Soros’ reflexivity thesis behind NVIDIA shares. After all, the success of its graphics processing units (GPUs) and public excitement about AI has led to enormous demand for NVIDIA’s products. These products have a short life shelf before becoming obsolete to the new generation. Should these investments start delivering lower than extraordinary returns on equity, demand may well decline, a risk that is not priced at current multiples.
DeepSeek as a catalyst to portfolio rotation towards EM
Investors are so ‘all-in’ on US stocks and AI that the mere risk that DeepSeek may provide a serious threat to the NVIDIA-centred supply chains led to a strong increase in market volatility.
We believe AI adoption will accelerate even faster in a post-DeepSeek world, and it may well ultimately prove a positive for the overall AI supply chain.2 However, the large overweight positioning, excessive concentration, and elevated valuation levels across US stocks mean the DeepSeek news may warrant a larger portfolio rebalancing.
We note that on the first day the market focused on the importance of DeepSeek, the more traditional Dow Index was flat while the Nasdaq sold off 3.5%, led by a 16% drop in NVIDIA. On an intra-sector basis, healthcare, a sector that may benefit from faster AI adoption, rose 2.0% while IT declined 5.4%. Consumer staples, financials, and real estate were also marginally higher.
Think EM. Act now
We believe EM stands to benefit from this rotation, as investors begin to broaden exposure to different sectors, and different regions. Only two EM countries (Taiwan and Korea) have a higher weight of technology companies (IT + communications) in their stock index than the US. However, these countries’ technology stocks can still thrive even with a decline in NVIDIA’s hegemony. TSMC, the sole manufacturer of high-end NVIDIA chips, is likely to continue to benefit from higher adoption of AI, even if large language models (LLMs) and software developers can run their programmes with fewer GPUs and more second-tier chips. The sell-off in TSMC will give investors who can see the bigger picture an opportunity to add.
It is also notable that despite the protectionist measures taken by the US on AI, China has clearly continued to push on the frontier of technological development, just as it has done with electric cars and renewable energy infrastructure in recent years. The fact that DeepSeek and now AliBaba have developed native LLM’s is likely to bring back focus on opportunities in China, a country that has been avoided by global investors and asset allocators.
Furthermore, the share of technology in other Asian economies, as well as Latin America and CEEMEA is very small. Mexico, South Africa, Argentina, Brazil, Chile, Peru and Colombia all have less than 10% exposure to IT and communications in their indices. All these countries are rich in natural resources, trade at very attractive multiples, and several of them are likely to see favourable political transitions over the next years. Hence, if this rotation away from tech has more legs, US assets should underperform the rest of the world, particularly EM.3
Last September, we wrote about the themes that will drive the next bull market cycle in EM equities.4 The main factor disrupting this thesis has been the de-rating of EM stocks since Trump started to rise in the polls last summer. This means the valuation gap between EM to US stocks has widened further, making EM even more attractive.
The government giveth, and the government taketh away
In our view, the key catalyst for a rotation into EM equities remains on the macro level, the US has no room to keep expanding the fiscal deficits as it has done for the past eight years. For the US to retain its hegemonic currency position, it needs to be able to afford its military spending, which means a significant increase in productivity across the government and cutting fiscal deficits. Because fiscal expansion has played a crucial role in outsized US performance, any fiscal consolidation now would favour a rotation out of US stocks.
Given US interest rates are now high, and inflation remains unanchored, any additional fiscal expansion would be potentially disruptive. If the Federal Reserve (Fed) merely signal they may need to increase policy rates, it could very well lead to a much faster decline of US assets both in absolute terms and relative to the rest of the world.
The path to fiscal consolidation
We believe the US will start consolidating its fiscal deficit in 2025. There is a lot of (vague) analysis on the potential impact of import tariffs on currencies, inflation, and GDP growth. It is much simpler to calculate the impact of tariffs on tax revenues. A 12% nominal tariff increase, with a thoughtful distribution across sectors (i.e., intermediate and capital goods getting higher tax rates than consumer goods and food), would probably mean an effective tariff of around 8%, after substitutions. This would increase tax revenues by around USD 230bn per year, equivalent to 0.8% of GDP, a non-negligible consolidation.
Tariffs implemented thoughtfully would also lower the impact on both inflation and growth, making it possible to have a sustainable higher tax revenue. In a way, these tariffs would be equivalent to a consumer tax but levied primarily on companies that could absorb some of the costs alongside its supply chain, rather than directly on consumer goods. This fiscal consolidation path would clearly add pressure to companies’ profits against a backdrop of exuberant earnings growth expectations.
Conclusion
The extraordinary growth in US EPS has been propelled by large pro-cyclical fiscal deficits since the TCJA. A continuation of this trend is unlikely for several reasons. Not only have valuations and earnings growth expectations become very stretched, but there is no room for a further increase in fiscal deficits without a significant macro disruption via higher inflation and rates. Moreover, lowering fiscal deficits will make it very difficult for earnings and valuations to keep expanding at anything close to the pace of the last eight years. In this sense, the US stock market is now, as the saying goes, ‘between a rock and a hard place.’
Last week’s launch of DeepSeek provides a micro catalyst for investors that have overly stretched exposure to the US to rotate their portfolios. We believe EM stands to benefit the most from this trend. EM tech companies and chip manufacturers like TSMC are likely to benefit from broader AI adoption. Most other EM countries have significantly lower exposure to the technology sector, but benefit from powerful structural growth drivers, are rich in natural resources, and trade at compelling valuations versus history.
1. See – https://www.oaktreecapital.com/insights/memo/on-bubble-watch and https://finance.yahoo.com/news/warren-buffett-record-amount-cash-140019051.html
2. See – ‘DeepSeek impacts AI industry and EM', Weekly Investor Research, 27 January 2025.
3. See – CEEMEA = Central and Eastern Europe, Middle East, and Africa.
4. See – ‘A new bull market cycle in Emerging Market equities’, The Emerging View, 25 September 2024.