
Since its accession to the World Trade Organization (WTO) in 2001, China has posed formidable competition for other countries in the manufacturing sector. The country’s rapid ascent since the turn of the century has seen it emerge as the dominant force in global manufacturing supply chains. After initially focusing on low-value-added products, China’s industrial supremacy today is most evident in the production of advanced technologies such as renewable energy infrastructure.
However, as deteriorating diplomatic relations between China and the West raise concerns over supply chain security, the scale of China’s market share in renewables has prompted a wave of protectionism. Since 2021, the United States (US) has implemented a trifecta of unprecedentedly large industrial policies.1 Europe has implemented its own set of subsidies and protectionist measures in response. In our view, protectionist policies, tariffs and subsidies aiming at competing with China are inefficient. They will be expensive, and could ultimately lead to less productive industries both in the US and Europe.
The silver lining for Emerging Markets (EM) is that South-South trade in renewable energy products is accelerating. Already, importing cheap solar panels and wind turbines from China has allowed several EM countries to boost energy production and materially improve their energy mix. This trend holds promising implications: vulnerable EM nations like South Africa can expect a more resilient energy matrix, while countries with already robust energy matrices, such as Brazil, India, and Indonesia stand to reduce electricity costs, increase manufacturing competitiveness, and bolster productivity.
China dominates renewable energy infrastructure
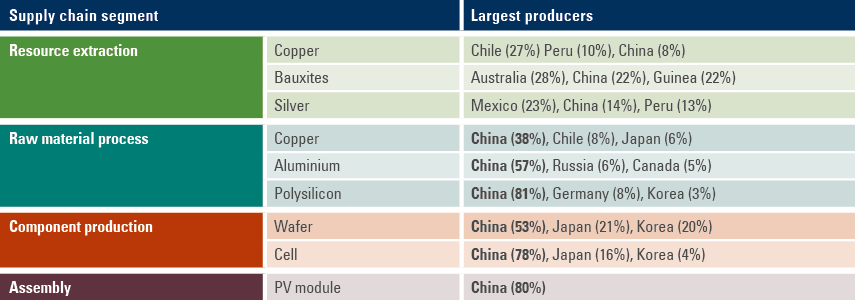
China leads the production of renewable energy technologies, with 70% of the combined global manufacturing capacity of solar panels, wind turbines and electric vehicles (EVs). The strength of China’s position is apparent along the value chain but is rooted in a dominant processing capacity for the critical minerals required to build this infrastructure. As per Fig 1, China’s geological reserves of many of these key metals are actually quite modest, but its corresponding output and processing capacity for them is disproportionately strong.
Fig 1: Solar panels supply chain
China’s prowess in commodity processing and its deeply integrated supply chains can be traced back to the initiation of the ‘Go Out’ policy in 1999, when the Chinese government began to encourage Chinese investments overseas. Chinese Foreign Direct Investment (FDI) rose from USD 3bn in 1991 to USD 35bn in 2003 and USD 92bn in 2007. This impetus was spearheaded by China’s large state-owned enterprises (SOEs), with the primary goal of securing a steady supply of the commodities necessary to power economic growth from mines across the world to large Chinese refineries for processing.
With cheap coal-powered energy, an ample supply of metals both from home and abroad, loose regulations and abundant cheap labour, China was able to quickly consolidate its competitive advantages across multiple manufacturing supply chains. However, a reliance on fossil fuels caused serious air pollution issues. In 2007, China surpassed the US in CO² emissions, with its GDP, at the time, just 25% of the size. Air quality in cities was becoming a grave health hazard, and acid rain was increasingly widespread. As a result, the Chinese government was compelled to begin investing heavily in research and development programmes for renewable energy technologies, and to then subsidise their subsequent production.
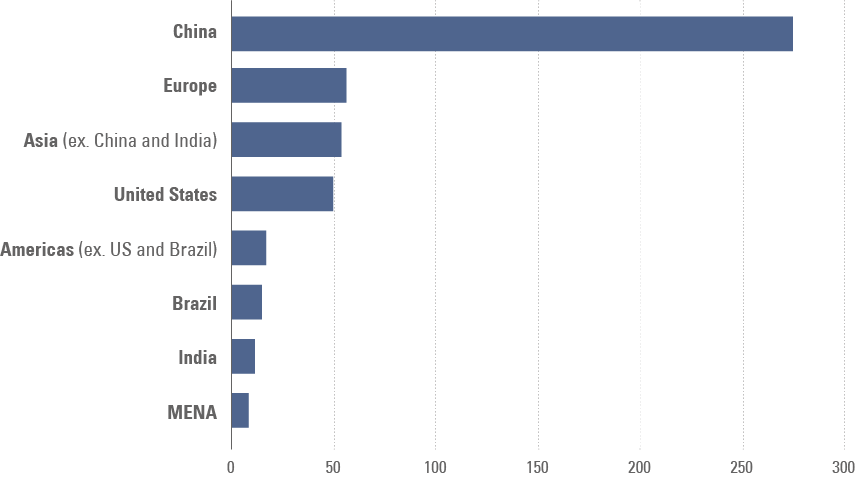
By 2014, China was investing at least USD 100bn annually into energy innovation and as of 2019, Chinese annual investment in clean energy has been at least twice that of the US. In 2022, China invested USD 274bn, roughly half of total global investments in renewable energy, marking the second straight year of 50+% growth in Chinese investments in the industry.
Fig 2: Investments in renewable energy in 2022, by region (USD bn)
When it comes to solar panels, the key inputs are copper, aluminium and polysilicon. China enjoys a healthy market share of global copper and aluminium production, but it is in polysilicon (high-purity silicon) where it holds a truly outsized influence. Polysilicon is the most crucial raw material in the solar photovoltaic (PV) supply chain, due to its superior efficiency in converting sunlight to electrons.
To make solar modules, polysilicon is melted at high temperatures to form ingots (cubes of the metal), which are then sliced finely into wafers and processed into solar cells. These solar cells are then attached to one another to make up the PV modules, the finished product. However, the isolation of polysilicon is a very expensive and energy-intensive process that requires burning quartz sand in electric arc furnaces at very high temperatures.
China’s advantage here lies in its uninhibited access to vast amounts of inexpensive industrial coal-derived electricity (the cheapest and most stable energy source before the rise of renewables). Moreover, China’s imposition of tariffs on polysilicon imports further bolstered local producers that already benefit from a natural cost advantage over international counterparts. Consequently, China’s market share in solar panel sales rose from 55% in 2010 to 84% in 2021.
China’s dominance, West’s problem
Have you seen their car? I think their focus is and rightly should be making sure they don’t die in China.
Chinese (electric) car companies are the most competitive car companies in the world. I think they will have significant success outside of China... frankly, I think if there are not trade barriers established, they will pretty much demolish most other car companies in the world.
Although China holds what approaches a monopoly position in PV production, its domestic market accounts for only 35% of international demand. PV panels are not just built en masse in China to decarbonise the domestic grid, but as a global export product geared towards the growing need for renewable energy worldwide. Solar exports from China have expanded at a 37% CAGR (compound annual growth rate) from 2017 to 2023.
But in a world increasingly fraught with geopolitical risk, relying on China as the sole supplier of a critical product is, for certain countries, no longer acceptable. This is most evident in the case of the US. In 2017, the US contributed 7% of China’s solar panel exports. However, with the onset of the Donald Trump administration in the same year, a 25% import tariff was levied on Chinese solar panels alongside various other products. Joe Biden maintained this rate when he took office and, by 2022, US PV imports from China had become negligible.
On the other side of the Atlantic, Europe still made up 33% of the demand for the product in 2023. However, in 2021, Europeans learned that entrusting energy security to a non-allied country is a risky strategy. After Russia invaded Ukraine, Vladimir Putin responded to Western sanctions by turning off the taps on the Nord Stream 1 pipeline, driving natural gas prices up 150%, and stoking a global inflation crisis. While European purchases of China’s PV panels continued to expand, growth slowed to 18% in 2023, markedly lower than the 116% average of the five years prior. Moreover, Europe is worried about the impact on its own auto industry of the scaling up of Chinese EV production. In 2023, the European Union (EU) launched an investigation into the Chinese EV market and the state subsidies that keep prices ‘artificially low’. Unable to compete in a pricing war with China, European manufacturers of solar panels are also struggling, as regulators weigh up whether to raise tariffs on Chinese PV imports to give local producers space to breathe.
Who wins in a tariff war?
To ‘de-risk’ renewable energy supply chains from China, both the US and now the EU have deemed it necessary to ramp up spending on their own clean energy programmes. The Inflation Reduction Act (IRA) of 2022 will direct more than USD 370bn to American renewables, largely via green tax credits, but also through grants and direct investments. Forced to respond, the European Commission presented its US 288bn ‘Green Deal Industrial Plan for the Net-Zero Age’ in February 2023. This will build on previous schemes to provide faster access to funding for renewable projects and loosen regulation on the industry. Both will also aim to develop reliable supply chains for critical minerals with commodity rich free trade partners, such as Chile, Morocco, and Korea.
Yet, boosting domestic industry through investment and subsidies and doing so by taxing imports are two different things. And while higher investment in renewable energy programs is essential, western nations may be facing a zero-sum game in implementing elevated tariffs on Chinese green infrastructure, in our view. While such measures may yield short-term benefits for local producers, they may delay progress in the renewable energy transition. In the longer term, there may be a balance to be struck between a total ‘decoupling’ from Chinese renewable supply chains, such as America is currently pursuing via subsidies and high import tariffs, and a lighter touch ‘de-risking,’ which may be the more thoughtful path for Europe. Dennis She, the Vice-President of Longi Green Energy Technology (20% global PV market share), recently argued against the aggressively protectionist US policies, saying that “solar is a gift from the gods... you have the panels from China, sunshine is your own sunshine.”2
In contrast, most EM countries are expected to remain agnostic to China’s dominant position in clean energy. Commodity-rich African nations benefit enormously from Chinese demand for their exports, as do Middle Eastern nations. China is South America’s top trading partner and a major source of both FDI and lending in energy and infrastructure, including through its Belt and Road Initiative.
In lieu of rejecting Chinese imports and subsidising domestic clean energy manufacturing, these economies should continue to take advantage of cheap, abundant Chinese supply. This is the smart strategy, in our view. Importing Chinese solar panels or wind turbines to generate electricity is not the same as relying on Russian gas. According to the Solar Energy Industries Association (SEIA), solar panels last between 20 and 30 years. The lifespan of a wind turbine is similar. So, whether on the Brazilian cerrado, the Sahara Desert or Australia, once the infrastructure is in place, it matters little whether it was built in China or domestically. It follows that countries indifferent to China’s geopolitical and economic sway can continue to capitalise on the availability of cheap products and greatly accelerate their energy transition efforts.
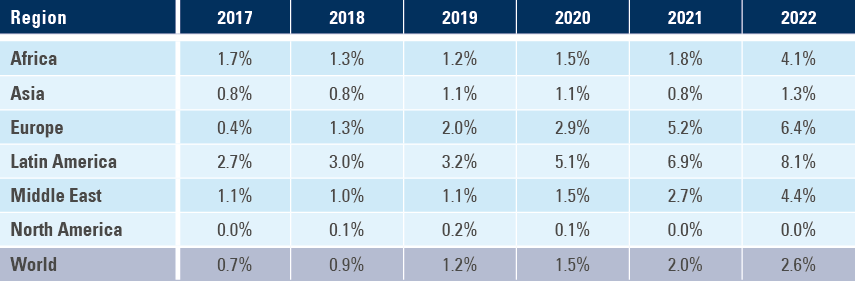
Already, the increase in Chinese solar panel exports to Latin America, the Middle East and Africa in the last three years is striking. Latin America, for example, imported 7% of its total power generation capacity in solar panels in 2021, and another 8% in 2022, as per Fig 3.
Fig 3: Solar panels imported from China in % of total power generation (PV-adjusted)
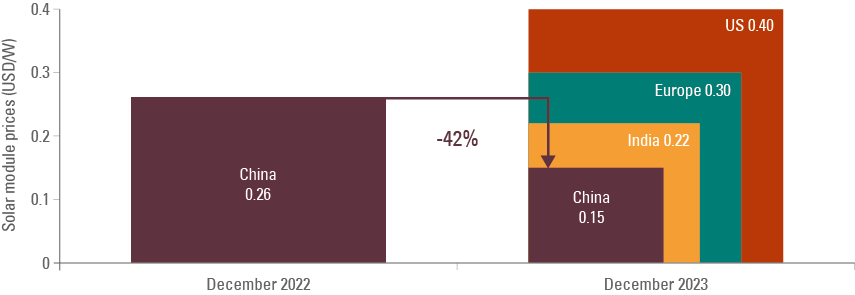
The rapid increase in renewable installation is less surprising when considering the dramatic reduction in its cost. In the last 10 years, the average global cost for solar energy has dropped 90%. China’s cost of producing solar panels has dropped 42% in the last year alone.
Fig 4: Solar module prices by manufacturing location
When it comes to solar energy, the developing world benefits significantly from its latitude. The potential to generate solar energy is based on the hours of exposure to sunlight and other factors such as land availability in different regions. According to data from The Global Solar Atlas,4 the “practical photovoltaic potential” of Latin America, Africa, and the Middle East is twice that of Europe. Put simply, in these sunny regions, power generation from solar panels is very effective. The result? Cheaper electricity, which can be a massive catalyst in increasing growth potential.
Thus, EM has two critical advantages in the race to get cheaper and more sustainable energy: an agnostic position in relation to acquiring energy infrastructure from the cheaper more efficient provider and a geography that multiplies the efficiency of the investment.
Foundations for the EM ex-China manufacturing renaissance
Traditionally, cost-effective manufacturing is reliant on five elements: cheap energy, competitive labour, infrastructure (logistics), location (near large consumer markets) and accommodative regulation. Yet, as global corporations increasingly prioritise the decarbonisation of their operations, the focus for new manufacturing capacity shifts towards achieving both cost efficiency and energy efficiency. According to a survey of analysts, globally, 60% of companies have already allocated sufficient investable capital to reach net zero by 2050.5
Thus, as deteriorating geopolitics drive the West to pursue diversification of supply chains away from China, alternative countries which can provide the traditional ingredients for competitive manufacturing, along with ample clean energy, are well positioned to capture substantial capital inflows over an extended period.
The main candidates
Considering the various elements of the ‘recipe’ for manufacturing success, a quantitative filter can help to identify countries that are primed to benefit most from what we believe could be a new growth era in EM ex-China manufacturing:
- Ease of Doing Business: Countries with an Ease of Doing Business score above 90.
- Minimum Wage/Labour Force: Countries with labour forces of 10 million and above, minimum wage below the global average of <USD 3 and median population age below 40.
- Industrial Electricity Price: The second key component in manufacturing costs. Countries with electricity costs below the world average (USD 0.13/KwH).
- Energy: Energy availability score (above 95) and where renewable generation is more than 10% of the energy matrix.
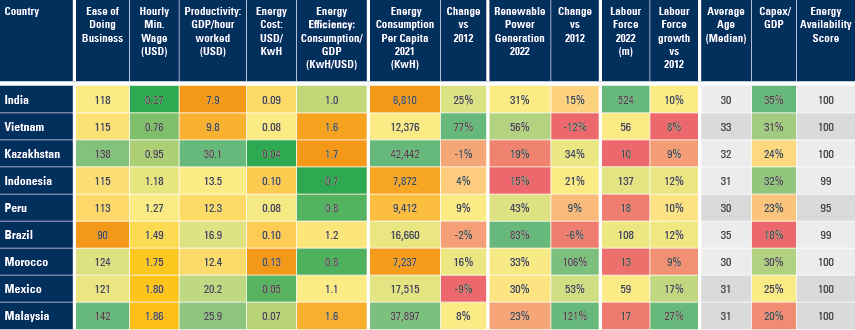
The filters above result in Fig 5, a list of countries primed to benefit most from the shifting sands of global trade. The table is sorted by a minimum wage in Dollars, for a sense of each country’s position, as it stands, on the manufacturing value chain and cost of production. The table also adds capital expenditure (capex) as a percentage of gross domestic product (GDP), a good metric to track countries where potential GDP growth is increasing because of higher investments. High capex to GDP is particularly powerful when focused on the manufacturing sector.
Fig 5: Countries with potential for a manufacturing renaissance
Malaysia
An advantageous location on the Straits of Malacca (a waterway connecting the Indian and Pacific Oceans) a business-savvy government and low energy costs have helped Malaysia become a competitive location for high value-add tech manufacturing.
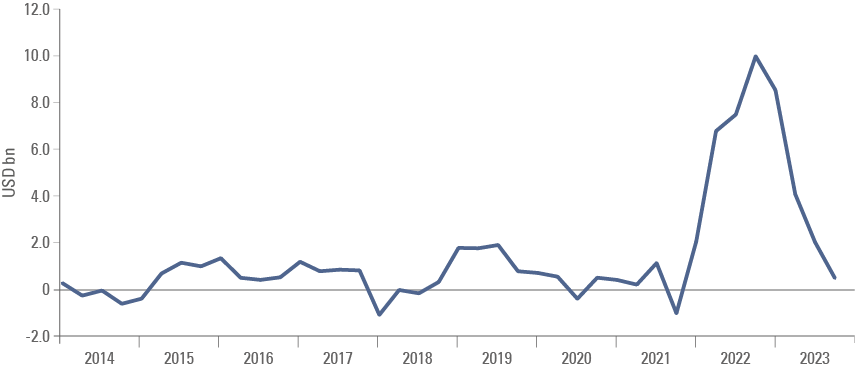
Capability in integrated circuit production makes Malaysia an attractive and potentially cheaper alternative to Taiwan for the diversification of supply chains from China, with a lower minimum wage (USD1.9/hr, vs USD5.8/hr). Nevertheless, the considerable spike in US FDI in 2021-2022 highlighted in Fig 6 is most likely related to the memory chip shortages in the auto sector during the pandemic, in our view, rather than reflecting a long-term trend. Furthermore, the government’s recent push to reduce its fiscal deficit via lower subsidies to fuel prices has brought a decline in confidence and GDP growth, which isn’t helped by Malaysia’s low share of renewables as percentage of its energy matrix. Furthermore, a weaker RMB and JPY have been leading to lower purchasing power for Malaysians too. For now, Malaysia’s potential remains largely untapped. An increase in cheap renewable energy generation capacity would go a long way to boost investments in the country, in our view.
Fig 6: FDI flows to Malaysia
Mexico
The darling of the US nearshoring story, Mexico surpassed China as the US’s main trade partner in 2021. Mexico’s geographic location, its low cost of labour as well as its free trade agreement with the US make it an ideal location to ‘nearshore’ the manufacturing of products for sale in the US market.
Due to a large increase in Chinese exports to Mexico corresponding with the increase in Mexican exports to the US shown in Fig 7, there is some scepticism as to what extent the ‘nearshoring’ trend in Mexico is so far driven by Chinese ‘rerouting’ to take advantage of the USMCA free trade agreement.6
Fig 7: Mexican exports to US vs Imports from China
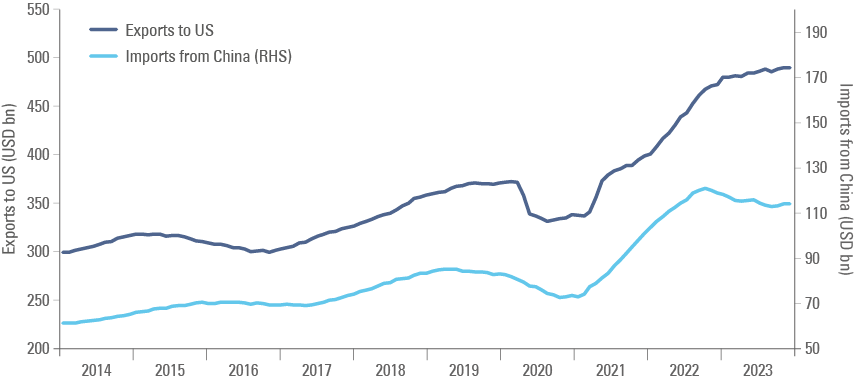
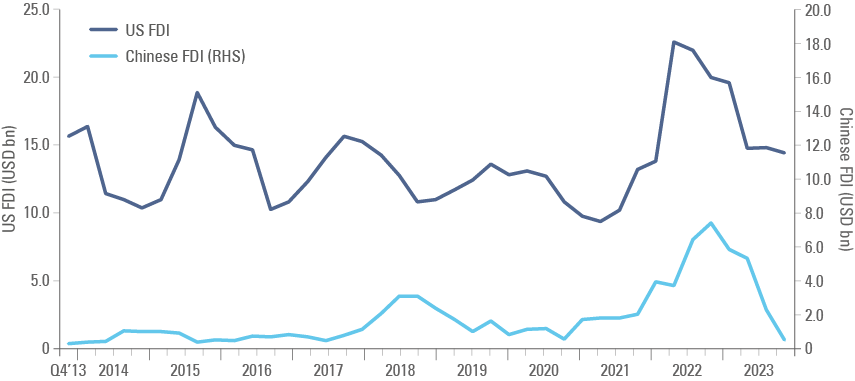
However, while both nations moved to increase their presence in Mexico between 2021 and 2023, US FDI dwarfs China’s, as per Fig 8. Returns on this investment are likely to translate into an increasingly robust current account surplus with the US that should outpace a widening trade deficit with China.
Fig 8: FDI flows to Mexico
Catalysts for further investment include improvement in Mexico’s road infrastructure, which has not developed at the same pace as its manufacturing capacity. Security concerns remain another real issue, with distrust over the rule of law in the country a problem for would-be investors.
Brazil
Of all EM countries, Brazil has embraced the importation of Chinese solar panels the most, building on an already impressive energy matrix. Brazil’s renewable energy sector accounts for around 83% of total electricity generation. Total Brazilian PV capacity surpassed 30GW in 2023. However, currently only 10GW of this, which represents 6% of Brazil’s total power generation, is online. Thus, a further improvement of the energy mix seems latent.7 Brazil’s National Electricity Agency (ANEEL) forecasts an increase of 10GW in 2024.8
Although Brazil boasts a large, affordable labour force, and an increasingly optimal energy matrix, manufacturing output has been in steep decline for the last 20 years. As a percentage of total merchandise exports, value-add manufacturing products have dropped from 60% in 2000 to just 20% in 2022.9 Brazil’s exports have remained robust, but became increasingly concentrated in commodities, namely soybeans, iron ore and oil. The manufacturing potential shown by our datasets indicates an opportunity for a turnaround, however. BYD, China’s (and the world’s) largest producer of EVs, began work on a new USD 620m manufacturing hub in the northern state of Bahia in 2023. The performance of its operation may provide a blueprint for others to follow.
Vietnam
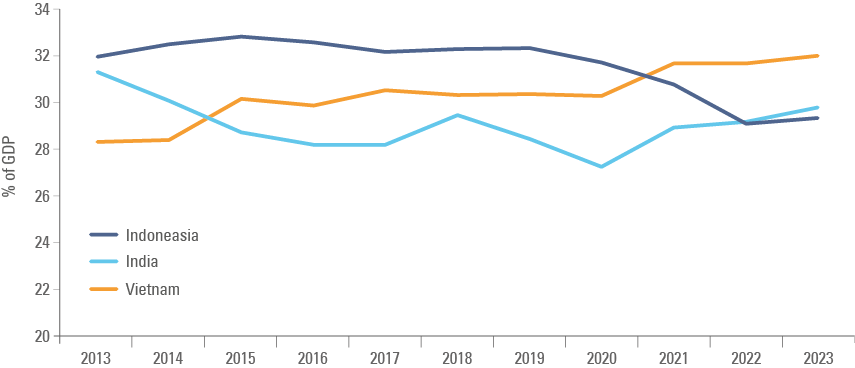
With cheap labour and energy costs and a US-friendly government, Vietnam has long been touted as a solid alternative to China for manufacturing. Capex as a percentage of GDP has risen steadily in recent years, as per Fig 9, and is one of the highest amongst EM peers, alongside Indonesia and India.
Fig 9: Vietnam, India, Indonesia Capex as % of GDP
However, a border and shared coastline with China also makes Vietnam a prime candidate for the ‘rerouting’ of tariffed Chinese items to Western markets. Vietnam’s two key exports, electronics, and textiles, both rely largely on Chinese components and raw materials. Moreover, while Vietnam has seen impressive growth in US exports, it is difficult to extricate this growth from a corresponding rise in Chinese imports, as per Fig 10.
Fig 10: Vietnam exports to US vs. Imports from China
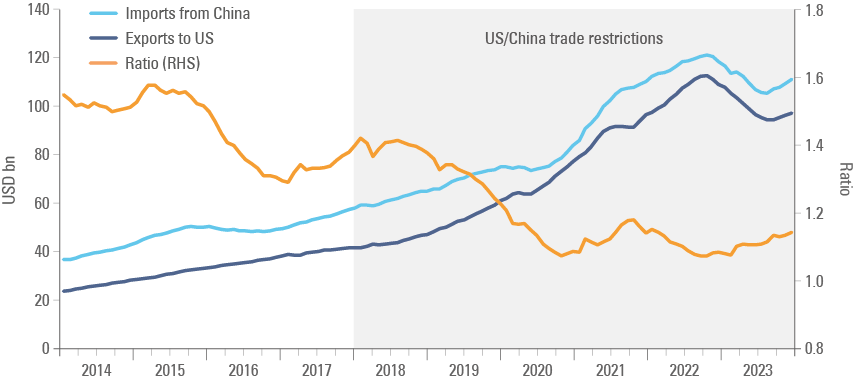
After America imposed trade restrictions on China at the start of 2018, the ratio of Chinese imports to US exports in Vietnam dropped quite sharply. This indicates a growth of independent trade to the US rather than a rerouting of Chinese imports. However, this ratio has started to increase again in the past year, suggesting the possibility of a stronger rerouting rather than nearshoring trend.
To maximise its potential as a nearshoring destination, Vietnam must improve productivity. Urbanisation rates in Vietnam remain low (38%), indicating a labour force that is still very agrarian. The government has recognised this and launched a national programme to reduce the number of workers in agriculture to below 20% by 2030, as well as increasing the contribution of technology to total factor productivity growth to 50% by the same year. Vietnam’s low wages are rising quickly, therefore adding value to the labour force will be necessary to remain competitive.
On the energy side, improvements in the energy matrix have stalled in recent years, due to a lack of transmission capability to meet new solar and wind energy capacity. Unleashing this extra renewable supply could be another factor in encouraging further nearshoring investment.
Indonesia
A major exporter of commodities, Indonesia has restricted the export of unrefined nickel, a key metal for the EV transition, and incentivised companies to manufacture batteries and vehicles domestically; a key catalyst for the surge in FDI depicted in Fig 11.
Fig 11: Annualised FDI in Indonesia by country

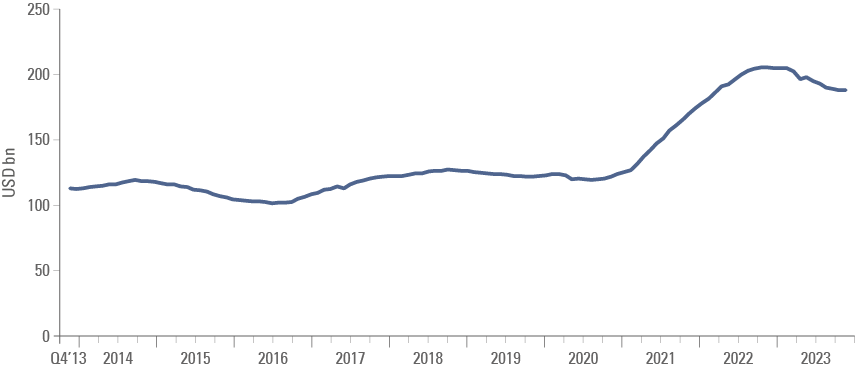
Furthermore, an abundance of other local raw materials, a dynamic demographic profile and a rapidly expanding consumer economy make Indonesia an attractive destination for broader manufacturing investment. Bucking the global trend, manufacturing purchasing managers’ indices (PMI) have remained in positive territory since September 2021, corresponding with a sharp increase in manufactured products, which nearly doubled in dollar terms since January 2021, as per Fig 12. Capex as a percentage of GDP reached 32% last year, one of the highest ratios in the EM universe, and a strong indication that the manufacturing output will continue to grow.
Fig 12: Exports of manufactured products in USD bn
India
Alongside Mexico and perhaps Vietnam, India is widely expected to be a key beneficiary of China de-risking by the West in the future. With the largest labour force in the world, and a median age of just 28 years, the demographic potential is certainly there to turn India into a global manufacturing powerhouse.
Some key challenges remain in place. For all its potential, India’s manufacturing sector has stagnated at 13% of GDP for the last four years. Various complexities, including a poor logistics system, have hampered India’s industrial competitiveness, despite cheap energy and labour. The current administration has set about changing this, however. According to the World Bank’s Logistics Performance Index, India climbed six places to rank 38th out of 139 countries in 2023, helped by targeted state investment in improving road and port networks and digitisation of the supply chains.
India’s low productivity reflects a manufacturing sector that is still predominantly low value-add. This is likely to change, in our view. Last year, capex in India reached 35% of GDP, the highest across EM. Policy measures from Modi’s administration have increasingly been targeted towards improving the export mix and demonstrate India’s capabilities. These include reducing corporate income tax from 30% to 22%, and a USD 24bn ‘Production Linked Incentive scheme’ aimed at encouraging the development of value-accreditive manufacturing, particularly in electronics.10
Morocco
Morocco’s geographical position, with both Atlantic and Mediterranean coastlines, is a key logistical advantage, making it a naturally attractive location for manufacturing. Major infrastructure investment has already taken place to capitalise on this. For example, the Tanger Med port, which opened in 2007 on the Strait of Gibraltar, is the largest port in Africa. Fitch highlighted the stability of Morocco’s macroeconomic outlook in its most recent review, affirming the country’s credit rating at BB+.
Morocco’s strength in location and logistics is bolstered by low labour costs, a young, well-educated population, and an energy matrix that is increasingly renewable. Morocco’s desert climate and windy coastline provide ample opportunity for effective renewable energy generation. The Moroccan government has set a target to increase the share of renewables in its energy matrix from around 20% today to over 50% by 2030. Furthermore, Morocco possesses 70% of the world’s phosphate reserves, a key ingredient in lower-cost EV batteries.
These favourable factors have served as tailwinds for a burgeoning high-tech manufacturing sector. A Chinese battery group, CNGR Advanced Material, announced a USD 2bn investment in a Moroccan plant in 2023. Renault, which has had a car plant in Tangier since 2012, has plans to move production of its hybrid car from Romania to Tangier in 2024.
This project reinforces Morocco’s industrial ambition to succeed in the transition towards electrification…as the most competitive automotive hub on a global scale.
From ‘Peak Globalisation’ to ‘Re-Globalisation’
Globalisation can be measured as the global sum of exports and imports as a share of GDP. Between 1965 and 2008, this figure grew from 25% to 60%, due to unprecedented international cooperation. Catalysts included the integration of the former Soviet Bloc in 1990 and the foundation of the WTO in 1995. As outlined in the introduction, China’s entrance to the WTO in 2001 pushed global trade to new heights, as corporations around the world outsourced various stages of manufacturing to the East.
However, after the global financial crisis in 2008, to quote an International Monetary Fund piece, ‘Globalisation’ turned to ‘Slowbalization’. Trade restrictions started to increase in 2008, most likely driven by the economic crisis and nascent populism. From 2016, rising geopolitical tensions led to weakening political support for open trade, and global exports stagnated as trade restrictions increased further. This trend was intensified by fears over the weaponisation of technology, as China pushed through the frontier of innovation. In 2018, a trade war between the US and China began over semiconductors, as the US put policies in place to stop the flow of advanced chips to China. As we entered the second decade of the century, the shock of a global pandemic followed by Russia’s invasion of Ukraine, and the sanctions that followed, further increased global trade disruptions.
As a result, the US started taking measures to re-shore manufacturing domestically, or ‘friend-shore’ supply chains to countries with less geopolitical risk. Some politicians, such as Donald Trump, ardently advocate reshoring, hoping to reignite domestic industry. However, due to expensive labour (and in some cases energy) costs in Developed Markets (DM), for manufactured prices to remain competitive, large parts of the supply chain will have to be redistributed from China to other EM nations, where labour, energy and land are cheaper. However, China ‘de-risking’ by the West is also motivating a large increase in EM-to-EM trade. The next stages of trade development will have a significant impact on the thesis for an EM manufacturing renaissance.
Intra-EM trade powering global trade
In 2017, we published a piece that challenged the outdated perception that EM prosperity hinged on the demand for their commodities by a narrow selection of DM economies. Back then, Intra-EM trade accounted for 41% of total EM trade and 15% of global trade. We observed that ‘gravity effects’, the tendency to trade with immediate neighbours, are naturally strong in EM, but cross-continental EM trade flows were also increasing quite rapidly. Today, this trend is more pronounced. The UN estimates that South-South flows expanded to 28% of global trade in 2022. Brazilian imports of Chinese products nearly doubled between 2020 and 2022, rising from USD 35bn to USD 62bn. 12 13
This momentum is not just observable through trade numbers. Among EM leaders across the world, scepticism over the dollar-centric international order is growing. Lula has been very outspoken on the issue, quoted saying at a speech in Shanghai: “Every night I ask myself why all countries have to base their trade on the dollar”. Henceforth, he has sought to redirect Brazil’s foreign policy to a more neutral multilateralist stance.
Global trade has been surprisingly resilient in recent years. While it is now seeing a cyclical slowdown, rising ‘South-South’ and digital services trade are strong structural drivers.
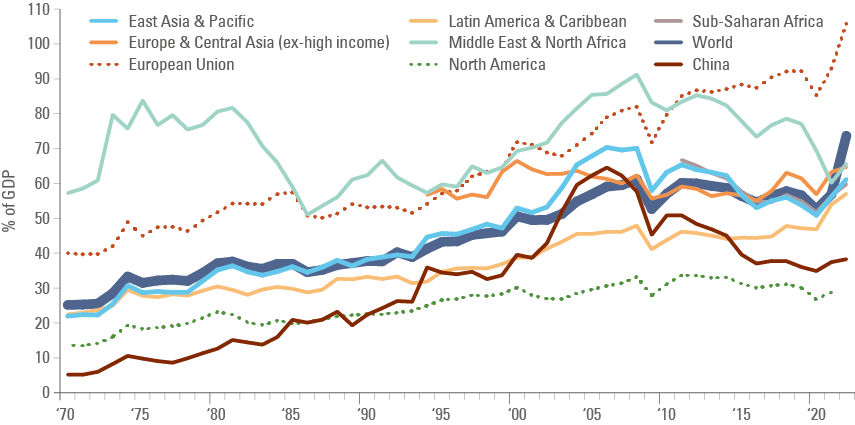
The World Bank shows global trade shot up to 73.6% of GDP in 2022 from 56.5% of GDP in 2019, after a slow decline that started in 2008 when global trade reached 61.1% of GDP, as per Fig 13. While inflation explains a large part of the increase, a significant rise in trade took place during the lockdowns, as Asia gained significant market share from the US and EU. It is also noteworthy that trade has increased in Latin America and Sub-Saharan Africa. Trade in East Asia and the Pacific has declined as a percentage of GDP, mostly due to a slowdown in Chinese trade. China’s trade surplus has been declining as a percentage of its own GDP but surging in USD terms.
Fig 13: Global trade as % of GDP
South-South powers ahead
An article by Andrew Mold for the Brookings Institute outlines a new approach to global trade classification,14 which leads to quite striking findings. The data shows that ‘non-rich’ to ‘non-rich’ countries trade surpassed ‘rich-rich’ trade around the Global Financial Crisis and continued to increase since, reaching 35% of total trade in, from 21% in 2005, while ‘rich to rich’ trade declined to 26% from 36%, over the same period. ‘Rich to non-rich’ was at 20%, and ‘non-rich to rich’ at 19% in 2022. The paper is based on data by Fouquin and Hugot (2016) that investigates the long-term trade data to explore the two waves of globalisation. The first in the Nineteenth Century and the second post-World War II. The difference between this data set and traditional databases from the UNCTAD is that the former fixes the ‘rich’ countries’ data as per their status in 1980.15
This helps to reduce some misclassification issues. For example, UNCTAD classified Russia, Eastern Europe, and South Korea as developed economies, while leaving richer economies such as Singapore and Hong Kong within EM. To the extent that Singapore and Hong Kong are intrinsically related to China and Southeast Asia trade flows, keeping the classification as per their status in 1980 is more sound, in our view.
Friendly (near)-shoring, or re-routing?
The nine months to September 2023 saw a net FDI outflow of USD 140bn from China, nearly 1% of GDP. To put this in perspective, only a decade ago China was receiving annual net FDI inflows of nearly 2% of GDP.16 Although these numbers are quite dramatic it would be naïve to assume that the outflow from China represents its direct extrication from supply chains. Instead, trade data suggests several Chinese companies are circumventing import tariffs on their goods by relocating manufacturing capacity to more geopolitically neutral locations.
Mexico overtook China as the biggest trading partner of the US in 2023, but in the last three years, nine Chinese car companies have built factories in Mexico, hoping to capitalise on its free trade agreement. In 2018, Vietnam’s imports from China made up 25% of the total. Today, they make up closer to 35%, an increase that, as we have outlined, is probably correlated to Vietnam’s increase in US exports rising from 20% to 30% of the total over the same period.
But the key difference between nearshoring and rerouting for the country in question is value-add. Nearshoring implies the construction of new factories and the creation of skilled jobs. Rerouting, on the other hand, is a much cheaper process involving something closer to repackaging, rather than building. Export data does little to indicate one or the other. However, FDI flows can be used as a bellwether to tell the difference, in our view.
Summary and Conclusion
The era of China as the untouchable epicentre of global manufacturing seems to be coming to an end. Last year, China reported its lowest inflow of FDI since 1993, and if the geopolitical tensions that are driving protectionist policies persist, it is unlikely that China de-risking trends will subside.
Within this backdrop, the redirection of capital towards other competitive EMs can provide a powerful boost to their growth potential in the long term. However, this shift in Western investment is just one of three ways that EM ex-China will benefit from supply chain diversification. In our view, China will continue to respond to Western protectionist policies and friend-shoring by re-routing their own downstream supply chains via geopolitically agnostic countries. Additionally, an increase in South-South trade presents another long-term trend that is likely to benefit EM manufacturing, as global consumer demand shifts further away from a Western-centric model.
As outlined, countries with favourable manufacturing conditions are already benefitting from these developments. But for long term, sustainable manufacturing success, possessing a low-cost renewable energy matrix will be crucial, in our view. Already EM countries are enhancing their manufacturing competitiveness by taking advantage of a surplus of affordable green infrastructure.
Nearly a quarter of a century ago, China started its journey to dominate global manufacturing supply chains. But as global trade dynamics shift, somewhat ironically, it may well be Chinese exports that create the conditions to transfer a large part of the supply chain offshore to other EM countries. The thesis for an EM ex-China manufacturing renaissance is far from speculation; rather, the data indicates that its foundations are already being established.
1. See – Infrastructure, Investment and Jobs Act (2021), CHIPS and Science Act (2022), Inflation Reduction Act (2021).
2. See – https://www.ft.com/content/ba27f8d3-df06-4e2a-96b7-a8bbc06632a2
3. See – Infers the electricity generation by country in terawatts using the ratio of global electricity generation in terawatts per hour versus total generation in terawatts.
4. See – https://globalsolaratlas.info/global-pv-potential-study
5. See – Source: Fidelity International ESG Analyst Survey 2023. See Question: “What proportion of your companies do you believe are allocating enough capex to achieve net zero by the following dates?”
6. See – https://www.ft.com/content/2ca4da83-f858-4215-88e7-544adf0aa18e
7. See – https://www.reuters.com/business/energy/brazil-set-widen-lead-cleanest-major-power-sector-maguire-2023-10-11/
8. See – https://www.gov.br/aneel/pt-br/assuntos/noticias/2024/aumento-da-oferta-de-geracao-em-2024-sera-de-10-1-gw-preve-aneel-1
9. See – https://data.worldbank.org/indicator/TX.VAL.MANF.ZS.UN?end=2022&locations=BR&start=1973
10. See – https://www.agbi.com/manufacturing/2023/03/renaults-hybrid-move-will-power-up-moroccos-ev-ambitions/
11. See – 'India takes centre stage', The Emerging View, 30 June 2023.
12. See – 'Intra-EM trade', The Emerging View, September 2017.
13. See – https://www.wto.org/english/news_e/news23_e/devel_23jun23_e.htm
14. See – https://www.brookings.edu/articles/why-south-south-trade-is-already-greater-than-north-north-trade-and-what-it-means-for-africa/ and https://unctad.org/publication/trade-and-development-report-2022 and https://ourworldindata.org/trade-and-globalization.
15. See – The rich countries are: Australia, Austria, Belgium, Canada, Cyprus, Denmark, Finland, France, Germany, Greece, Iceland, Ireland, Israel, Italy, Japan, Luxembourg, Netherlands, Norway, Portugal, Spain, Sweden, Switzerland, United Kingdom, United States. ‘Non-rich countries’ are all the other countries in the world for which data is available.
16. See – https://www.chathamhouse.org/2023/12/collapsing-foreign-direct-investment-might-not-be-all-bad-chinas-economy