
Over the last decade, South Korea has run a large current account surplus, yet watched its currency weaken to a 13-year low. The primary reason is simple: large capital outflows have overpowered the trade balance.
A paper from the Bank of Korea (BoK) published this month, documents the mechanics. We agree with the diagnosis but think it is missing important elements. The offshoring of Korean savings was not only an organic market response to demographic pressure – as laid out by the BoK – but the result of the Korean Composite Stock Price Index (KOSPI)’s chronic underperformance. The Won also softened due to policies modelled on Japan’s Abenomics-era pension fund reforms, with Japanese yen weakness itself anchoring the KRW lower.
The currency weakness produced winners and losers, and the distributional reality is now driving a policy reversal in both Tokyo and Seoul. The combination of peak US exceptionalism with structural reform of Korean capital markets sets up what we think will be the next major Korean – and broader emerging market (EM) equity bull market – comparable in magnitude to 1985-89 and 2002-07.
1. The Korean paradox: Successful exporters and weak KRW
The BoK’s April 2026 Issue Note documents a counterintuitive dynamic.1 The country has been running a widening current account (CA) surplus, of more than 6% GDP recently, while its real exchange rate has weakened. Intuitively, one would expect the opposite: a large CA surplus from competitive exporters should drive net inflows and lift the currency.
Fig 1: Korea CA surplus vs REER

The observed outcome, is in fact the expected result, albeit one that is often misrepresented or overlooked. Over the past 20 years, as global capital flows have expanded sharply, evidence suggests that the capital account, is more often the key determinant of currency dynamics, rather than the current account, which reflects external goods and services trade. Daily global FX turnover now runs at roughly USD 9.6trn, against around USD 35trn2 of annual world trade in goods and services. This means that at any given moment, the marginal price-setter in the FX market is overwhelmingly a portfolio manager or financial institution, not an exporter. This is particularly true for larger countries with deep capital markets, such as Korea. Trade flows are sticky and slow. Portfolio flows are faster and generally far larger on any given day – so they move the needle more at the margin. This can also be observed empirically.
In both developed markets (DM) and EM, CA-surplus currencies have often been weak for capital account reasons, including Japan for most of 2012-2024, and Taiwan more recently. If a wider current account surplus should be associated with a weaker currency, the opposite should also be true. In EM, there have been several episodes in which currencies strengthened alongside widening current account deficits as foreign investment inflows surged, only to reverse sharply when investors fled. Prime examples include Mexico in 1994, Thailand in 1997 and the ‘Fragile 5’ during the 2013 taper tantrum.3
a. Composition matters
The CA surplus plus currency weakness paradox often holds when private savings outflows are large enough to dominate the external dynamics. This became a reality recently in Korea.
Until around 2012, Korea’s large CA surplus was met primarily by BoK FX reserve accumulation. As exporters converted their USD receipts into KRW through the banking system, the BoK absorbed the dollars onto its own balance sheet. The operation was typically sterilised to manage the impact on domestic liquidity. The build-up of reserves also compressed Korea’s sovereign risk premium, keeping the currency fundamentals robust. The net result was a fairly valued KRW that would strengthen over time in line with its external surplus.
Now, the dynamic has shifted. Over the last 10 years, Korea’s external balance has shifted from a reserve-accumulation regime to a resident-portfolio-outflow regime, with the private sector now the dominant holder of Korea’s overseas assets (Fig 2). Private-sector portfolio investment, together with the National Pension Service (NPS), now holds more than 80% of the country’s external assets.
This has changed the structure of the capital account deficit. Incremental national savings are increasingly recycled through resident purchases of foreign assets (particularly US tech stocks), spread across retail investors, asset managers, corporates and the (NPS). When these outflows exceed the current account surplus, the won can weaken. The KRW has weakened in real terms since around 2015 even as the CA surplus has persisted.
Fig 2: Korean external assets composition: Public-to-private shift

Exporters holding profits offshore in US assets rather than repatriating money into KRW (a growing trend) keeps the currency weaker than its fundamentals. But the key mechanism weakening the KRW, in our view, is that domestic savers are running down KRW balances to acquire foreign assets in size. This is what is outweighing the inflows into KRW from the CA surplus. This dynamic can become reflexive in two ways.
Firstly, a weaker KRW driven by savers buying foreign assets boosts Korean export competitiveness, widening the CA surplus (and the capital account deficit further). Secondly, won weakness improves the won-translated returns on existing overseas holdings, validating the offshore allocation decision and encouraging further outflows.
b. Demographics & FX market
The BoK’s conclusion is that resident capital flows now matter as much as non-resident flows for FX stability. Indeed, it considers the structural demand for foreign savings to be the overwhelming factor explaining KRW weakness. The BoK attributed Korean investors’ behaviour to demographics: lower fertility rates mean higher disposable income and ageing population leads to higher savings that are invested abroad. It also suggests the FX market needs to deepen to absorb the volatility implied by this new reality.
While we applaud the BoK’s intention to deepen FX markets – particularly the reforms to include local markets on the World Government Bond Index – we believe there are a few more reasons behind ongoing KRW weakness that, crucially, are beginning to shift.
The inclusion of Korean bonds in the WGBI runs in eight equal monthly tranches from April through November 2026. Passive and active flows are estimated at USD 4-5bn per month. That alone delivers USD 32-40bn of KRW-buying over the next eight months – an offset to the resident outflows described above.
2. KOSPI underperformance
The origin of the problem, in our view, is related to Korean capital market structure and performance. Korean investors are highly educated and keen risk-takers, but the performance of the local capital market has been quite disappointing over the very long term. Fig 3 shows KOSPI performance, in USD terms, since 1981. There were two major rallies over the 45-year period: a whopping 888% from September 1985 to April 1989 (90% per year) and 513% from September 2001 to October 2007 (35% per year). Both coincided with major USD downturns following major USD peaks. Aside from these periods, however, the KOSPI has been a weak equity index. From 2007 to 2024, for example, it rose by only 19% (1% per year). From 1989 to 2024, it rose by 139%, less than 2.5% per year.
Fig 3: KOSPI performance in USD (log scale)
")
There are many factors behind this underperformance. The first is that Korean conglomerates operate through complex cross-shareholding webs and circular ownership structures that let families exercise control over and above their economic ownership. This creates conflicts of interest as transactions benefitting the controlling families can destroy value for minority shareholders. Before the July 2025 Commercial Act amendment, the fiduciary duties of Korean Directors were exclusive to the company, not to shareholders collectively.
Taxes are another problem. Inheritance tax is very high, approaching 60% when a controlling family’s shares in listed companies are transferred. This creates a contrary incentive to keep companies undervalued. Dividends are taxed at close to 50% at the recipient level, compared to zero capital gains tax on equity holdings below a threshold. Both create an incentive to keep valuations and dividends low.
3. Korea’s Abenomics play
Another crucial element for won weakness, in our view, was the NPS policy of diversifying away from local fixed income to foreign markets. This emulated the strategy of Japan’s Government Pension Investment Fund (GPIF), a key component of the ‘Abenomics’ policy mix aimed at reviving private sector growth and ending deflation in Japan.
The GPIF made its landmark shift in October 2014, cutting domestic bonds from 60% to 35% and doubling both domestic and foreign equity allocations. The government’s stated objective was liability matching for an ageing population, but the design had a clear implication. The GPIF would drive the Yen weaker in the context of zero or negative interest rates, generating imported inflation and supporting Japanese equities, which tend to benefit from a softer currency.
The NPS’s policies emulated the GPIF’s with a lag. The Korean 2018 Mid-term Asset Allocation Plan set the 50% foreign target by 2024. As the NPS has grown its allocation to foreign assets, private sector savers have done the same, both coinciding with the weakening of the KRW, as per Fig 4.
Fig 4: NPS allocations vs. GPIF’s and USDKRW

For both the NPS and private investors, greater foreign holdings have come at the expense of local asset holdings. The NPS allocation to local equities declined from 21.2% in 2020 to 11.5% in 2024. Over the same period, Korean retail investors gave up on local assets to invest heavily abroad. The combined outflows are substantial.
a. Investment outflows
The stock of NPS overseas equity grew from approximately KRW 113trn at end-2019 to KRW 432trn at end-2024, while overseas bonds rose from KRW 25trn to KRW 89trn. In USD terms, the overseas stock build was approximately USD 235bn. After removing the valuation uplift from global equity returns over the period, we estimate the net new flows from NPS into foreign assets was approximately USD 150bn over 2019-2024, or around USD 30bn per year. There was a meaningful spike in 2025 when the BoK separately cited a USD 40bn overseas equity outflow, more than 2% of GDP.
At the same time, Korean households’ US equity holdings hit USD 163.6bn at end-2025, up from roughly USD 8bn at end-2019. The stock figure overstates net flow to a larger extent as retail investors focused on tech stocks and the NASDAQ rose c. 350% over the period. Thus, cumulative net flows were close to USD 108bn between 2019-2025. Breaking this down year-by-year using the NASDAQ as the proxy for valuation, the net flow into US equities was approximately USD 19bn in 2020, USD 18bn in 2021, USD 7bn in 2022 (positive despite the NASDAQ falling 33%), USD 5bn in 2023, USD 25bn in 2024, and USD 29bn in 2025. Annualised retail flow averaged USD 15bn but was backloaded. The large outflows in 2024 and 2025 coincided with the period of maximum KOSPI underperformance, the widest Korea Discount4, and peak KRW weakness, as per Fig 5. Adding the additional ~USD 15bn per year flow into overseas ETFs, retail flows into non-Korean equities reached roughly USD 40bn per year by 2025.
Fig 5: Kospi vs. S&P 500: Price and Best P/E ratio

Altogether, we estimate private Korean capital outflow of around USD 330bn to USD 380bn from 2019-2024. NPS net foreign flows c. USD 150bn, retail to US tech c. USD 78bn and another c. USD 50bn to overseas ETFs, as corporate foreign direct investment (FDI) and asset managers contributed to another USD 50 to USD80bn.
b. Winners and losers from the engineered weakening
The Korean offshoring story is a development success: a sophisticated retail base operating as a global capital allocator. However, a weaker currency engineered through pension reform and resident capital outflows produced clear winners and losers. This is politically consequential for both Korea and Japan.
The winners are savers with foreign assets, predominantly the affluent and middle-aged retail investor base, plus institutional intermediaries. The NPS reported a record 15% return in 2024 and a probable 20% return in 2025 (not yet confirmed), solid performance for a major public pension. Korean exporters benefited from the weak currency, particularly in the autos, electronics and shipbuilding industries. Corporate treasuries with a high proportion of USD assets recorded valuation gains.
The losers were the rest of the Korean population. A weaker Won means imported inflation, and Korea imports the bulk of its energy, much of its food, and large quantities of consumer goods. Real disposable income was squeezed, particularly for younger workers without significant equity holdings, retirees on fixed income focused portfolios, and lower-income households. Real wage growth has lagged headline GDP growth across the 2014-2024 period. Housing affordability in Seoul became a generational issue. These factors may have compounded the demographics problem. Lower fertility rate is now a global phenomenon, and the high cost of raising children in cities is a key driver.
Japan went through a similar journey. The Yen lost roughly half its value in real terms between 2012 and 2024 against the Dollar. The GPIF, life insurers and retail investors all saw good returns in their offshore books. Japanese exporters’ margins expanded materially. But real wages in Japan stagnated for a decade, as the broader population experienced a steady erosion of purchasing power. The political consequences accumulated slowly until they became unavoidable as the Ishiba and Takaichi governments struggled with the political reaction to this distributional outcome, despite rising wage inflation. This has also contributed to the Bank of Japan (BoJ) push to normalise its interest rate policy.
This political economy point is the key missing link in the BoK paper. The pension fund was deployed as a macro instrument to weaken the currency, which did not produce welfare gains for the median citizen. It transferred wealth from consumption-heavy household balance sheets to the asset-heavy balance sheets of savers, exporters, and the pension fund itself. In Japan, that transfer ran for 12 years before the politics caught up. In Korea, the cycle has been compressed. The offshoring of private assets began after the global financial crisis, but accelerated in the 2012-2015 period. The political response is visible in recent actions (see Section 5).
c. Japan: signs of a policy change
Japan’s experiment with engineered JPY weakness is approaching an inflection point, in our view. We see that there are at least three signals worth flagging.
First, monetary policy is normalising. The BoJ exited negative rates in March 2024, ended yield curve control in the same year, and raised rates further through 2025. BoJ Governor Kazuo Ueda has been explicit that the policy rate will continue to rise as the BoJ confirms wages and inflation are moving sustainably towards 2%. Market expectations of further BoJ tightening have re-priced materially, and the yield differential that anchored 12 years of Yen weakness is closing.
Second, wage and service inflation are becoming stickier. The 2024 and 2025 shunto wage rounds delivered the largest base wage increases in over three decades, and the 2026 negotiations appear to be extending that pattern. Service sector inflation has remained above 2%, despite goods inflation moderating, allowing the BoJ to continue raising rates.
Third, the political pressure on JPY weakness is clear. Successive governments since late 2024 have intervened (mostly verbally), against further Yen depreciation. The Takaichi administration’s policy framing has recently reprioritised real wage growth and household purchasing power over export competitiveness, a meaningful break from Abe-era priorities. The GPIF’s rebalancing pace has also slowed, with the foreign equity allocation now stable around 24-25% for years.
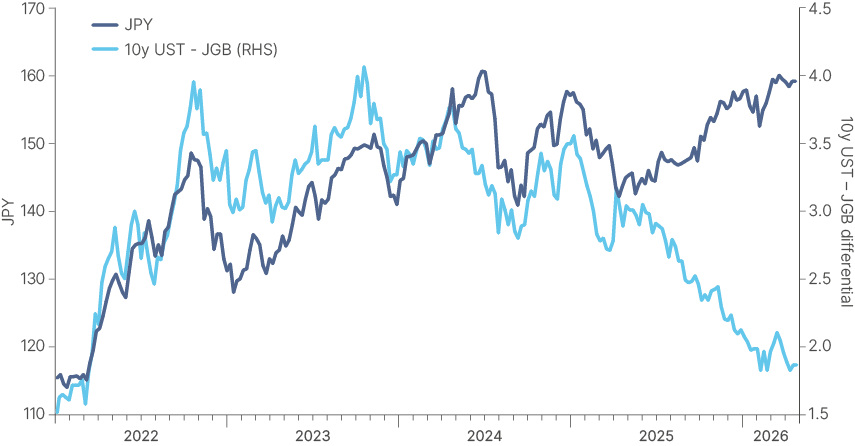
If the BoJ continues to normalise its policy rate, and with the US Federal Reserve expected to return to easing later in the year, the yield differential narrows further and the carry trade unwind continues. The Yen has scope to strengthen materially from current levels, in our view, with a 110-120 range achievable if the rate convergence keeps playing out, as per Fig 6. But if the policy adjustment isn’t enough to address the JPY undervaluation, the GPIF should, in our view, take advantage of the weak JPY and unwind some of its foreign currency position. This would likely have both a positive political impact for Japan and direct implications for Korea, as a stronger JPY anchor helps the Won to strengthen alongside it without damaging Korean export competitiveness.
Fig 6: USDJPY vs 10yr US-JP differentials: If it’s broken, fix it
4. Korea’s decisive policy pivot
Korean policymakers have moved faster than their Japanese counterparts. The NPS hedge ratio was redesigned, while on the capital markets side, the Value-Up plus Commercial Act reforms are now in full effect.
a. NPS hedge ratio: from 10% ceiling to a 15% floor
Until last year, NPS hedging was capped at 10% and was only executed if the KRW deviated meaningfully from its 20-year long-term average. This strategy seemed to be predictable, and thus easily anticipated by investors and FX dealers.
However, in December 2025 the government made the framework more flexible, after BoK Governor Rhee Chang-yong explicitly criticised the predictability of the old formula and pushed for “strategic ambiguity”. The NPS-BOK USD 65bn FX swap line was extended through end-2026, allowing for FX hedging to be implemented at a faster pace. Most recently, on 14 April, the NPS committee approved raising the strategic FX hedging ratio from 10% to 15%. Importantly, the strategic hedge target became a floor, not a ceiling.
The market consensus believes less than 5% of foreign assets are hedged, with the likely trajectory as 20% within 12-18 months, with 25%-30% achievable if KRW tests 1,550-1,600. Through 2030, with NPS foreign assets targeted at roughly KRW 900trn under the 55% allocation plan, a 25-30% strategic hedge implies USD 160-190bn of outstanding forward USD sales.
Furthermore, the H2 2026 adoption of currency-neutral performance assessment is as important as the ratio increase, as it incorporates hedging into reported returns relaxing political constraints on further increases of derivative exposure. The signalling effect on Korean insurers and asset managers that use NPS as an implicit hedging benchmark may lead to industry-wide flow of 2-3x the NPS mechanical impact. The asymmetric design has positive tailwinds in a weak Dollar regime.
b. Capital markets reform: Value-Up and the Commercial Act
Korea’s reform package addresses the originating cause of the offshoring: the structural KOSPI discount. The pace has been extraordinary. Three Commercial Act amendments in seven months is unusual in any EM country, but particularly for Korea:
The first amendment was approved in July 2025, and expanded directors’ fiduciary duties from “the company” alone to “the company and its shareholders”. This is easily the most important corporate law change in decades, designed to eliminate conflicts of interest between shareholders. The second amendment passed in August 2025 mandated cumulative voting for companies with assets over KRW 2trn, expanded separate election of audit committee members, and codified the Business Judgment Rule as a counterbalance. The third amendment, still in the legislative process, will require treasury share cancellation within one year of acquisition, addressing the practice of accumulating and holding treasury shares as a chaebol control mechanism, the single largest mechanical contributor to the Korea Discount, in our view.
Importantly, Korean corporate behaviour has changed ahead of the legislation. A total of 214 share cancellation announcements were made through August 2025 alone, nearly double the 109 of full-year 2023, and well above the 184 of full-year 2024. Samsung Electronics announced a KRW 10trn buyback for cancellation, Hyundai Motor a KRW 1trn buyback, and LG Corp cancelled 1.9% of its shares outright. Korean management teams are reading the direction of travel and adapting pre-emptively. The Value-Up Program has now been adopted by the majority of KOSPI 200 constituents.
The unfinished element of the agenda is tax. Inheritance tax reform has not passed, while dividend tax reform was approved only in a weakened form in Q4 2025. These are the two issues that most directly drive chaebol cash hoarding and dividend suppression. They remain the binding constraint on a more decisive return on equity (ROE) re-rating, and the Lee administration’s KOSPI 5,000 Special Committee is the political vehicle most likely to push them through over the next 12-18 months.
5. The memory supercycle
Korean memory semiconductors are in the early stages of a structural supply-demand imbalance, comparable in scale to the 1990s dynamic random-access memory (DRAM) boom. The mechanics are clear: AI infrastructure demand for high bandwidth memory (HBM) is rapidly siphoning wafer capacity away from commodity DRAM, producing simultaneous shortages and price increases across both segments.
Goldman Sachs forecasts a 4.9% DRAM undersupply in 2026, the worst in over 15 years, with server-related memory accounting for more than half of total demand. Bank of America forecasts global DRAM revenue up 51% and NAND flash memory up 45% yoy in 2026. SK Hynix’s Q1 2026 operating profit reached KRW 37.6trn (up 405% yoy) on a 72% operating margin. Samsung is projected to see its operating profit rise more than fivefold in 2026, with ROE reaching approximately 37%.
The duration of the cycle is why this time is different. SK Group Chairman Chey Tae-won has stated that the global wafer shortage is likely to persist through 2030. This is because capacity additions take years to commission, and the major manufacturers have already reallocated up to 40% of advanced wafer capacity to HBM.
HBM contracts are sold out through 2026 across suppliers, and HBM4 mass production has been accelerated to February 2026 to feed Nvidia’s Rubin platform. UBS estimates that the combined memory free cash flow over 2026-2027 will be larger than all the hyperscalers combined. Together, SK Hynix and Samsung represent more than 30% of KOSPI market cap, and these supercycle dynamics give Korean equities an earnings tailwind that no other major index currently has.
Fig 7: Korea & Korea ex-memory (Samsung, SK Hynix) Best P/E and EPS
 Best P/E and EPS")
6. The next Korean bull market
Putting these pieces together produces a coherent forward case. We have argued for some time that we have passed peak US exceptionalism. The DXY peaked in nominal terms in Q4 2022, and in real terms in January 2025. US equity returns have lagged ex-US DM and EM equity returns for some 18 months now. We have argued before that the fundamentals – including the US fiscal trajectory, term-premium reset, AI capex monetisation timing, and the broad rest-of-world rotation – point to a multi-year cycle of dollar weakness and US underperformance.
The two previously mentioned major KOSPI bull markets, both coincided with major Dollar downturns. The current environment is similar, with several important dynamics driving it:
- First, the structural reforms address the fundamental Korea Discount, not just the cyclical valuation cycle.
- Second, the memory semiconductor supercycle is driving an earnings cycle like no other, which could be likely to translate into a significant windfall for investors over the next two years. Korean outperformance has now been in place for nearly 12 months, and local investors are likely to be taking notice.
- Third, there is now a reflexive flow story working in Korea’s favour. The December 2025 tax incentive triggered a large expansion in repatriation account balances within a month. The April 2026 data show net selling of US stocks for the first time in years, with proceeds rotating into Samsung Electronics, SK Hynix, and KODEX 200 ETFs. NPS’s January 2026 decision to raise its 2026 domestic equity target from 13.9% to 14.9% is the first allocation increase in a decade. The multi-year mid-term plan now points to the domestic equity reduction trajectory being slowed, not accelerated. In short, the flows that drove KOSPI underperformance for a decade are reversing.
The risk-reward for Korean equities is therefore more favourable than at any point since 2007, in our view. Two-thirds of KOSPI still trades below book value. ROEs have started inflecting higher as buybacks compound and dividend payouts rise. The semiconductor cycle is likely to have legs for the rest of 2026 and into 2027. The KRW has scope to strengthen materially as the JPY anchor releases and the dollar weakens. NPS hedge flows add a structural KRW tailwind. And even a moderate repatriation from Korean retail investors could materially shift KOSPI flow dynamics, given how concentrated the offshore allocation had become.
The peak US exceptionalism thesis, if right, translates to an unusually clear setup for Korean equities. In Dollar terms, a 1985-89 magnitude move is ambitious, but after a 173% rally from December 2024 to April 2026, the 2002-07 template is possible, in our view. Compounding KRW strength with KOSPI re-rating could produce Dollar-denominated returns over the next five years that are several multiples of US large-cap, and a meaningful re-rating against MSCI EM. For Korean retail investors, the concentration in US tech that has been the right trade for the past five years is becoming the wrong trade. The institutional balance sheet that drove offshoring is being directed to reverse course. And the structural reforms that fix the Korea Discount are accelerating.
Summary and conclusion
Korea’s CA surplus alongside currency weakness is the result of an engineered offshoring strategy modelled on Japan’s GPIF reforms, deployed at scale through the NPS and amplified by retail investor behaviour. The strategy worked on its own terms: Korean exporters got a competitiveness boost, savers got dollar-denominated wealth, and the country accumulated a USD 2.9trn external balance sheet. But the distributional consequences were significant, and the political response in both Tokyo and Seoul is now driving a regime change.
Japan is normalising monetary policy, achieving wage growth, and accepting Yen strength. Korea is moving faster: the NPS hedge ratio architecture has been redesigned from ceiling to rising floor; the Value-Up Program and three Commercial Act amendments are addressing the Korea Discount at its legal foundations; and corporate behaviour has begun to anticipate the legislation rather than wait for it. Combined with peak US exceptionalism and US dollar weakness, the conditions are in place for what we expect to be the next major Korean equity bull market, comparable in magnitude to 2002-07.
For investors positioned in the Korean retail playbook of the past five years of being long US tech, long the dollar, we see this as an unusually decisive moment. The trade that has worked is being unwound by the institutions that built it, with explicit policy support, in coordination with a global rotation pointing in the same direction. The Korean retail balance sheet is heavily exposed to a regime that is ending, while the Korean equity market is heavily exposed to a regime that is beginning. The transition will not be linear, but for us, the direction is now clear.
1. See – https://www.bok.or.kr/fileSrc/eng/6b98bc17e98e431299874ace3f1e9a99/1/0737a193cc854d35a4e24cc24d330183.pdf
2. BIS Triennial Central Bank Survey, April 2025 (released September 2025).
3. Fragile 5: Türkiye, India, Indonesia, Brazil, and South Africa. What they had in common was a large CA deficit (north of 5% of GDP) financed by large inflows of capital to their bonds and equity markets.
4. The tendency for South Korean equities to trade at lower valuations than comparable companies in other developed markets