
The theme of our 2024 Outlook was a hit. Emerging market (EM) economies’ newfound resilience had more legs this year, despite a lacklustre performance from China.
The positive effects of post-pandemic structural reforms and fiscal discipline have been visible in the last two years’ economic data, with EM GDP growth consistently surprising to the upside. Economic fundamentals improving alongside credit metrics in most countries meant we saw far more sovereign credit rating upgrades than downgrades this year. We expect this trend to continue into 2025.
On the flip side, countries that neglected fiscal discipline and approved detrimental reforms – like Brazil and Mexico – struggled.
Macro Context
If elections across the world in 2024 brought the possibility of policy inflections, 2025 will be the year of their implementation. Election results in the largest EM countries were largely as expected, but there were two important surprises. In India, Narendra Modi’s Bharatiya Janata Party (BJP) lost their majority in Congress, while in Mexico, the Morena party got a supermajority. A more balanced parliament is positive for India, and a less balanced one has negatively impacted investor sentiment towards Mexico. South Africa moved to a coalition government, after a 30-year African National Congress (ANC) majority. This political shift will probably have very positive consequences for the country’s economy in 2025 and beyond.
In the United States (US) the election delivered, as we expected, the return of Donald Trump to the White House. It also delivered Republican control of both houses and a staunchly anti-establishment mandate. Now, the markets’ primary concern is what Trump can and will do with this mandate. The markets’ focus is most concentrated on trade tariffs. No one knows exactly by how much tariffs will be raised on China and the rest of the world, but whatever is decided will have very meaningful impacts on the global economy and EMs.
Geopolitics remain very relevant for global macro in 2025. The possibility of an earlier end to the Ukraine war, as well as to conflicts between Israel and Hamas, Hezbollah, the Houthis, and Iran has risen in Q4. Wars often end in ceasefire/armistice when new regimes or leaders come to power. From that perspective, the decimation of leadership within Hamas and Hezbollah, coupled with intense international mediation efforts, has increased the prospects for ceasefires.
While there was no change in power in Ukraine or Russia, the US election changed the picture here, as it is a key player in what is now an increasingly global conflict. Not only is NATO the main sponsor of Ukraine, but long-range NATO missiles are now being used by Ukraine to attack Russia. North Korean troops, as well as Yemeni and Nepalese mercenaries, are fighting for Putin, with China a key ally providing the tools and materials needed to build weapons and munitions. Therefore, a transition in power in the US, and a reset of its relationship with Europe, Russia, and China, could be pivotal and brings the possibility of an earlier settlement than if the Democrats stayed in the White House. Nevertheless, status quo or even escalation remain possible scenarios, and markets will continue to tread carefully in assets exposed to these conflicts.
Go active, focus on the long term
We believe in 2025 active managers should remain disciplined by their investment processes, hold a tactical beta stance and have a very selective approach to alpha generation. This disciplined approach is even more important until the worst of the trade uncertainties is over, and some clarity emerges about geopolitical risks. At the same time, long-term asset allocators are particularly well positioned to look through the back-and-forth on tariffs and take advantage of the investment opportunities that emerge from realignments in global trade. They should think about a big increase to EM assets, probably around Q2-2025 or at the peak of trade tensions.
Tariffs 2.0:
Who stands to lose the most?
Markets end 2024 and start next year with the assumption that Trump will drive an aggressive trade policy. As we write, Trump has threatened to increase tariffs on all goods imported from Mexico and Canada by 25% and from China by 10%, unless they take major steps to stop the fentanyl traffic into the US. The supply chain of the drug often begins in China before being processed in Mexico and then trafficked into the US. Should these tariffs be imposed, it would be a much more aggressive stance than the 2018-19 trade war against China, when different tariffs were levied across different products.
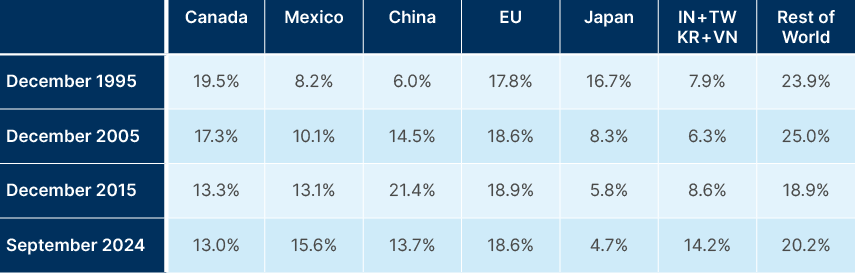
If Trump’s policy intention is to lower imports across the board, the focus will be on the largest exporters to the US. As per Fig 1, these are Mexico, Canada, Europe, China and the countries that have benefited from nearshoring after the first trade war, including Vietnam, India, Taiwan, Korea and Japan. Together, these countries make up 80% of all US imports.
Despite Trump’s talk, we find it hard to believe the US would work to destroy the North American supply chain by levying large indiscriminate tariffs against Mexico and Canada. It would simply be too painful to the American economy. It is also unclear whether those tariffs would be permissible in the context of the US-Mexico-Canada (USMCA) Trade Agreement. This leaves the other countries more vulnerable.
Fig 1: US % of imports by country/region
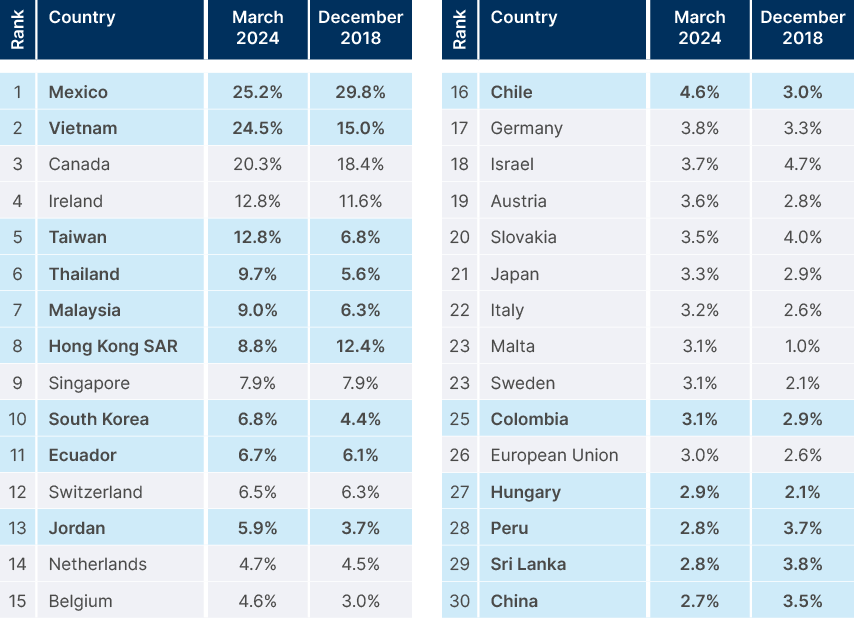
Countries that have large exports to the US as a percentage of their own economies will feel the effects of any US tariffs most keenly. Fig 2 shows that by this metric, Mexico, Vietnam, Canada, Taiwan, Thailand, Malaysia, Hong Kong, and Singapore stand to lose the most from a protectionist US. These countries’ US exports are equivalent to more than 7.5% of their respective GDP. It also shows that Mexico, China (and Hong Kong) have lower exposure to the US than during the 2018 trade war, while Vietnam, Taiwan, Thailand, Malaysia, Korea, and the European Union (EU) have higher exposure. Large numbers from Ireland, Switzerland, and the Netherlands are somewhat distorted as a significant portion of their ‘US exports’ is related to US-owned intellectual property.
Fig 2: Exports to US as % of GDP
What the market seems to be overlooking is that the asset class most at risk from potential tariffs could be US stocks. The S&P 500 is currently trading at the most elevated valuation levels since 2021 and 2001 and pricing in optimistic earnings growth that may not materialise if tariffs disrupt corporate supply chains. Furthermore, tariffs would likely be inflationary in the US, driving interest rates higher. This would disproportionately affect the all-important, high growth, high valuation tech stocks, by increasing the discount rate used to calculate the present value of their future cash flows.
While the global economy wouldn’t escape unscathed, the effects outside the US would likely manifest differently. For many Emerging Markets, particularly China, the impact of tariffs could be deflationary. This deflationary pressure would likely prompt significant policy easing by Chinese authorities, such as monetary stimulus or fiscal support, to cushion the economic blow. Such measures would provide a backstop to the fallout from tariffs and could help stabilise Chinese asset prices, which are already trading at attractive valuation levels. Given China’s central role in many Emerging Market economies, this policy easing would likely have positive spillover effects across EM, mitigating the broader damage from tariffs and creating a potential divergence in performance between overvalued US equities and undervalued EM assets.
Tariffs 2.0:
The origin and how to solve the imbalances
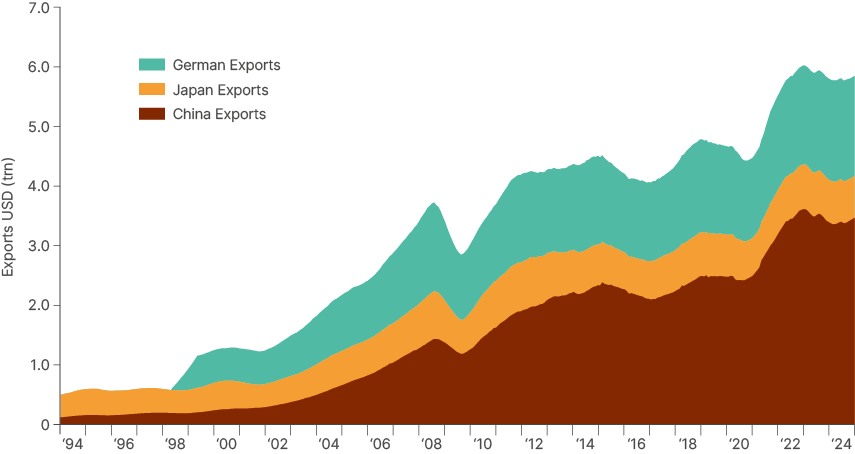
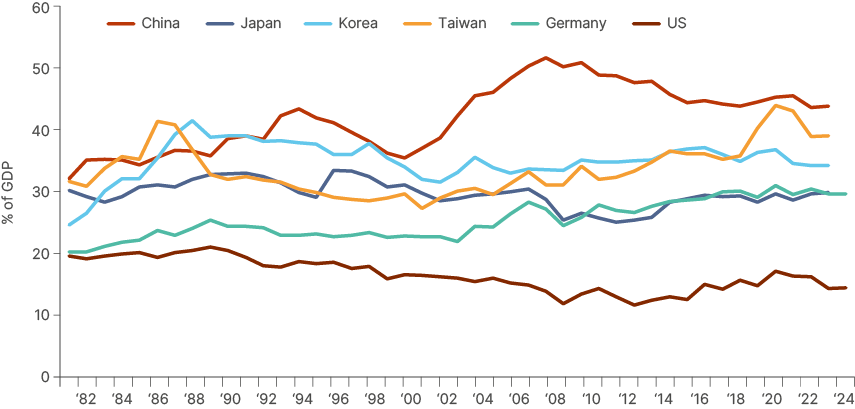
Trump’s protectionist impulse is clear to see. Along with Vice President-elect JD Vance and former trade representative Robert Lighthizer, he believes that the hollowing out of manufacturing jobs in America is a major societal problem. It is a centrepiece of their politics and undoubtedly won votes among communities with an industrial heritage. While this rhetoric often comes across as nostalgic, the data validates their concerns. US exports and industrial production have stagnated as imports have boomed in the last 25 years, as per Fig 3. The surge in US imports coincided with the surge in exports from China after its accession to the World Trade Organization (WTO), as well as exports from Germany, after the creation of the Euro gave it a super-competitive currency for its industrial prowess (Fig 4).
Fig 3: US exports and imports of non-petroleum products vs. industrial production
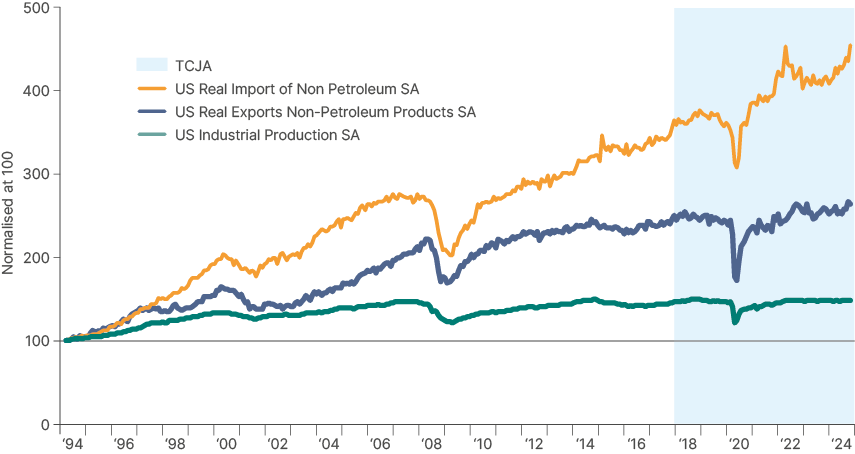
Fig 4: China, Japan, and Germany Exports
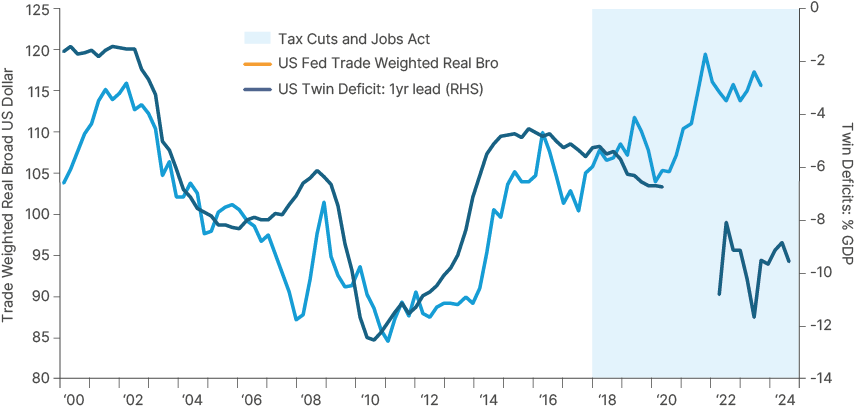
Trump believes that these countries’ industrial policies have given them unfair competitive advantages. These policies include subsidies on production and labour, tax benefits on exports and ‘unfair’ or ‘asymmetric’ tariff practices. This may all well be true, but the core reason for large US deficits is the imbalance between aggregate demand and supply within the US economy. Much of this is internally driven. The US has been running twin deficits (fiscal and current account) throughout 21st century. The deficits surged after Trump passed the Tax Cuts and Jobs Act (TCJA), marking the beginning of pro-cyclical fiscal expansion, as per Fig 5. Counterintuitively, higher twin deficits in the US drove the dollar stronger, as trade partners (particularly Japan and Germany) recycled surpluses in the US fixed income markets, driving large inflows to the US capital accounts.
Fig 5: US Twin deficits vs. Trade Weighted Real Dollar Index
That is why tariffs alone will not close the large US external imbalances. Instead, they would lead to a short-term inflationary shock which would weigh on GDP growth, mostly in the US and countries affected by tariffs. To close the trade deficit, the US would have to reduce aggregate demand, starting with a sharp consolidation of its large fiscal deficit. Fig 6 shows the low savings rates in the US, in contrast with Asia and Germany, which both have high levels of savings to GDP. So long as America (combined government and private sector) lives beyond its means, the current account will remain in a deficit.
Fig 6: Savings rates surplus countries vs. United States
That’s why, in our view, the ‘thoughtful’ policy scenario described next is key for asset prices to perform well in 2025. Lowering the fiscal deficit would allow for a combination of disinflation, lower interest rates, and a rebalancing of the external deficit. It would be particularly powerful to both the US and the global economy if Trade War 2.0 ended with an agreement to strengthen the currencies of large surplus countries. This is what we have called the “beautiful deleveraging1 and elegant rebalancing” scenario. Very few investors expect this to play out, and it is not priced into any international assets. If it does begin to play out, there is plenty of upside across asset classes, particularly in EM bonds and EM equities.2
A thoughtful approach
Scott Bessent as Treasury Secretary would significantly raise the odds of a ‘thoughtful’ economic approach proposed under his ‘333’ targets. In Bessent’s view, the US can increase oil production by 3 million barrels per day, use deregulation to boost real GDP growth to 3% per year and aim to consolidate the fiscal deficit to 3% of GDP by the end of 2028 via lowering expenditures as a percentage of GDP.
While we acknowledge the execution of these policies is challenging and uncertain, we believe the de-regulation agenda can be quite powerful in unleashing private sector ‘animal spirits,’ to boost GDP growth. We are more sceptical, but remain open-minded, about increasing oil production by 3 million barrels per day, as several of the most productive regions in the US are much closer to depletion. However, when combined with natural gas and biofuel production, 3 million barrels seems less ambitious. Bringing the fiscal deficit to 3% by 2028 is a tall order and has many sceptics sniggering. However, it is the direction of travel, not the destination of the fiscal deficit which is most important for inflation and interest rate dynamics. With over half of the current 7% fiscal deficit interest costs, even a small reduction of the primary deficit, in a falling interest rates environment, will allow for some fiscal consolidation.
Bessent also made a clear case for the US to stay in the international trading system in an article he wrote for The Economist.3 In Bessent’s view, tariffs would be used as a negotiation mechanism. The US would threaten large tariffs unless countries with an export-led growth model adjust the policies that contribute to the current imbalances. Countries aspiring to trade freely with the US would also have to abide by American national security strategic objectives, have reciprocal trade terms and end industrial policies that put their export sector at an advantage, including an end to ‘beggar-thy-neighbour’ weak currency policies. Germany, Japan, and China would be key targets for this policy, in our view.
In essence, like former Trade Representative Robert Lighthizer, Bessent believes in a return to the General Agreement on Tariffs and Trade (GATT) era when the US had trade deals only with countries that were politically aligned.
All bark, some bite
With Bessent in the Treasury, the ‘untethered’ scenario for economic policies, becomes less likely. We call untethered economic policies the incoherent mishmash of measures promised on Trump’s campaign trail. These include large tariffs across the board, breaking government institutions, and mass deportation (significantly more than the historical average). This combination would lead to wider deficits, and probably higher inflation, interest rates, and slower GDP growth. While unlikely, this scenario still needs to be contemplated as a bear case. Market participants will partially price it, particularly if signs of tension between the Treasury Secretary and the President emerge.
However, we do believe policy will ultimately be much more thoughtful than feared. Tariff hikes, and increased deportations, are likely to happen, but, in our view, not at a scale that would impact inflation substantially in 2025. Why? Trump won the election largely due to dissatisfaction over price levels. Should he wish to maintain a strong mandate through the mid-terms, he will be sensitive to any increase in inflation, particularly if driven by his own policies. Hence, inflation and the bond markets would act as a natural constraint to unfunded tax cuts and reckless tariffs.
The threats of tariffs are not unimportant. Markets are forward looking, so these threats have an impact on asset prices and the real economy as the private sector reacts to them. But in our view, tariffs will start at much lower levels than feared, and increase gradually, pushing targets to come to US terms likely well before the tariffs reach the lofty heights Trump has threatened. It is also likely that consumer goods and other strategic sectors would have exemptions, to avoid a destabilising inflationary impact, just like during the first trade war with China. In other words, all bark, some bite.
Global Economy
Growth vs. Inflation.
Where consensus can be wrong
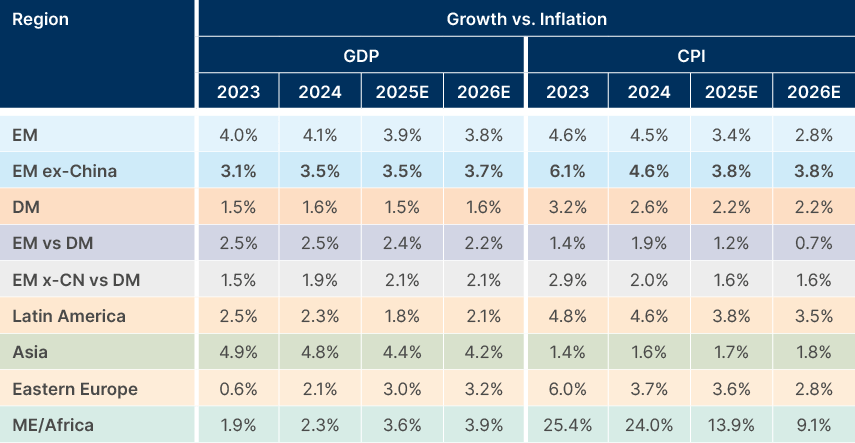
Fig 7 shows the consensus expectations across the sell-side economists we follow. Consensus for next year is now a soft landing. Economists have been raising US growth assumptions but marking 2025 GDP growth lower in the rest of the world after the impact on sentiment post-US elections. This leaves room for a positive surprise, both in developed (DM) ex-US and Emerging Markets if the next US administration is to implement more 'thoughtful' economic policies, as we suspect.
Fig 7: Consensus GDP and inflation data (2024-2026 estimates)
Unquestionably, macro uncertainty at this stage is very elevated. We also have a significant risk of a stronger slowdown than expected, both in DM and EM, if Trump’s trade policies are aggressive and front-loaded, forcing the US Federal Reserve (Fed) to stop its easing cycle early, with a significant negative impact on GDP growth across the world.
UBS estimates global GDP growth will decline by 25 basis points (bps) to 2.95% in 2025, led by similar contributions from the US (-14bps) and Chinese (-18bps) economies, and a further 30bps decline in 2026 to 2.65%, led by a 23bps drop in China. It comes to these numbers assuming 60% tariffs on 75% of goods imported from China, leading to an impact mostly in the US and China. Global tariffs of 10% would lead to a further decline of 1.0% in global growth and a 1.5% increase in global inflation, according to UBS. This is a dire scenario and not their base case.
A rebound in European sentiment and growth is contingent on more investments in defence, energy, and empowering the technology sector, which is the thrust of Mario Draghi’s recent report on boosting EU productivity. Increased investment will be possible only if Germany reforms its constitutional debt brake and begins to borrow more to fund capex. This reform is most likely to be discussed after the German snap election on 23 February.
How Europe reacts to Trump’s policies will also make a big difference to global macro. Without reforms, Europe will continue to lag and the threat of a debt crunch in France would bring the EU to the brink of crisis again. We remain of the view that the Europeans will always take decisive steps to avoid the worst for the common market and currency. This matters for EM, as Europe remain a very large trading partner across Eurasia and exerts important influence in several countries in the Middle East and Africa.
2025 Outlook EM Equities
Emerging Market equity valuations remain close to long-term averages but are attractive in relative terms to both the US and DM ex-US. The average hides the fact that 11 out of the largest 14 EM countries are currently cheap, as per Fig 8.
Another important element in Fig 8 is that US stocks trade today at the highest end of the valuation range; a very different set-up than November 2016, when Trump was first elected. On the other hand, most EM equity markets trade at a much larger discount than in November 2016, when all EM countries were trading in line with or above their long-term averages. The only countries that trade both above their long-term average and November 2016 are Taiwan, India, and Thailand.
Fig 8: S&P 500, MSCI World ex-US and MSCI EM price-to-earnings ratio (12m blended forward)
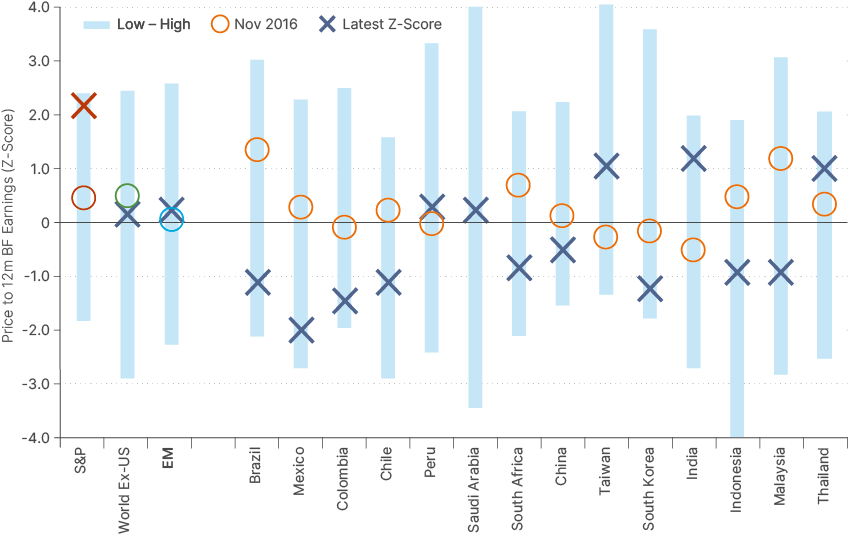
Fig 9: Price-to-Earnings & Earnings Yield: S&P 500, MSCI World ex-US, MSCI EM and largest 14 EM
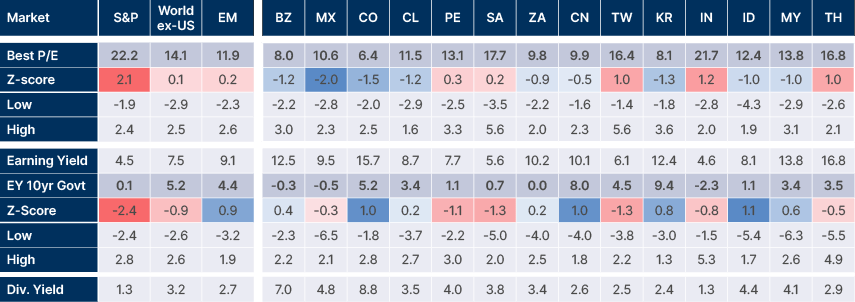
Some countries are now bargains, with plenty of growth catalysts ahead. In Latin America, Brazil, Colombia, and Chile trade more than one standard deviation (SD) below their average, as per Fig 9. An improvement in the fiscal accounts in Brazil is a potential catalyst for a re-rating higher, while higher oil and copper prices in Colombia, Peru, and Chile would be the main drivers in the Andeans. Mexico trades two SD below its average due to a string of constitutional changes that have spooked the markets. However, this could provide good entry levels considering President Claudia Sheinbaum is likely to take a market-sensitive approach when effecting the changes. Further, the three largest Latin American countries offer attractive earnings yields even when compared with their elevated 10-year government bond markets (Fig 9). This means equities can re-rate higher, should inflation surprise to the downside and central banks ease more than priced. Within Europe, the Middle East and Africa (EMEA), South Africa stands out, trading one SD below its mean as the government of national unity is likely to deliver better economic stability.
In Asia, Korea and Malaysia are trading well below average valuations, offering attractive levels for investors seeking exposure to the Asian high-tech manufacturing sector, and potential beneficiaries of the recalibration of western trade away from China.
In China, the ‘big bazooka’ of the People’s Bank of China (PBoC) allowing non-financial corporations to borrow capital on the re-lending facilities, which cost only approximately 2.25% per year, was a game-changer. With an earnings yield at double-digit levels and healthy earnings profiles across many companies, Chinese stocks are likely to be supported even in a trade war scenario (see below) and have significantly more upside than downside as soon as the trade war is over.
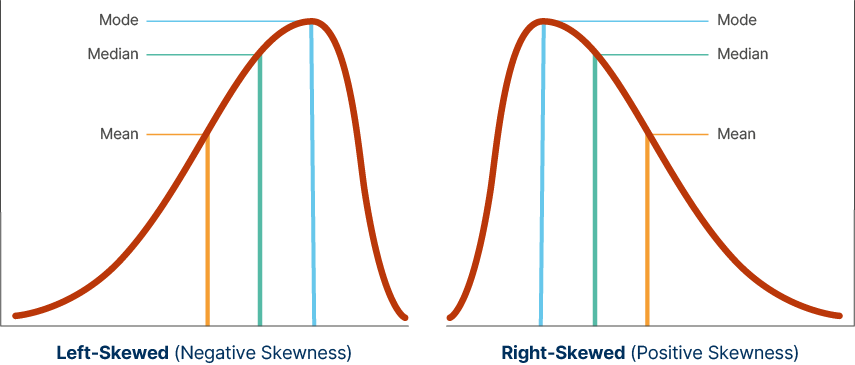
On the other hand, given levels of valuation and expectations post-Trump elections, we see US stocks have a distribution curve with negative skew and fat tails. US fixed income assets have symmetric tails and EM assets have right-skewed (positive skew) fat tails (Fig 10).
We discuss in depth the structural trends including artificial intelligence (AI), the energy transition and trade diversification, that we see driving EM equity returns over the next ten years in the link below.4
Fig 10: Left-Skewed (US stocks) vs. Right-Skewed (EM equities) distributions
EM Equity Return Scenarios
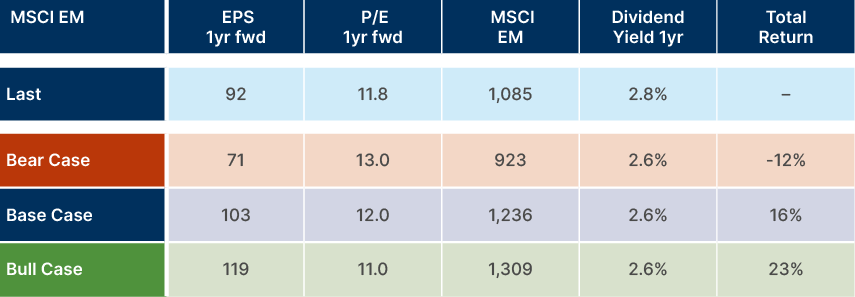
The MSCI EM currently trades at 11.8x 12-month forward-looking earnings-per-share (EPS) of USD 92. It implies a 13% EPS increase from the estimated 2024 calendar year earnings, currently at USD 81.4.
In the base case scenario, we project a similar earnings growth to consensus, with EPS reaching USD 103 at the end of 2026, which coincides with the average long-term trend of EM EPS growth (Fig 11). This would result in 16% equity returns in EM, assuming dividends at 2.6%. In the bear case scenario, we factor EPS moving to two SD below the trend (towards the bottom of the last 10-year range) for a USD 71 EPS and in the bull case we have EPS that is one SD above the trend-line at USD 119.
Considering the price-to-earnings (P/E) ratio expands in earnings contraction and declines in expansion, we get to a return range of -12% in the bear case to +23% in the bull case. There would be scenarios where EM equities rise above the bull case (or below the bear case). For example, assuming the bull case EPS and 12.5x P/E would lead to total returns of 40%. Again, this highlights the notably attractive risk-reward in EM equities.
Fig 11: MSCI EM total return scenario analysis
2025 Outlook EM Debt
Absolute yields remain attractive in EM debt. The EMBI-GD is currently yielding 7.7%, (5.5% for investment grade (IG) and 10.3% for high yield (HY), well above its 10-year median of 5.5%. Even with defaulted bonds taken out of the equation, the yield is at 6.9%, still well above average. However, spreads are now also close to historical tights, a result of the ‘risk-on’ backdrop in place for much of the last two years, and the structural reforms within HY credits that drove several credit upgrades and significant total returns from the segment.5
EM sovereign debt still offers a 340bps pick up over US Treasuries (USTs), broadly in line with the median over the last decade, albeit spreads excluding defaulted securities (Venezuela and Lebanon) are closer to 260bps.
A similar picture is observed in corporate credit. Corporate IG debt trades at 130bp over USTs, leaving spreads 80bps below the 10-year median, but yields are 110bp above the same period median. Figure 12 illustrates that not only are corporate and sovereign yields well above their 10-year average, but are also significantly higher than when Trump was first elected, in Q4 2016.
Fig 12: Yield-to-maturity by asset class (Low/High/Last/Q4-2016)
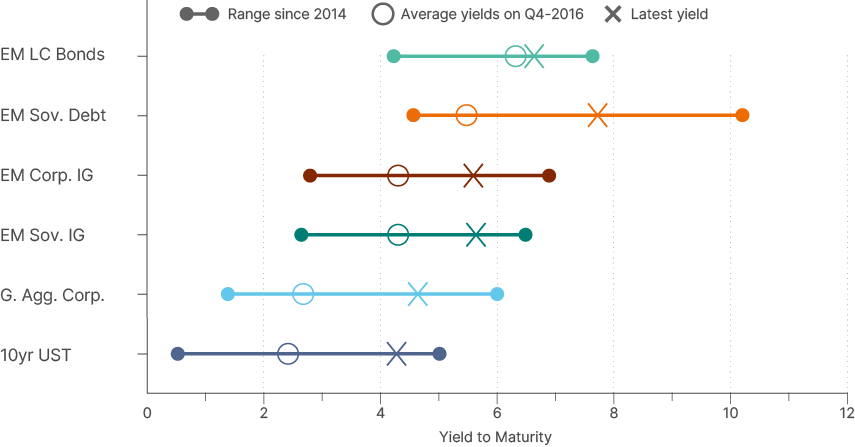
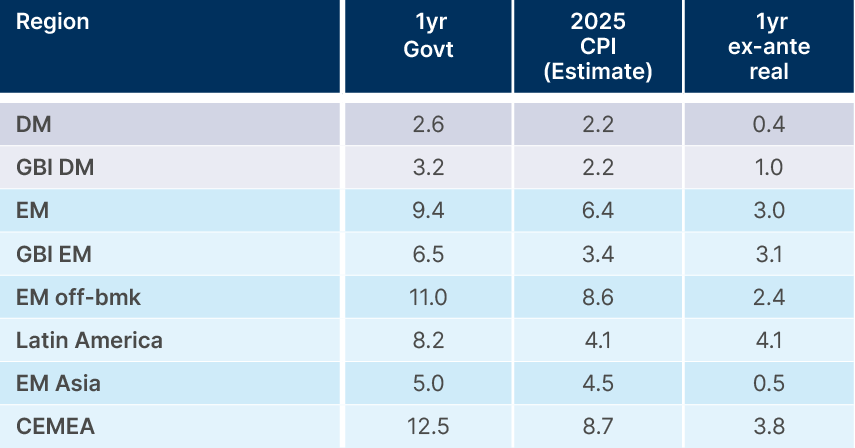
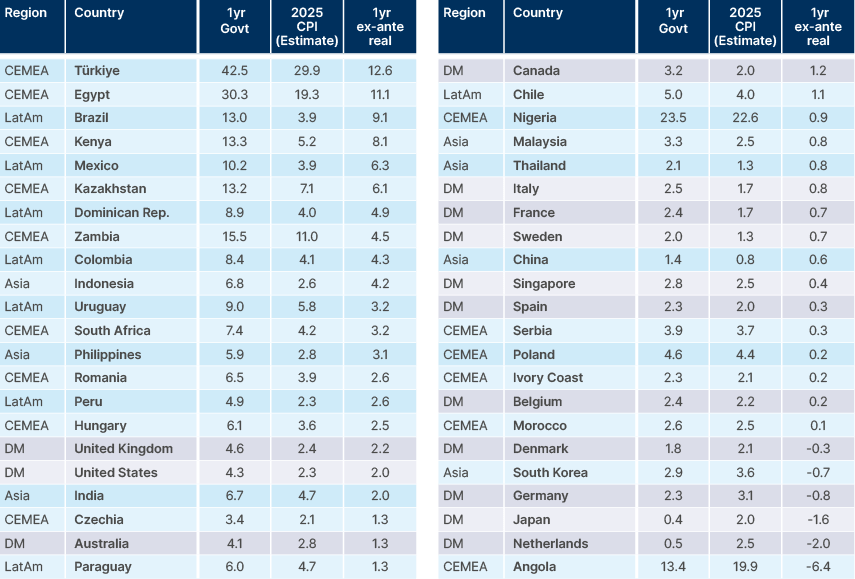
The exception is EM local bonds, with yield-to-maturity trading very close to the 2016 election level. Nevertheless, one-year government bonds trade c. 3% above expected inflation at the end of 2025. This is one of the highest ex-ante real yields on record. It is also one of the widest ex-ante real interest rates against DM on record. Several countries, including some off-benchmark frontier market (FM) countries that implemented serious structural reforms, offer even higher real interest rates, as per Fig 13. These reforms, led by the International Monetary Fund (IMF) in distressed economies across Asia and Africa, are expected to stabilise markets in HY FM segments.
Fig 13: Yield-to-maturity by asset class (Low/High/Last/Q4-2016)
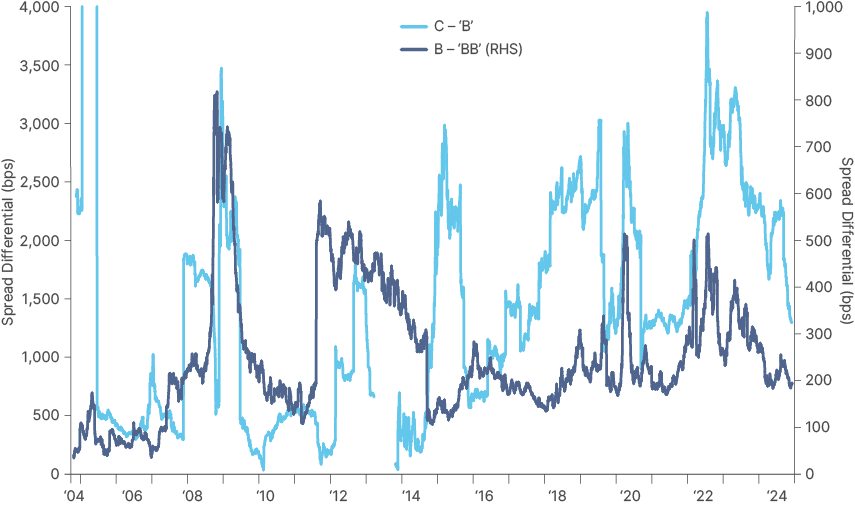
In the Dollar market, there was a significant compression of credit spreads in 2024, highlighted by BBB rated sovereign credit trading only 60bps wide to A rated credit, which is in line with its median, while BB credits trade only 70bps wide to BBB, against a median of 110, as per Fig 14. A similar picture emerges as we move down the credit spectrum, where B credits trade 190bps wide to BB rated names, which is 20bps below the median, but C and below-rated credits still trade 1,300bps wide to B rated credits, which is roughly in line with its median, as per Fig 15.
Fig 14: JP Morgan EMBI credit spreads by rating
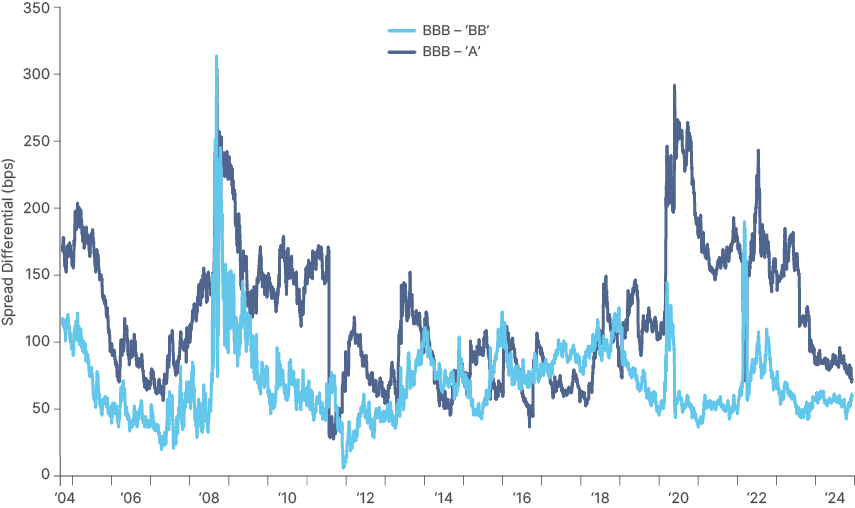
Fig 15: JP Morgan EMBI credit spreads by rating
This means that active investors extending credit risk at this stage are playing for the carry with limited capital gains upside but exposure to potential credit spreads widening. There is a strong case to be made that several countries implementing serious structural reforms, such as Argentina, Nigeria, Egypt, Ivory Coast, Türkiye, Pakistan, and several others, will keep receiving upgrades from credit agencies. On the other hand, countries with poor fundamentals, like Romania and Panama, already trade at spreads suggesting they will be downgraded to sub-investment grade. The fact that these are relatively large countries justifies tight credit spreads between rating categories.
The conclusion is that investors should keep an overweight exposure to EM debt versus traditional benchmarks such as the Global Agg due to the all-in yield. Nevertheless, a structural overweight to HY versus IG based on pure beta is no longer justified, in our view. Instead, investors should focus on individual credit selection which will play a key role in alpha generation within 2025.
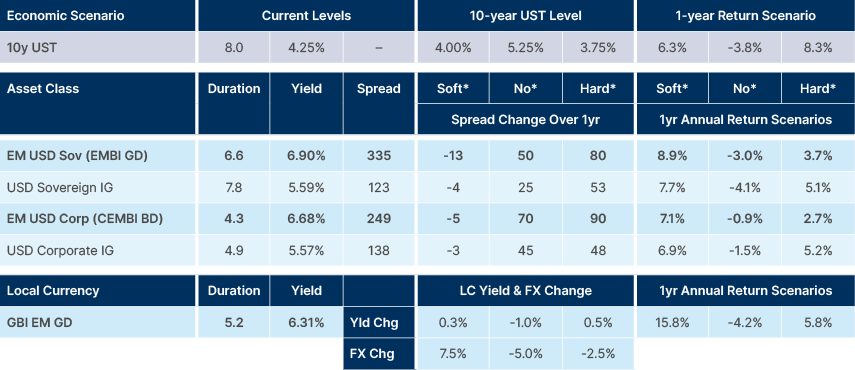
Scenario analysis including total returns: Fixed income
As usual, we assume three scenarios for the economy leading to different UST outcomes that guide the total returns within EM debt. The changes in credit spreads in Fig 16 are ‘mechanical’, meaning they follow the historical relationship with small discretionary adjustment considering spread levels and other idiosyncratic factors. For 2025, in a no-landing scenario where the market prices out all cuts from December 2024 and USTs sell-off 25bps above the widest levels of this cycle, we assume credit spreads widen too.
It is unusual that USTs and yields widen together, but we think this is a distinct possibility under the untethered policy scenario where Trump implements all his campaign promises and delivers a stagflation shock to the global economy. This is a low likelihood scenario but would have a significant impact on the asset class.
- Soft landing: Fed cuts 5x25bps to 3.5%
- No Landing: Fed cuts 1x25bps to 4.5%
- Hard Landing: Fed cuts 9x25bps to 2.5%
Fig 16: EM debt scenario analysis
EM Regional Outlook
Fixed income
China: The ‘Red Dragon’ enters 2025 navigating persistent deflationary pressures and external challenges, including potential escalations in trade tensions. In 2024, GDP growth fell short of expectations in Q2 and Q3, prompting policymakers to adopt measures including rate cuts, quantitative easing, and support for share buybacks. However, the property slump and weak consumer sentiment continue to weigh heavily on the economy.
In the property sector, the government has doubled bank credit lines to over RMB 4trn for ‘whitelist’ housing projects to ensure stalled developments are completed and confidence in the property market is restored. Additionally, an RMB 12trn increase in local government bond issuance over five years is expected to restructure high-interest debt, reducing servicing costs by RMB 600bn, which frees resources for growth-focused initiatives. Yet these measures alone may not be sufficient to drive a robust recovery. Looking ahead, stimulating consumer demand will be pivotal. Expanding the social safety net and directing fiscal support toward rural and low-income groups could boost spending, counteracting deflationary trends and rebalancing the economy.
Externally, trade tensions remain a critical risk. If US trade policy under President Trump becomes more hawkish in 2025, as expected, Chinese exports could face significant pressure. This would necessitate additional fiscal stimulus, as well as currency depreciation to offset the impact on GDP. This is probably why China is waiting until it knows more about Trump’s plans before announcing a larger fiscal stimulus package in 2025.
We see China macroeconomic dynamics remaining fragile until the end of the trade war which may come just after or just before resumption of policy stimulus, and from that point onwards the Red Dragon will have a stronger rebound. We believe the PBoC will heavily lean against any downside in equity and currency markets from here not allowing the RMB any more than necessary to offset some of the tariff shock, as President Xi Jinping is working to bolster the credibility of the RMB as an alternative reserve currency to the dollar, in the long term. This leaves more upside than downside in local assets, in our view.
India: GDP growth remained strong in 2024, projected by the IMF to reach around 7.0%. Its economy has been supported by increased infrastructure and manufacturing capex by the government. A surprise end to the BJP supermajority in government has not derailed Modi’s plans to consolidate the fiscal deficit, with the latest target at 4.9% of GDP vs 5.6% in the last fiscal year.
We expect growth to soften in 2025 towards 6.5%, as sticky inflation and election-related delays in public spending led to softening urban consumption, with tight financing conditions also weighing on credit growth. The Reserve Bank of India is yet to cut rates, which have been held at 6.5% since August 2023. Because of softening growth and urban demand, Indian equities, after a four-year bull run (up 238%) have begun to de-rate in the past three months. Rate cuts in 2025 would provide some support, which should be possible soon if food inflation moderates, which it normally does in winter as the weather stabilises.
Indonesia: GDP growth is projected to remain steady at 5.0% in 2025. The policies of President Prabowo Subianto aim to elevate growth, with increased fiscal spending, expanded special economic zones, and streamlined investment frameworks targeting long-term acceleration. Inflation and expectations remain anchored below 3% and the Bank of Indonesia has room to cut rates but has been cautious as it looks to maintain foreign exchange (FX) stability. The main risk to Indonesian assets is policies leading to a widening of the fiscal deficit above the 3% of GDP limit, but we believe these risks are contained with Sri Mulyani remaining as Finance Minister. In the longer term, Indonesian policymakers are focused on strategies to enhance economic growth, both in the short term and over the long term. In the short term, measures such as increasing civil servant salaries and implementing free meal programs for school students could provide a temporary boost. However, the extent of this improvement may be limited by the necessity of replenishing household savings, which seem to have been significantly reduced following the pandemic.
On the structural side, achieving sustained growth poses greater challenges. The capital-intensive nature of investments and the limited tolerance for larger current account deficits act as significant barriers to expanding growth potential.
Rest of Asia
In 2024, South Korea’s economy is projected to grow by 2.5%, down from earlier forecasts due to sluggish domestic demand. Inflation has eased to 1.3%, below the Bank of Korea’s 2.0% target. Due to this sluggish growth, and the threat of tariffs to exports, the BoK has now cut rates in October and November, bringing the reference rate to 3%. We see more cuts taking place in 2025, even if deep cuts are constrained by already very high household debt levels and housing market volatility risks, particularly in urban areas. In 2025, growth is forecast to fall to 2.0% due to global trade uncertainties and muted domestic consumption. South Korea faces significant exposure to potential Trump tariffs but could also benefit from a China Plus One ‘friendshoring’ effect due to its better trade relationship with America.
Strong exports and foreign direct investment (FDI) have supported Vietnam’s economy, expected to grow by 6.5% in 2024 and 2025. Again, its outlook in 2025 will be heavily influenced by the nature of Trump’s tariffs, and whether it can continue to be a beneficiary of the re-routing of Chinese trade as it has been since 2016, as well as boosting native industrial production of high-tech durable goods. We expect Trump’s administration to crack down on re-routing, which could lead to headwinds early next year.
Malaysia has also benefitted from increased FDI and exports in 2024, thanks to its high-tech manufacturing capacity, benefiting from large investments in data centres. GDP growth picked up from 3.7% in 2023 to 5.0% in 2024 and is expected to soften towards 4.5% in 2025. Thailand has faced political instability this year, culminating in the Constitutional Court removing Srettha Thavisin as Prime Minister in August. However, GDP growth reached 3.0% in Q3 2024, the fastest in two years, and is expected by the finance minister and sell-side economists to stay at this level or higher in 2025, supported by recently approved transfer programmes, higher government investment and expected export and tourism expansion.
The Philippines is expected to grow 6.0% in 2025, with domestic consumption strong, but remains very sensitive to US interest rates via the FX channel due to its high dependence on imported goods.
Latin America
Brazil: Macro rather than micro is currently the most important driver of Brazil’s equity and fixed income markets. GDP growth outperformance in 2024 has been driven by evident improvements in business conditions and growth potential, possibly due to the positive effects of earlier economic reforms. But higher fiscal spending has also played a role, and this extra injection of cash into the economy has raised inflation expectations and prompted the central bank to begin hiking the Selic rate just as the US had begun to cut the Fed funds rate. With the real rate in Brazil now over 8.5%, and equity market valuations close to historical lows despite a strong economy, investors can expect good returns in 2025, should the government restore the market’s confidence in its fiscal credibility, and the central bank starts cutting rates again once inflation expectations fall. The main risk for Brazilian assets is a scenario where government spending remains unanchored, forcing the central bank to hike policies by a larger degree, which would pose additional headwinds to GDP growth.
Mexico: After an election year which saw the Morena Party win a supermajority in Congress, the passage of a controversial string of reforms and the looming possibility of US trade tariffs have diminished investors’ faith in Mexican equities and MXN. The unwind of the popular JPY vs MXN carry trade (short yen, long peso) in August exacerbated the currency move over the summer. The negativity baked into the market can fade in 2025, in our view, once deals are struck over tariffs and the Mexican border control. Trump will probably need to get something from Sheinbaum to sheath the tariff sword. Once he does, Mexican assets can rebound, buoyed by solid consumer growth prospects and the re-arrangement of the North American supply chain.
Argentina: Policymakers have made extraordinary progress in 2024, with a fiscal adjustment and de-regulation efforts that have surpassed expectations. President Javier Milei’s ‘economic shock therapy’ and crawling peg FX system gradually brought sky-high inflation under control in 2024, even though managed prices surged as subsidies were dashed. Consumer confidence and economic activity are picking up again. With a significant share of the austerity-driven pain now in the rear-view mirror, most analysts are forecasting a rebound in export investment and economic growth of around 4% in 2025. The next big step will be the gradual removal of capital controls in 2025, without restoking inflation and sparking big outflows. If Economy Minister Luis Caputo and his team can pull this off, it would be a major milestone and mark a new paradigm for Argentina as an investment destination. Argentina will also go to legislative elections in October 2025, which will be a crucial opportunity for Milei’s party to increase its paltry presence in Congress.
Chile: After the dramatic presidential victory of left-wing Gabriel Boric in 2021, who ran on a push to replace a constitution drafted during the Pinochet dictatorship, Chile’s voters have now again swung back to the right, with the constitution unchanged. The 2025 presidential election will pit Jose Antonio Kast, leader of the right-wing Partido Republicano, against a more centrist candidate. Historically, Latin American equities have done very well in election years where a left-wing incumbent party looks likely to be displaced by a right-wing candidate. For example, in 2017 when conservative Sebastián Pinera won in Chile, equities rose 40%, as they discounted the reestablishment of more market-friendly economic policies. Chile and Peru also stand to benefit from their large copper exports, a commodity where demand is very likely to remain structurally above supply due to the energy transition.
Rest of Latin America
Colombia’s main concern in 2025 will be the continuation of fiscal consolidation efforts, with President Gustavo Petro’s ambitious tax and energy reforms to kick in from July 2025. The purchase of stocks by wealthy local families has been helping to prop up the stock market, which is trading at near record low valuations versus history and compared to local bonds.
Peru’s outlook for 2025 is generally positive, with mining exports improving and private consumption recovering due to lower rates.
Venezuela’s fortunes in 2025 will largely hinge on the direction of international sanctions, particularly on the oil sector, after Nicolas Maduro reclaimed power in a 2024 election that various countries have deemed illegitimate. The Biden administration called the opposition candidate Edmundo González president-elect and started to tighten sanctions on the regime. Indeed, Trump mentioned the country several times on the campaign trail. Vast oil reserves mean the 47th President has more than one incentive to deal with the problem.
Middle East & Africa
South Africa: Following the ANC’s loss of its 30-year majority in the 2024 elections, the formation of a Government of National Unity (GNU) with the Democratic Alliance (DA) and smaller parties has sparked renewed optimism in a revival of the beleaguered African economy. The GNU’s technocratic DA ministers are prioritising sweeping reforms in infrastructure, energy, and public sector governance, aiming to tackle unemployment, corruption, and service delivery failures. Early successes, including improvements in power reliability and business conditions, have boosted general support of the DA to unprecedented levels. These reforms, alongside efforts to attract investment and revitalise manufacturing and exports, could significantly enhance GDP growth in the coming years.
Türkiye: The shift to technocratic policies has made Türkiye an investable market once more. In fact, high interest rates to deal with huge inflation, currently at 50%, along with FX stability have made Turkish lira bonds a standout trade for local currency investors in 2024. The central bank projects inflation to decline from 44% at the end of 2024 to 21% in 2025, supported by tight monetary policy and structural reforms. These include efforts to streamline energy imports, reduce fiscal deficits, and improve foreign direct investment frameworks. The current account, historically a vulnerability, switched to a surplus in September 2024, driven by strong exports and tourism, an important step to maintaining FX stability and dollar reserves, which will give more space for rate cuts in 2025.
Rest of ME & Africa
Saudi Arabia’s recent upgrade by Moody’s to Aa3 underscores the success of its economic diversification, with non-oil revenues now accounting for 30-40% of government income, driven by gains in tourism, technology, and entertainment.
The United Arab Emirates (UAE) has experienced robust growth, propelled by a booming property sector and its attractiveness as a global business and lifestyle hub.
Morocco has also thrived, benefiting from increased FDI in renewable energy, automotive manufacturing, and agriculture, alongside strong economic growth driven by its strategic position as a trade gateway to Africa.
Egypt has faced significant challenges with the reduction of flows in the Suez Canal, but UAE investments in infrastructure and energy, alongside IMF support, can help to stabilise its economy and meet debt obligations.
Eastern Europe
Across the region, a potential ceasefire in Ukraine could present upside risks by improving energy security, trade flows, and investor sentiment, offering a more favourable environment for economic recovery in 2025.
Poland’s growth has been robust post-Covid and is expected to reach 3.6% in 2025, supported by a diversified industrial base, strong exports, and domestic consumption, though inflation of 4.7% remains a concern, requiring cautious monetary policy. Hungary’s economy is forecasted to grow by 1.8%, with inflation projected at 3.6%, driven by wage increases and energy costs, necessitating prudent policy management. The Czech Republic anticipates 2.5% growth, leveraging strong industrial exports, with inflation near the central bank’s 2.5% target supporting stable interest rates.
Romania is poised for 3.0% growth, underpinned by EU-funded projects and a dynamic tech sector, with moderating inflation at 3.2%, potentially enabling looser monetary policy. Romania remains the most imbalanced economy in the region with the twin deficit reaching 15% in 2014. The surprising election result brings higher political risk.
2024 Review:
Resilience, Tails, and Inflections all in play
Bonds: The tails wagged the dogs
In December 2023, the Fed signalled it was ready to consider cutting rates and a major ‘Santa Rally’ rally ensued. Spreads tightened, stocks soared, and 10-year USTs, the bellwether for global interest rate sentiment, moved from 4.3% down to around 3.9% by January. As 2024 began, it seemed this kneejerk move had eroded much of the potential for duration returns in the market for the rest of the year. In hindsight, the Fed overcommunicated, and the loosening of financial conditions which followed its dovish ‘Fedspeak’ alongside sticky inflation sent rates back to 4.7% by the end of April.
Over the summer, inflation began to cool more consistently, and the job market weakened. The ‘Sahm rule’ triggered in July, which historically has been an early recession signal. Notwithstanding ongoing volatility related to the US elections, the 10-year UST had declined to 3.6% by the week before the Fed’s first rate cut on 18 September. On that day, Fed Chair Jerome Powell signalled the “balance of risk” for the Fed’s dual mandate had moved from inflation to the labour market, delivering a 50bps cut, perhaps worried it was behind the curve.
Broadly at the same time, investors started increasing the odds of Donald Trump returning to the White House. Fears about the inflationary impacts of tariffs and expansionary fiscal policies, along with continued strong economic data in the US, sent yields back to 4.5% at the time of writing, only 50bps away from its peak, threatening the downward trend that started in Q3 2023. Powell flip-flopped again, saying the Fed was in “no hurry to cut rates”.
In our view, rate volatility is likely to persist until Trump’s policies become clearer. The direction of the dollar, crucial for global macro, has been closely correlated to US yields. The DXY has been in the 100-107 range over the last two years. It traded at the top of its range in April 2024 and declined to its lowest levels in Q3 2024 before rising to the top again following Trump’s win.
Equities
The MSCI ACWI, which tracks DM and EM stocks, is up 18% year-to-date (YTD). EM stocks have lagged DM stocks this year, up just 8.3% YTD.
The S&P 500 outperformed again, up 25% YTD, as ‘US exceptionalism’ barrelled on. Much of this can be attributed to the performance of the ‘Magnificent Seven’ companies, particularly NVIDIA, which, riding on the crest of the frenetic AI investment wave, is up 190% YTD. Its market cap is now USD 3.4trn, around 1.5x the size of the FTSE 100. Earnings growth assumptions for AI ‘pick-and-shovel’ companies have improved throughout the year, but valuations are by far the biggest driver of this rally. The P/E ratio for the S&P 500 rose to 27x this year, or 25x on a 12-month forward-looking basis, which translates into a paltry 4.0% annual earnings yield. The promise of Trumpian deregulation and corporate tax cuts next year provides a narrow path forward for the index to rise again but the market’s reaction to his victory, with the index rising nearly 10% since mid-September, discounted a lot of the potential upside. This is particularly true considering US growth is likely to slow down next year due to cyclical factors, tariffs, and immigration.
Until Q3, EM equity fundamentals moved in the right direction, in line with our expectations up by 16.6% (only 3% below the S&P) thanks to a rebound in EM earnings and Chinese stocks. Since then, however, EM stocks have de-rated from 16x earnings to 14x (down from 15x at the start of 2024), while US stocks rerated from 26x to 27x over the same period (up from 25x at the beginning of the year).
External & Corporate Debt
EM sovereign bonds put in a strong performance in 2024, despite spreads starting the year relatively tight. On a trailing 12-month basis (the period between the 2024 and 2025 outlooks), the EMBI is up 14.6%, and 6.3% YTD (7.1% on an annualised basis). Yield has contributed 4.9% of this return (5.5% annualised), with price gains contributing the rest. All these gains came from spread compression in high-yielding names as UST yields increased over the period. Positive idiosyncratic country stories, many of them in distressed issuers backed by IMF-led reforms, anchored the riskier end of the asset class, bringing impressive returns for investors patient enough to hold debt through reform and restructuring processes.
Corporate debt also has delivered solid returns this year, with a 8% total return so far 8.8% annualised. The EM Corporate IG index has returned 5.6% YTD versus just 2.6% for US IG corporates. Spreads ground tighter throughout the year as global risk sentiment remained buoyant, with strong growth and supportive macroeconomic policies, including rate cuts in most of EM during 2024, improved both business and borrowing conditions for levered EM corporates.
Local Currency
In dollar terms, local currency assets generally struggled this year due to dollar strengthening in seven out of 11 months. Local bonds performed well from May to September, as the dollar weakened sharply, but this trend reversed, and the dollar is now stronger than it was at the beginning of the year. YTD, despite 4.6% of carry returns, (5.2% annualised), the FX return of the GBI-EM GD index has been -5.6%, bringing the total return to -1.2% (-1.3% annualised). The solid performance in some pockets, like Asian bonds, Türkiye and others, were compensated by poor performances in Latin America as Mexico was hit by a surprise result in its own election plus the election of Donald Trump. Also, Brazil turned back to rate hikes as fiscal slippage lifted risk premium on the local curve and weakened the BRL.
Review of 2024 Outlook Calls
Good
- Resilience, tails, and inflection: Fundamental backdrop, rates views and politics driving inflections played out as expected and were a good guide for investors throughout 2024.
- Politics was the focus of 2024:
- Trump returned to the White House as expected.
- Indonesia kept pragmatic post-elections policies.
- Türkiye kept orthodox policies despite AKP setback in municipal elections.
- South Africa moved to a Government of National Unity.
- Labour returned to power in the UK.
- Far-right parties increased position in EU elections, which drove EU instability.
- EM growth supported by sound policies: The EM growth premium (EM GDP – DM GDP) returned to above 2%, accompanied by a wave of credit rating upgrades.
- Latin America more resilient than expected (+2.3% vs 1.9% est.) Middle East and Africa better than consensus too as the war against Hamas and Hezbollah did not hit growth as anticipated.
- Strength in EM sovereign debt: EM USD debt outperformed in 2024, with the EMBI GD returning 6.4% and HY debt delivering 12% so far, driven by easing monetary policies and idiosyncratic recoveries. The barbell strategy between IG and distressed debt worked well, EM IG assets outperformed DM.
- El Niño’s inflationary impact: El Niño-driven weather events in 2024 led to volatile food inflation, with soybean and corn prices rising sharply. Droughts devastated crops in Africa, prompting Malawi, Zambia, and Zimbabwe to declare emergencies. Similar extreme weather in 2025 could further disrupt global agricultural yields and keep inflation elevated.
- EM earnings recovery: EM EPS recovered, so far up 11.9%, in line with Japan (11.5%), above the US (9.1%), and Europe (-1.0%) supported by EM technology sector (+58.4% vs. 20.8% in the US), as flagged by the improving exports from Taiwan and Korea in Q4 2023.
Bad
- EM equity outperformance: While EM equities saw a strong rally from January lows (up 13%), YTD returns lagged at just 6%, well below our base-case scenario. Despite a solid EPS rebound, EM stocks de-rated from above 16x (12m trailing earnings) to below 14x post-Trump election, which dragged returns.
- Local currency bonds may offer the most upside: Poor performance of Latin America in H1 2024 followed by the dollar rally after Trump’s election were the culprits.
2025 Political Calendar
Asia
- Philippines (May): Mid-term elections will determine the balance of power in the Senate and House of Representatives.
Americas
- Argentina (October): Legislative elections will be crucial for President Javier Milei’s libertarian economic reform agenda. A strong performance by his coalition could consolidate his policies, especially amid signs of economic recovery.
- Bolivia (August): President Luis Arce’s Movimiento al Socialismo (MAS) contends with deep internal divisions, heightened by the return of exiled president Evo Morales, who is vying for the candidacy once more, and a resurgent opposition.
- Chile (November/December): President Gabriel Boric’s liberal administration faces declining approval ratings and an electorate swinging back towards the right. He is likely to be replaced by either a centrist or more conservative figure, which may have positive implications for markets in 2025.
- Jamaica (October): Prime Minister Andrew Holness’s Jamaica Labour Party (JLP) is expected to retain power.
Africa
- Cameroon (October): President Paul Biya, in power since 1982, is expected to seek re-election.
- Egypt (TBC): Parliamentary elections are anticipated to reinforce President Abdel Fattah el-Sisi’s administration.
- Ivory Coast (October): The presidential race features incumbent Alassane Ouattara and former president Laurent Gbagbo. Their rivalry raises concerns about potential unrest, as both have substantial support bases.
- Tanzania (October): The ruling Chama Cha Mapinduzi (CCM) party, under President Samia Suluhu Hassan, is expected to retain power. The opposition, including Chadema, remains fragmented.
Europe
- Germany (February): Germany’s 2025 early election, triggered by the collapse of Olaf Scholz’s coalition, will likely lead to a reshaped government, with risks of significant far-right influence. Disputes over fiscal austerity and energy reforms ended Scholz’s tenure, leaving Germany politically fragmented. The Greens, potentially led by Robert Habeck or Annalena Baerbock, advocate for stronger climate policies and deeper EU integration, while Friedrich Merz’s CDU seeks fiscal restraint and migration control. Rising support for the far-right AfD could force mainstream parties into difficult coalition negotiations, risking a diluted pro-European agenda. The election is pivotal for Germany’s stability and its leadership within the EU.
- Poland (May): With President Andrzej Duda ineligible for a third term, the election will feature right-wing PiS candidate Karol Nawrocki, pro-EU progressive Rafał Trzaskowski, and centrist Szymon Hołownia. Should Nawrocki win, Donald Tusk’s government can expect continued resistance from the presidential palace for the remainder of its parliamentary term.
- Belarus (January): The presidential election is expected to be a largely ceremonial affair, handing power again to President Alexander Lukashenko for a seventh term.
1. “A “beautiful deleveraging” happens when the four levers are moved in a balanced way so as to reduce intolerable shocks and produce positive growth with falling debt burdens and acceptable inflation. More specifically, deleveragings become beautiful when there is enough stimulation (i.e., through “printing of money”/debt monetization and currency devaluation) to offset the deflationary deleveraging forces (austerity/defaults) and bring the nominal growth rate above the nominal interest rate – but not so much stimulation that inflation is accelerated, the currency is devaluated, and a new debt bubble arises” – Ray Dalio, A Template for Understanding Big Debt Crises (2018).
2. See – “Trump 2.0: Implications for Emerging Markets”, Market Commentary, 12 November 2024.
3. See – https://www.economist.com/by-invitation/2024/10/23/the-international-economic-system-needs-a-readjustment-writes-scott-bessent
4. See – “A new bull market cycle in Emerging Market equities”, The Emerging View, 25 September 2024.
5. See – “The untold story of improving EM fundamentals”, The Emerging View, 27 June 2024.