
Economic growth and inflation have surprised to the upside so far in 2023, not only thanks to the reopening of the Chinese economy, but also due to the resilience of the labour markets. The combination of a resilient economy and inflation has boosted the ability of companies to service their debt, even if margins are compromised due
to higher labour and supplier’s costs. Global central banks have turned more hawkish, increasing the risks of disruption in the economy and to financial assets during 2023. In the absence of a policy mistake inducing a hard economic landing, the current environment suggests credit should outperform equities, but the treacherous environment and higher yield available on high-quality credit suggests investment grade assets have value. We make the case for investors with a traditional Global Agg and/or US Agg benchmark to diversify their exposure to Emerging Markets (EM) investment grade.
Global Macro update
So far, the economic data has not corroborated the thesis of an economic slowdown in the first half of this year. This thesis predicted the wealth effect (lower real estate and equity prices) and some pockets of distress across balance sheets would lead to lower gross domestic product (GDP) growth via the labour market.1
In fact, economic data has surprised to the upside year-to-date, led by China’s all-out reopening, a milder winter in Europe and a resilient US labour market. The strong labour market, alongside anecdotal evidence from earning announcements, suggests jobs destruction is taking place in those ‘white collar’ industries which appeared to over-hire during the pandemic, contrasting with a robust labour market for ‘blue collar’ workers, particularly in service sectors (such as hotels and restaurants) with pent-up post-pandemic demand. A massive 8.7% increase in the social security and supplemental security income for 70 million Americans in January added to the reflationary picture early in 2023.2
In other words, we have moved away from a recessionary trend in 2022 where growth was declining towards zero in China and the West, albeit with the global manufacturing sector still on a downward trend, a confusing picture explained in the last weekly research.3
Fig 1: Sell-side growth and CPI inflation forecasts
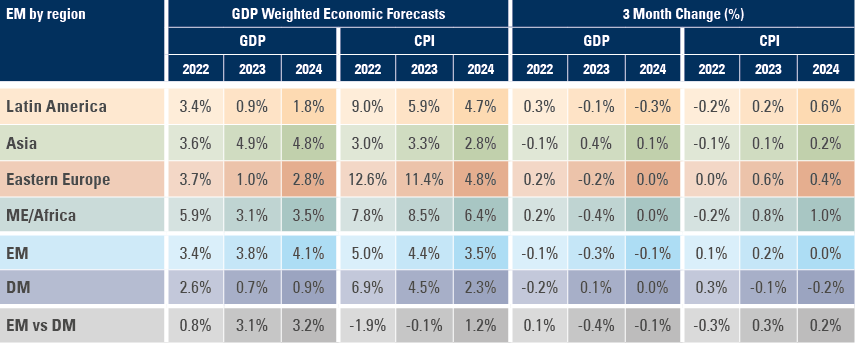
The 2022 GDP growth was revised higher across three out of four EM regions, namely Latin America, Eastern Europe, and Middle East/African. Eastern European countries had the largest upward growth revisions, after a the warmer-than-expected winter allowed for a better economic environment. Growth was upgraded in Asia but downgraded in the rest of EM for 2023. In our view, the risk to these 2023 growth estimates remains to the upside in EM Asia and regions benefiting from better GDP performance from China (Latin America, Middle East, and selected countries in Africa). The expected gap between EM and Developed Market (DM) growth in 2023 narrowed by 40 basis points (bps), but remains elevated, at 3.1%.4
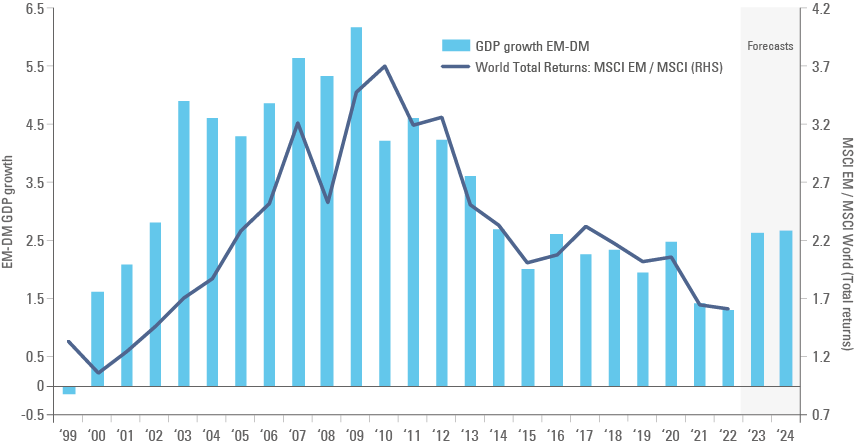
The overall thesis that EM assets should outperform DM is predicated on better economic momentum from the former, rather than the latter remaining intact. New economic forecasts from the International Monetary Fund (IMF) have the EM growth premium widening in relation to its October World Economic Outlook, allowing for an even larger scope for EM asset prices outperformance as per Figure 2:
Fig 2: IMF EM vs. DM growth forecasts overlayed against MSCI EM to MSCI World returns
Higher economic growth in an environment of tight labour markets and commodity supply kept inflation more elevated than expected in most DM countries in January. Therefore, the US Federal Reserve (Fed) and the European Central Bank (ECB) have insisted they will keep policy rates raised for longer.
This macro scenario should translate into a microenvironment where companies’ revenues growth remains buoyed by inflation, but with higher cost of doing business leading to tighter margins. Large companies that anticipated an environment of higher interest rates are therefore in a comfortable position to repay their debt, despite margin compression.
Corporate debt (and EM sovereign) performed well since October 2022 and received significant inflows in the period. The key risk for EM bonds (particularly B-rated sovereign debt with poorer balance sheets) is the Fed remaining more hawkish for longer, exacerbating the impact of monetary policy tightening in the economy, and leading to a more severe recession later. Therefore, a barbell between investment grade (IG) and selective high yield (HY) (focusing on C-NR credits and highly selective approach on B’s and BB’s) should perform extremely well through the next cycle.
More at risk seem to be US stocks, which moved to a cyclically adjusted price-to-earnings (CAPE) ratio of 27.6x, a ratio that was exceeded only twice over the last 35 years. The first time was in 2000 (just before the dot-com bubble), while the second was in 2021, just before the repricing in rates alongside lower growth led to the 2022 sell-off in stocks and bonds. On the other hand, EM equities have significant upside. China reopening its economy is likely to lead to a positive environment for Chinese consumers, but also potentially for commodity producers (Middle East, Latin America). Several EM countries increased their policy rates much sooner than the Fed, and countries such as Brazil are now seeing significant disinflation, and will most likely start cutting policy rates ahead of the Fed. Therefore, the central thesis of EM assets outperforming DM assets – both in fixed income and equites – remains in place.
‘Helicopter money’: Another interesting theory that does not work in practice
History is full of bubble episodes caused by public authorities. Türkiye, Argentina and Zimbabwe are classic examples in EM and Frontier Markets, where monetary and fiscal mismanagement led to a complete de-anchoring of macro stability, but there are also several DM examples, including the Tulip Mania in the 17th Century, John Law in France during the 18th century, the Panic of 1873 caused by the excessive printing of ‘greenbacks’ to fund the American Civil War, the Great Crash in 1929 and the US housing and financial crisis in 2008.
The root of the current situation was unprecedented fiscal stimulus during the 2020 Covid pandemic, funded by DM central bank bond purchases – quantitative easing (QE). DM central banks had already been purchasing government bonds since 2009, but rather than creating money, QE without fiscal expansion instead created reserve assets in the banking system, which simply forced banks to increase risk taking, boosting asset prices. When QE was enacted alongside massive fiscal stimulus, we had the first taste of ‘helicopter money’.
It doesn’t take a genius to figure out that helicopter money is a bad idea. Just close your eyes and try to think how people would react to an unprecedented downpour of cash from the skies. Would that lead to order and prosperity? More like chaos as people scramble over each other for the largest share of coins and bank notes, then a rush to exchange this ‘manna from heaven’ for goods and services. In short, it creates anarchy, not abundance, like the massive inflow of silver and gold from American colonies to the Spanish Empire in the 16th and 17th century, which caused inflation and gave rise to disorder (piracy).
Whiplash: Changing stance without a plan
It should not be a surprise that the first effects of the rebound from the most aggressive monetary policy tightening since the early 1980s – right after QE and negative interest rate policies – is being felt primarily in places where the housing market was the most buoyant/frenzied. Australia, Canada, and Scandinavia are top of the pack. The key risk for the outlook is that more DM central banks are currently being forced to follow Fed Chair Jay Powell’s misguided attempt to reincarnate his predecessor, Paul Volcker.
It is misguided, in our view, because it completely misses the historical differences between the Volcker and Powell eras. Volcker became Fed Chairman after decades when interest rates were running mostly below inflation, thus eroding the debt from the Vietnam War. Furthermore, in the 15 years preceding Volcker, commodity prices (particularly energy prices) increased meteorically, leading to a massive investment in energy during the 1970s. The 1980s saw the first leg of an aggressive decline in commodity prices, which was accelerated by tight monetary policy, but driven mostly by excessive supply.
Powell’s invocation of Volker takes place when US debt-to-GDP is at its most elevated in history, its deficits are widening and out of whack with the business cycle while the world faces a shortage of commodities resulting from ten years of underinvestment in energy and materials followed by a strong push to accelerate energy transition. The energy transition is perhaps the most important adjustment of the current generation, but the long delay in adopting these policies will lead to higher cost of implementation.
A group of renowned economists recently wrote a paper entitled ‘Managing Disinflations’ where they reach three main conclusions:
- There is no post-1950 precedent for a sizeable central bank-induced disinflation without economic sacrifice or recession.
- The post-pandemic inflation oscillations are more like similar to the 1950-1985 period than the 1985-2019 goldilocks period.
- The Fed would have to tighten monetary policy significantly further to achieve its inflation objective by 2025.
We have argued that point two and one were likely in our previous outlook papers (published in December 2020 and December 2021). More recently, we have been arguing that the Fed should be careful when hiking policy rates, as trying to bring inflation back to the target would lead to an economic recession, a similar conclusion reached by the paper: whiplashes are painful and dangerous.
Asset allocation: The EM debt barbell
How should long-term asset allocators position in such a treacherous environment? In our view, the answer is to build a barbell between high quality IG companies and sovereigns in EMs, as well as distressed plays offering significant upside and more limited downside. The list of distressed plays is relatively broad. In sovereign debt, Argentina, Venezuela (primarily Petroleos de Venezuela), some state-owned companies in Latin America and some sub-Saharan African countries are quite attractive.5 In corporate debt, China real estate developers are very distressed and maybe at an inflection point after China’s Politburo transition. Last, several countries offer double-digit yields in their local currency bonds, implying a very high real interest rate at a time of the cycle where EM currencies are very undervalued, both in nominal and risk-adjusted terms. The EMBI Global Diversified Index, comprising roughly 50% IG countries, 45% BB and B- rated and 5% C-rated or below, trades at close to 8.5% yields, which is already attractive from an asset allocation perspective, as it incorporates a significant amount of distress.
The ‘goldilocks’ macro environment prevalent from 1980 to 2020 is unlikely to return, at least over the next three to five years. We are more likely to oscillate between periods of disinflation led by a strong economic slowdown (or mild recession) caused by monetary policy tightening and stronger asset price selloffs and higher unemployment rates that will force central banks to U-turn, which is likely to restoke inflationary pressures. The supply constraints resulting from the energy transition and the urge to reduce inequality as well as less capital to subsidise products and platforms (cash is king when real rates are positive). Will artificial intelligence (AI) lead to a deluge of productivity gains? Perhaps, but the vast amount of energy processing demanded by AI may also compound the physical world shortages at a time when real interest rates are at their highest level since 2007.
Considering that a recession is likely within the next six to 18 months, IG bonds offering 5.0% to 7.0% yield-to-maturity are a safe bet, particularly in EMs, where most countries with balance sheet weaknesses were downgraded over the last ten years, narrowing the universe, and where valuations are still very attractive in relative terms. The high yield and local currency bond asset classes carry more risk, but extremely low cash prices and cheap currencies; and the sky-high levels of yield on local bonds offer the potential for a tremendous upside versus a modest downside. Several EM countries have very idiosyncratic risks, are less exposed to pervasive macro volatility, and are likely to benefit from higher commodity prices while being more insulated from geopolitical risks.
EM IG vs. Global IG
A simple, but potentially effective asset allocation opportunity is for long-term global fixed income investors to diversify from US-centric IG credit portfolios – such as the Bloomberg Global Aggregate of Bloomberg United States Global Aggregate into EM IG sovereign and corporate bonds.
EM IG sovereign has become a narrower but high-quality asset class, resulting from the downgrade of several countries which have been low-rated investment grade in the past, such as Türkiye, Russia, South Africa, Brazil, and Colombia. Meanwhile, new large high-quality issuers from the Gulf, namely the United Arab Emirates, Saudi Arabia, and Qatar, have become a dominant part of the asset class.
Most of the corporates from countries where the sovereign ratings dropped below IG were also downgraded, with very few exceptions where the company generates most of its revenues in foreign currency and has a very healthy balance sheet (e.g., Braskem and Vale in Brazil).
Despite the turbulent environment over the last decade, EM corporates and sovereigns outperformed US Aggregate by 180 and 190bps respectively, against a modest increase in volatility of 50bps and 170bps respectively from 31 December 2001 to 31 January 2023. The outperformance took place despite the large and unusual losses from the Russian invasion of Ukraine, which led to a significant drawdown on the index level. Russia represented more than 6.0% of EM sovereign IG benchmark and c. 4.3% for the EM corporate IG benchmark in December 2021, and its bonds were excluded from the indices at a zero-market value.
The more appropriate comparison would be against US corporates against EM corporates: EM IG corporate outperformed its US counterpart by 70bps with only 20bps higher volatility, while EM sovereign outperformed US Treasuries by 80bps with 140bps higher volatility as per Figure 3. Overall, EM corporate had the best Sharpe ratio of US Dollar-denominated Investment Grade and EM sovereign was only behind mortgage-backed securities in terms of risk-adjusted returns.
Fig 3: EM Investment Grade assets vs. selected IG Global and US benchmarks – Monthly data from December 2001 to January 2023
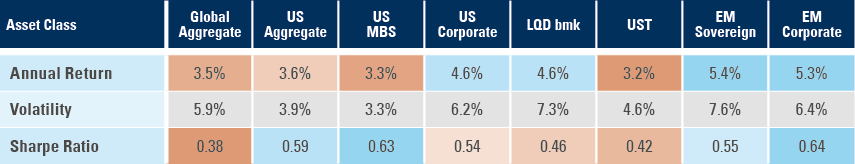
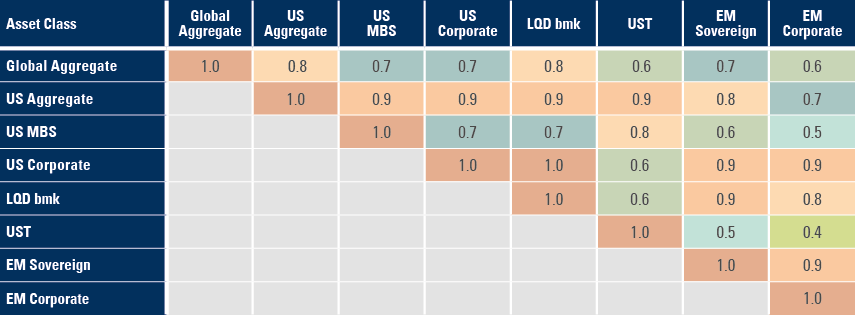
Not only did EM IG asset classes achieve the best absolute and risk-adjusted returns, but their correlation to broad fixed income benchmarks such as the Global Agg and US Treasuries was among the lowest across IG asset classes. However, EM IG does have a very high correlation with US IG corporate assets, both the US corporate component of the Global Agg and the benchmark of the most liquid US Corporate exchange-traded fund (ETF), as per Figure 4, rendering them ideal switches for investors keen to capture the EM spread over US corporates, but worried about increasing the tracking error to their respective benchmarks.
Fig 4: Correlation Matrix IG Universe – December 2001 to January 2023
IG Efficient Frontier
Unless something changes dramaticaly, the Figure 3 numbers suggest that rational IG investors seeking to increase total returns to hedge their portfolios against surging inflation and a potential environment of tighter margins on US corporates should have a much larger allocation to EM. The EM outperformance of the last 20 years is also illustrated by the IG efficient frontier on Figure 5.
Fig 5: EM IG efficient frontier: December 2001 to January 2023

IG Valuations
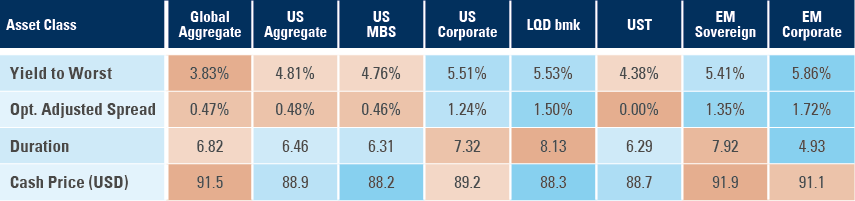
Past performance does not guarantee future returns, but when looking into the future, EM IG assets offer higher yield-to-maturity than their peers. EM sovereign investment grade offers 135bps of spread over US Treasuries (only behind the US Corporate IG ETF) and EM corporate offers 172bps of spread over US Treasuries. EM Corporate IG also offer the highest yield-to-maturity and the lowest exposure to changes in interest rates (duration). The discount over par on EM IG is only marginally smaller than on its peers.
Fig 6: Yield, duration, and cash price for selected IG benchmarks
EM IG Fundamentals
In the EM sovereign space, the main development in the asset class was the downgrade of sovereigns with higher levels of indebtedness and political risks while several Gulf countries joined the asset class and became regular issuers. In total, countries that represented almost one-third of the EMBI IG ten years ago were downgraded to high yield, while the Gulf countries represent today close to one-quarter of the EMBI IG6. Gulf countries are not only the lowest cost energy producers in the world, but they also have high levels of GDP per capita, low levels of indebtedness and a gigantic war chest of foreign exchange reserves: combined they represent a quarter of the EMBI IG today.
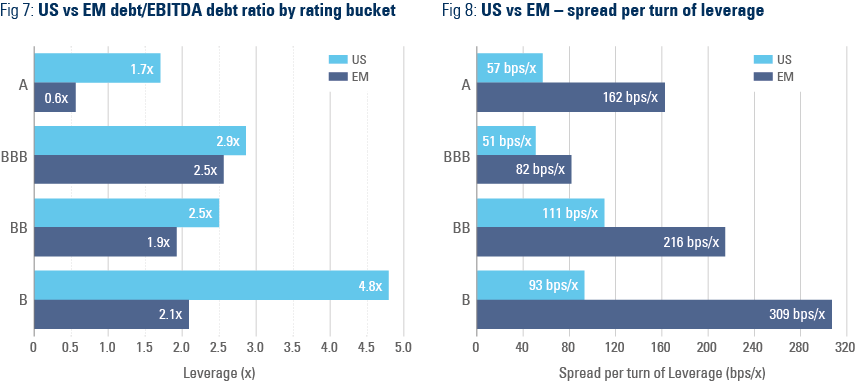
In the corporate space, better fundamentals are evident by lower leverage, measured by debt to earnings before interest, tax, depreciation, and amortisation (debt/EBITDA). A company with a debt/EBITDA ratio of 2.0x would need two years of adjusted earnings to repay its debt. The lower the level of debt/EBITDA, the lower the risk that a sudden change in operational environment – leading to a drop in earnings or higher cost of funding – would result in a liquidity event, where the company doesn’t have cash to settle its short-term financial obligation. Figures 7 and 8 show that EM corporates have the lowest levels of leverage, measures by debt/EBITDA, but pay the highest spread after adjusting for leverage, the spread divided by the ratio of debt/EBITDA.
Relative performance
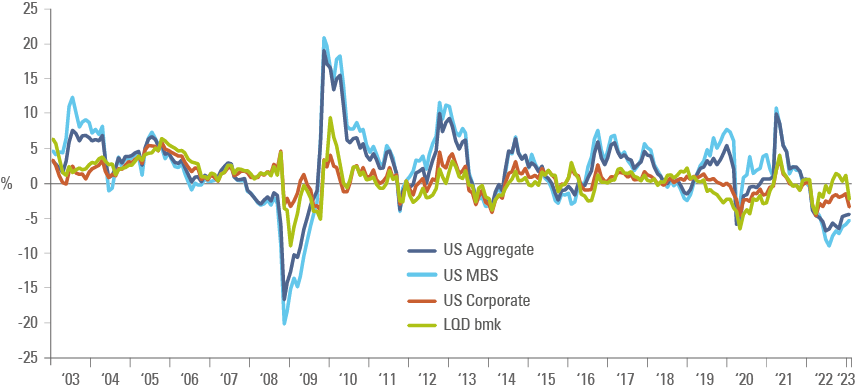
The higher yield in EM investment grade assets means it should outperform its investment grade peers on a sustainable basis. However, there are cycles when EM significantly outperform on a more structural basis – like the 2002-2007 period when EM IG outperformance against DM IG was consistent – and times when EM IG assets performance against US oscillates. The 2011-2022 period saw five episodes when EM IG assets underperformed US equivalents. Those periods were invariably a good opportunity to rotate away from US IG into EM IG, and we have just had a significant relative performance drawdown, which suggests the large spread premium on EM assets vs US could tighten soon, leading to outperformance of the former vs. the latter as per Figure 9.
Fig 9: EM IG (average of Sovereign and Corporate) relative performance vs. US IG indices
Capturing the EM risk premium in the lower risk spectrum
Beyond the tactical opportunity, it is also possible that the outperformance of EM IG bonds over its US peers may become structural again, like in the 2002-2007 period. Back then, EM GDP growth was outperforming DM growth and the US Dollar was selling-off as investors diversified their exposure away from US assets into the rest of the world. In our view, that’s precisely what may happen over the next years and was kickstarted in 2023 by the Chinese economic reopening.
The US Dollar outperformance over the last six-plus years was predicated on an extraordinary environment for US stocks, owing to pro-cyclical fiscal and monetary policy expansions since 2016. In our view, this environment is highly unlikely to be replicated over the next few years, leaving US assets vulnerable to underperformance, which should also lead to a weaker US Dollar and allow for EM risk premium to tighten.
Several investors will argue that, in this environment, allocations to riskier EM assets such as local currency bonds and/or EM equities vs US equities will have higher upside. That is true, in our view, but investors constrained to conservative fixed income assets can also capture the EM risk premium via IG bonds. For them, 100bps relative value would be enough.
1. Office real estate in large cities and residential real estate in some countries, with Sweden being a clear case study we focus the next sessions.
2. See https://www.ssa.gov/cola/
3. See ‘It’s so hard to read the economy!’, Weekly Investor Research, 27 February 2023.
4. The list of 31 large EM economies comprising the four regions excluding Argentina, Ukraine, and Türkiye to remove idiosyncratic large distortions (particularly negative growth in Ukraine in 2022 and inflation in Argentina and Türkiye). The change in the EM-DM growth profile would be immaterial but keeping those countries would distort the regional data.
5. US persons are not authorised to purchase, directly or indirectly, certain debt and equity securities from the Government of Venezuela subject to sanctions.
6. Turkey, South Africa, and Brazil featured on the top-10 countries on EMBI IG between 2012 and 2015 while Colombia and Russia were among the top-10 countries until 2020.