
Warren Buffett’s mantra of “being greedy when others are fearful” has delivered good returns for faithful investors over the long term. Our analysis shows that asset allocators who buy Emerging Market (EM) assets during volatility spikes have delivered considerable alpha.
This Emerging View builds on our previous analysis by considering the fact that volatility spikes typically persist for several weeks.1 Our findings suggest adding exposure in the month after the initial Vix spike has better backtested results than doing so in the month of the Vix surge.
Volatility is back
The sharp increase in volatility on Monday, 5 August, was caused by several factors discussed in our weekly insight.2 We have pointed out in the past that volatility spikes, measured by the implied volatility on US equities (Vix), were great opportunities to buy EM assets.
The backtest on Fig. 1 simply considers the average returns investors would have obtained had they added exposure to different EM asset classes at month-end, after the Vix Index rose more than 10 points above its 60-day moving average. We put quotations around ‘active’ here, because it is really a mechanical rule. That this simple philosophy outperformed the benchmark in so many cases suggests there is real value in “being greedy when others are fearful”, the philosophy adopted by Warren Buffett that built on the value investing literature of many, including Benjamin Graham, his once-professor.
Fig 1: Average 12-month returns of ‘Active’ vs. ‘Passive’3
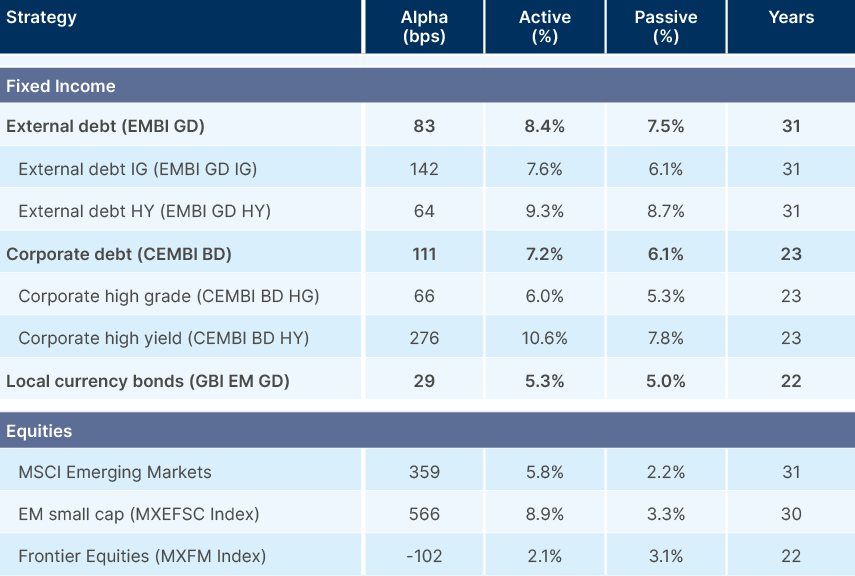
The exception to the rule was Frontier Markets (FM), where adding exposure on the month of the Vix spike led to relatively poor average returns. Albeit counterintuitive, this makes sense considering the much lower correlation between FM and global stocks.
Timing matters
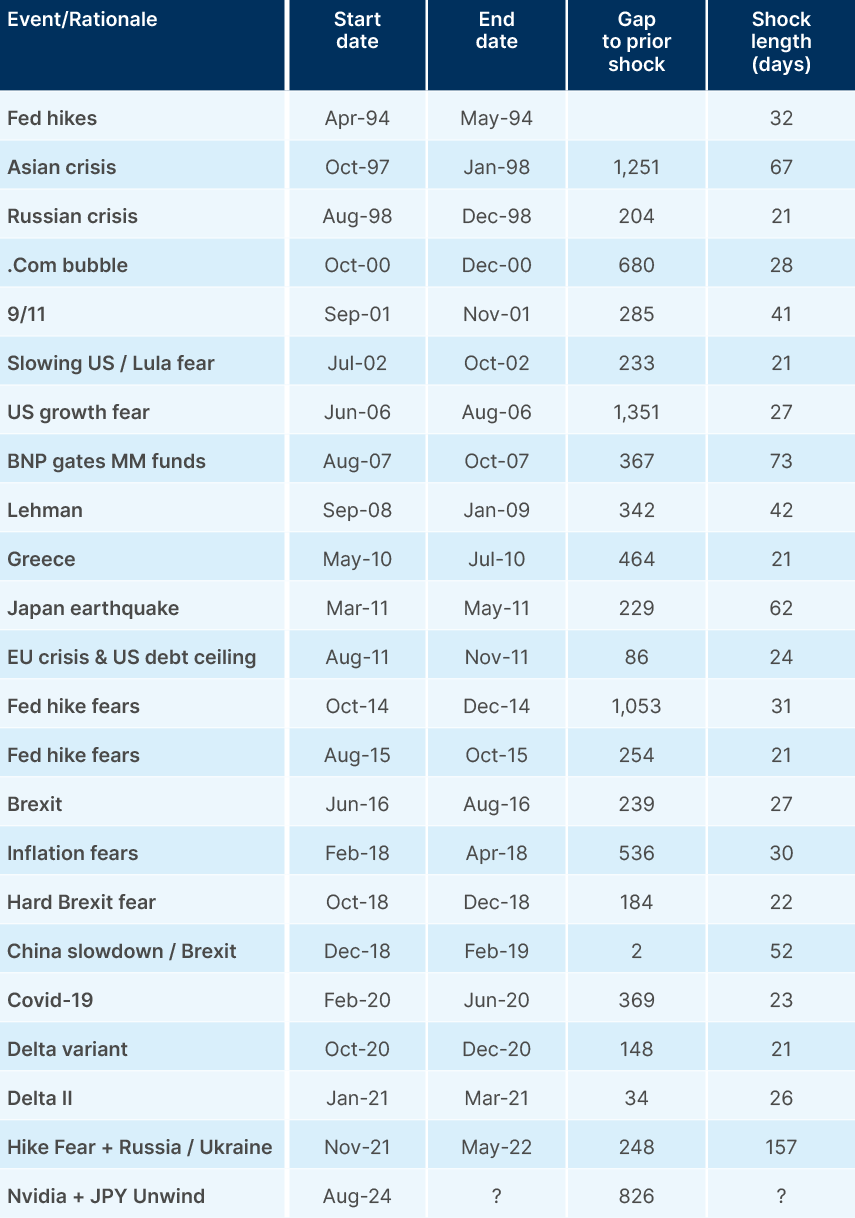
A key problem with following this rule is that it requires patience. The average period between volatility spikes over the last 30 years was 450 days, or five quarters. The previous Vix spike took place two-and-a-half years ago, when Russia invaded Ukraine, and the US Federal Reserve (Fed) started hiking policy rates after acknowledging inflation was out of control.
Over the last three decades, there were only three periods when the Vix took so long to ‘spike’ as it did in August, as per Fig 2. A long period between Vix spikes increases the risk of complacent valuations building up in risk assets.
Fig 2: Vix spikes, gap between and length (in days)
Buy the dip, but take your time
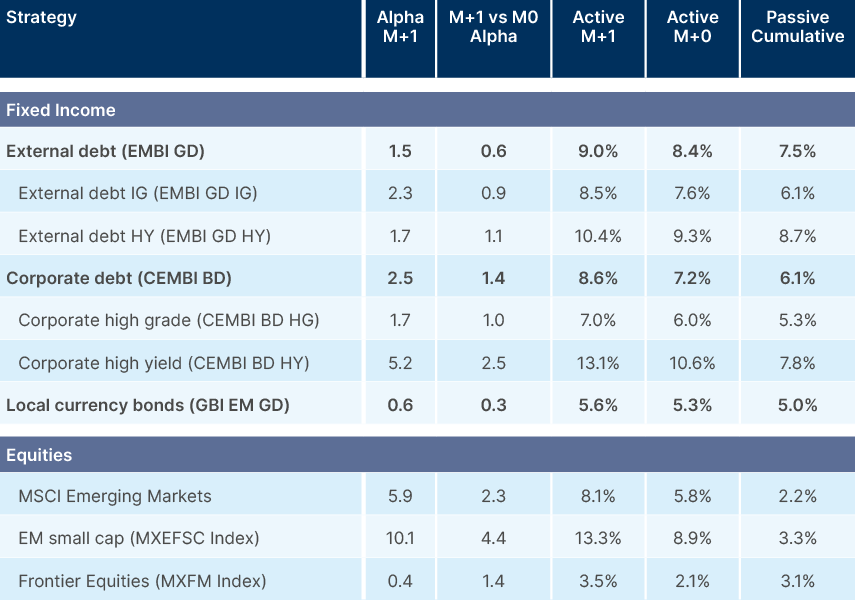
Historically, heightened volatility in markets often continues for a period beyond the initial VIX spike. With this in mind, we found that a simple rule of delaying the purchase by one month, and adding exposure at the end of the subsequent month to Vix spikes, would have improved the average ‘active’ returns across most asset classes, as per Fig 3. To be precise, by 63 basis points (bps) in EM sovereign debt, 137bps in corporate debt, 27bps in local currency bonds, 227bps in EM equities, and by 439bps in EM small cap. The backtest of this tactic also shows positive returns for FM equities.
Fig 3: Average returns investing during Vix spikes with 1-month lag vs. on the month of spike
Cyclical matters
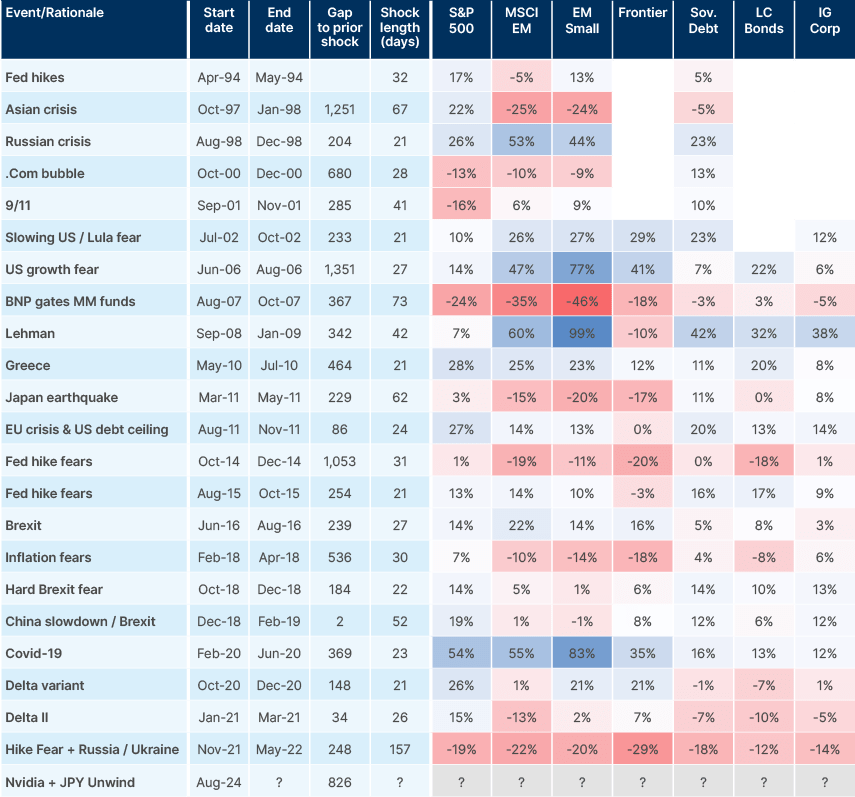
The delayed strategy is intuitive, but still may lead to poor decisions, depending on the stage of the cycle. Fig 4 shows that adding exposure to interest rate-sensitive assets in 2021 led to very poor returns within the next year.
In other cases, picking the right asset class made all the difference. EM outperformed after the 9/11 tragedy at the end of the dot.com bubble deflation, and was the right asset class to buy in all but one of the shocks until 2009. Buying EM equities and EM small caps one month after the Vix spike of 2006 delivered 60.3% and 98.9%, respectively over 12 months, significantly outperforming the S&P 500, which rose 7.0%. EM stocks also outperformed on the rebound from the Brexit and Covid-19 shocks. Conversely, US stocks outperformed EM after both 2011 shocks as well as 2014 and 2018.
Fig 4: 12-month returns per asset class when adding one-month after a Vix spike
In our view, we are about to witness a big rotation away from US assets into the rest of the world. In simple terms, US stocks outperformance was anchored by earnings. The revenue and earnings expectations of US equities going forward are consistent with US nominal GDP growth around the 6.5% level of the last 18-months. However, this has been challenged by the data recently and some analysts expect nominal GDP growth to be half this level within the next 18-months. In contrast, earnings growth remains subdued in many EM countries, leaving more room for upside surprises.
Furthermore, the current Vix shock started with rotation away from the mega-caps that had outperformed for the last decade or so into small caps and interest rates. The US election may well be a catalyst to accelerate this rotation. We discuss how US policies are likely to be more benign to EM than feared in our recent piece.4
Valuation matters
Of course, the valuation at the time of the Vix shock matters significantly. If asset prices were too expensive before the volatility, even a large knee-jerk reaction in asset prices may not present an opportunity.
Two sets of assets are interesting, in our view. The first are assets that performed well despite the Vix spike, which is a show of resilience built on fundamentals and valuations. The other set are assets that have sold off from undervalued levels, creating an opportunity should the fundamental picture for that asset class improve following the shock. The least attractive assets to add on a shock are overpriced assets where the fundamentals may face an adverse turn.
Rotating to EM bonds
We believe EM fixed income is a good example of an asset class that didn’t move much despite the Vix shock. Some analysts have been pointing out that credit spreads are too tight. But the fact is that overall yields remain very elevated. Therefore, when volatility increased last week, spreads widened by less than the decline in US Treasuries, leading to positive total returns. EM bonds currently benefit from improved fundamentals, including a better growth and inflation balance, than their DM counterparts. This has been rewarded by more credit rating upgrades than downgrades in the sovereign market, as we highlighted in June.5 The recent shock means the Fed is almost certain to start cutting policy rates and probably at a much faster pace than expected. This bodes well for EM local currency bonds, as central banks will have room to cut, and external debt.
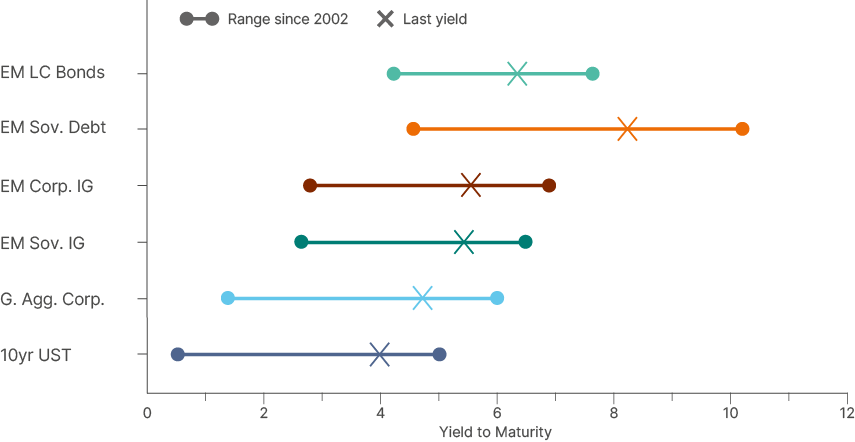
The case is even clearer in relative terms. The Fed is likely to bring Fed Fund rates down to 3.0%-3.5% within the next 12 months, in our view. One would think US Treasuries and investment grade (IG) assets would benefit the most. However, the US bond market suffers from poor technicals as the Treasury will need to issue around USD 10trn over the next 12 months to refinance its debt and fiscal deficit. That number would increase should a recession force the Fed to cut much more. Hence, we find it difficult to believe that 10-year yields can decline significantly from the current 3.95% levels, and we see 3.25% as a floor, in the absence of a vast recession, which is far from our base case. In contrast, EM IG bonds offer 5.5% and EM sovereign debt (50% IG & 50% HY) offers 8.2% yield to maturity. Both offer much higher total returns than pure US Treasuries or US corporate debt, in our view.
Fig 5: Yield to Maturity by EM Asset Class versus 10-year US Treasuries
This is not to say all assets are undervalued. Some parts of the single-B rated sovereign credit market remain relatively tight, particularly in countries that have not carried out any structural reforms or reprofiled debt in recent years. However, we see plenty of opportunity in turnaround stories like Argentina, which, at close to 1,500bps spreads, offers significantly more upside than downside. Crucially, this upside is not correlated with the overall cycle, but is driven by idiosyncratic structural reforms.
Several distressed credits have restructured their debt within the last year, meaning the next default wave is likely to be much shallower and shorter-lived than the post-Covid one. Therefore, a barbell strategy of long IG and reforming BB stories alongside distressed credits is likely to keep delivering outperformance and positive absolute returns even in a negative market environment, in our view.
Rotating to EM equities
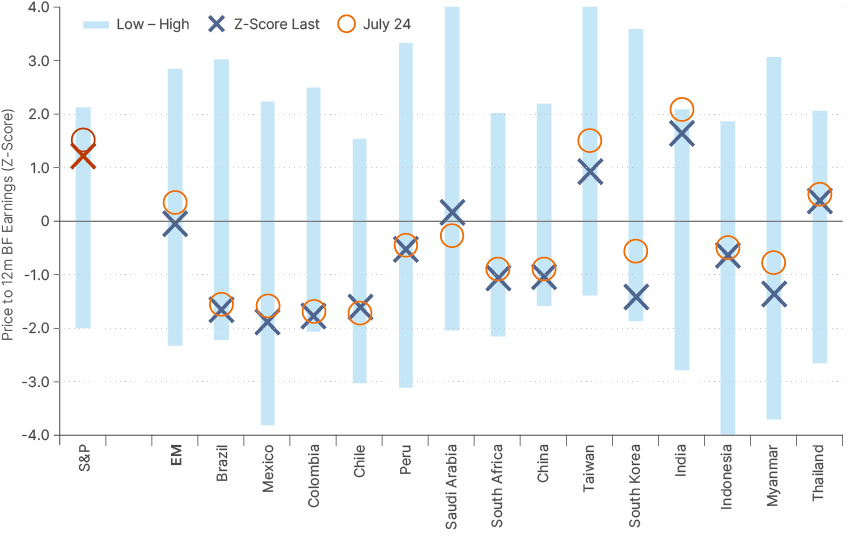
In equity markets, the opportunity is even more interesting. The vast majority of EM countries trade at the bottom of their valuation range, as per Fig. 5. Historically, that has allowed for higher total returns. Furthermore, the MSCI EM outperformed DM stocks both in the sell-off and the first recovery attempt month-to-date up to 9 August, demonstrating that for now, the greater risk is in DM investing, not EM.
It is also notable that Latin American countries and China barely moved as these markets were already very discounted. The bulk of the decline in valuations of EM equities came from Taiwan, South Korea, and Malaysia. These three markets have excellent secular opportunities that have become more accessible.
Fig 6: Price to earnings ratio (z-score) vs last 10-year high/low
This is an asset class – and a topic – that merits deeper analysis, which we will publish in a subsequent piece in late August to early September.
Conclusion
Being greedy while others are fearful pays. The backtest of average returns across volatility events shows investing in EM assets is alpha-accretive in these cases. But timing and valuation considerations matter.
The first spike of volatility after a long calm period is usually followed by a few weeks of choppiness. Adding exposure in the subsequent month to Vix spikes has an even better result, according to our study. The analysis also shows that cyclical considerations are often important to allocate capital to the right asset class during the dip.
But considering where we are now, with EM rates still high in absolute terms, we think the fundamental and valuation evidence for both EM debt and equity is now compelling.
Investors might therefore use the current volatility to add exposure.
1. See – ‘It is here again – the VIX spike!’, Market Commentary, 28 February 2020.
2. See – ‘Volatility is back’, Weekly Investor Research, 5 August 2024.
3. See – Active assumes investors buy at the month-end of the Vix spike. Based on monthly data. Passive is the cumulative annual return for the asset class since its inception.
4. See – ‘The US Election’s impact on Emerging Markets’, The Emerging View, 31 July 2024.
5. See – ‘The untold story of improving EM fundamentals’, The Emerging View, 31 July 2024.