
Investment Grade Emerging Markets Bonds in a Global Bond Portfolio: Diversifying Risk and Boosting Returns
In a world where ‘Emerging Markets’ (EM) is often equated with ‘risk’, it may surprise global bond investors to discover that adding investment grade EM bonds to a global bond portfolio can improve performance without incurring additional volatility.
In this paper we look at how global bond portfolios can benefit from the addition of investment grade EM sovereign bonds, investment grade EM corporate bonds or a blend of both. After a 10-year period in which investors in the Bloomberg Global Aggregate Index have experienced increased volatility of returns, and have experienced negative returns in half of those years, global fixed income investors should be interested in strategies that offer diversification while improving overall risk/return characteristics.
Understanding EM Sovereign and Corporate Bonds
Before shifting the discussion to how to implement such strategies, it is useful to recap what we mean when we refer to EM sovereign bonds and EM corporate bonds.
EM sovereign bonds are USD-denominated debt instruments issued by sovereign governments and quasi-sovereign institutions in countries that are included in the JPMorgan Emerging Market Bond Index (EMBI Global Diversified Index). As of Q1 2024, there are 69 EM countries with debt instruments included in the Index. This number fluctuates as new countries issue debt for the first time and as debt matures, which is in line with the inclusion guidelines determined by JPMorgan as the index provider. Of the 69 countries, 18 are currently rated investment grade.
On the corporate debt side, the JPMorgan Corporate Emerging Market Bond Index (CEMBI Broad Diversified) includes USD-denominated debt instruments issued by corporations domiciled in EM countries. Thirty-one countries included in the CEMBI Broad Diversified Index have corporate issuers rated investment grade.
The two indices together, therefore, include 34 countries available to investment grade investors. This offers investors an excellent opportunity to diversify their investment grade exposure across a wide range of EM economies and industries.
Strong economic fundamentals
GDP growth
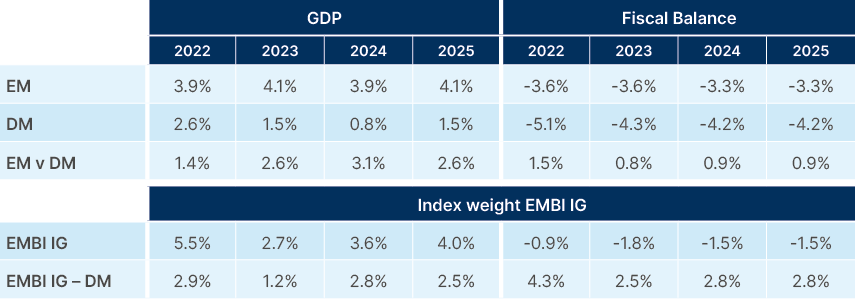
The rationale for including investment grade sovereign bonds rests on strong absolute and relative economic performance. The investment grade EMBI universe has, and is forecast to continue to have, a strong and steadily-increasing gross domestic product (GDP) growth premium compared to Developed Market (DM) economies. As the chart below highlights, index-weighted investment grade EMBI economies are expected to grow 2.8% faster than DM economies in 2024 and 2.5% faster in 2025, continuing a trend that was apparent in both 2022 and 2023. The advantage is clear on the fiscal side as well, with index-weighted EMBI Investment Grade fiscal balances exceeding those of DM economies by 2.8% in both 2024 and 2025.
Fig 1: GDP Weighted Economic Forecasts
Low public sector indebtedness
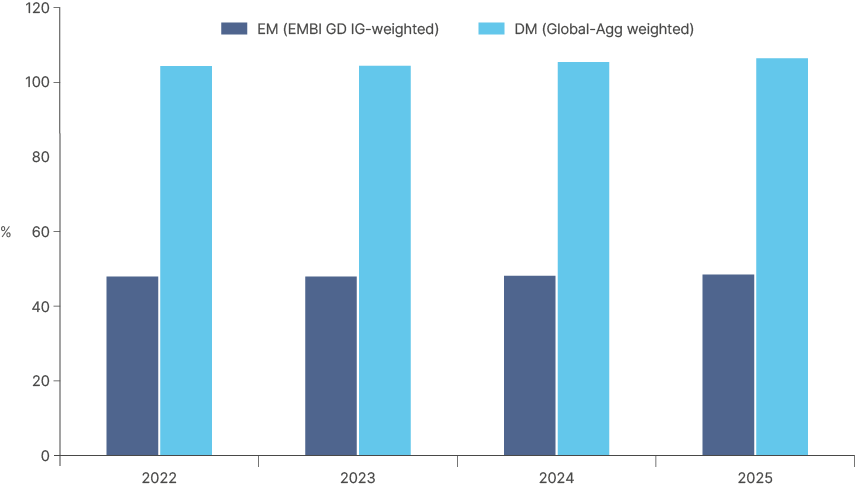
EM investment grade sovereign debt issuers compare favourably when considering debt metrics as well. As highlighted in the graph below, the average general government debt level of investment grade EMBI Global Diversified index constituents is just 48% of GDP, a level less than half of the government debt levels of DM countries included in the Bloomberg Global Aggregate Index. Countries saddled with high levels of government debt will likely spend a higher percentage of GDP on debt service, potentially crowding out public investment that would otherwise boost economic growth.
Fig 2: General government gross debt
With the fiscal and monetary policy hits to national economies attributed to the pandemic receding, the credit quality of the EM sovereign universe is on an improving path. For the first time since the start of the pandemic there are more sovereign issuers that have seen their credit ratings upgraded than downgraded. The investment grade universe could increase during 2024 as a select number of countries – notably Paraguay and Oman – are possible candidates for upgrades to investment grade status.
Investors in investment grade sovereigns also have the opportunity to invest in quasi-sovereign issuers, i.e., entities that are 100% owned by the sovereign and which carry comparable ratings to those of the sovereign. In many instances, quasi-sovereigns can offer substantial credit spread pickup over the sovereign, offering investors both additional alpha and diversification benefits, as quasi-sovereigns include a broad range of natural resource, financial, infrastructure and utility credits. China, Mexico, Indonesia and Malaysia alone have 40 quasi-sovereign issuers, all rated investment grade and with varying levels of credit spread pickup.
What advantages do investment grade EM corporate bonds bring to a portfolio?
The CEMBI Broad Diversified Investment Grade Index incorporates more than 500 individual issuers in 31 EM countries. This incredibly diverse group of issuers comprises companies that tend to be market leaders in their home countries and are characterised by strong management teams, solid balance sheets, stable income and steady access to funding sources. A number of EM companies are true global corporations with physical operations in multiple countries and diversified revenue sources.
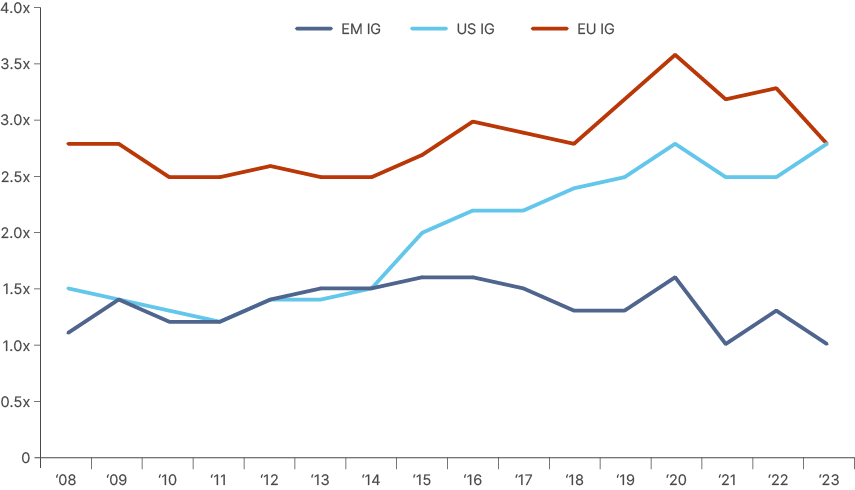
Importantly, as the following chart shows, EM corporate issuers have learned to operate with a lower degree of net leverage than their DM peers, as they sometimes operate in markets that experience higher levels of volatility and/or varying levels of liquidity.
Fig 3: Historical Net Leverage in EM IG credit vs peers
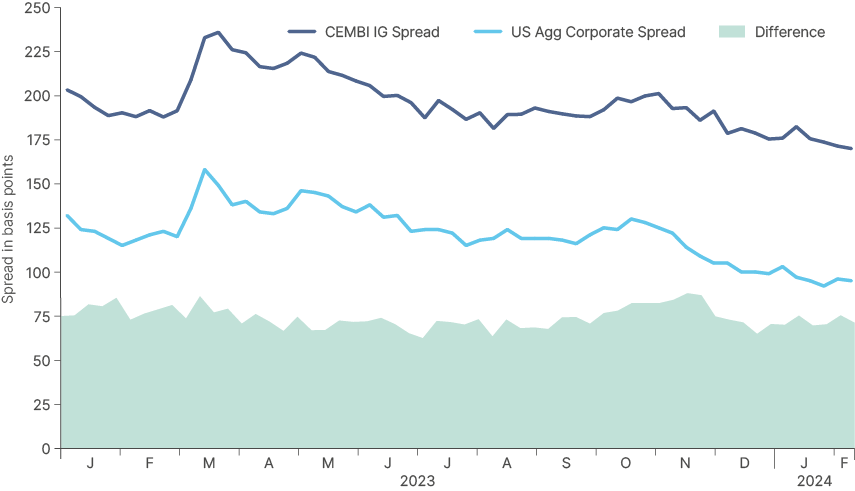
The EM corporate bond universe continues to expand, with an average of 29 new investment grade issuers entering the asset class annually over the last five years. This rapid growth offers investors additional opportunities to diversify their exposure to investment grade credits. At the index level, the CEMBI Broad Diversified Investment Grade Index offers investors a higher yield with lower duration (4.8 years) than the Bloomberg US Corporate Investment Grade Index (7.0 years).
From a return perspective, CEMBI Broad Diversified Investment Grade Index credit spreads present an attractive pick-up over the Bloomberg US Corporate Index, as shown in the chart below.
Fig 4: Spread difference: CEMBI IG vs. US Agg Corporate spread*
How does investment grade EM debt compare to global and US investment grade debt?
Despite episodic fluctuations, an analysis of the main global and US debt indices over the past two decades demonstrates that EM investment grade bonds have been better performers on a risk-adjusted basis. Notably, the EM Sovereign Investment Grade Index (EMBI Global Diversified IG) has delivered an annualised return of 5.3% since December 2001, with a volatility of 7.7%. Similarly, the EM Investment Grade Corporate Index (CEMBI Broad Diversified IG) has offered the same 5.3% annualised return with lower volatility at 6.4%. Compared to major global indices, EM investment grade indices exhibit favourable risk-adjusted performance, making them attractive for investors seeking higher returns without significantly increasing their volatility, as outlined in the table below.
Fig 5: EM investment grade indices exhibit favourable risk-adjusted returns
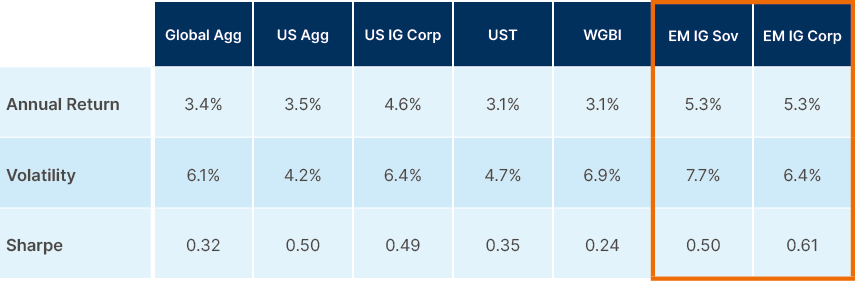
This confirms that a global bond investor can increase overall returns while managing volatility by incorporating exposure to EM debt in their global bond portfolio.
What are the optimal solutions for global bond investors?
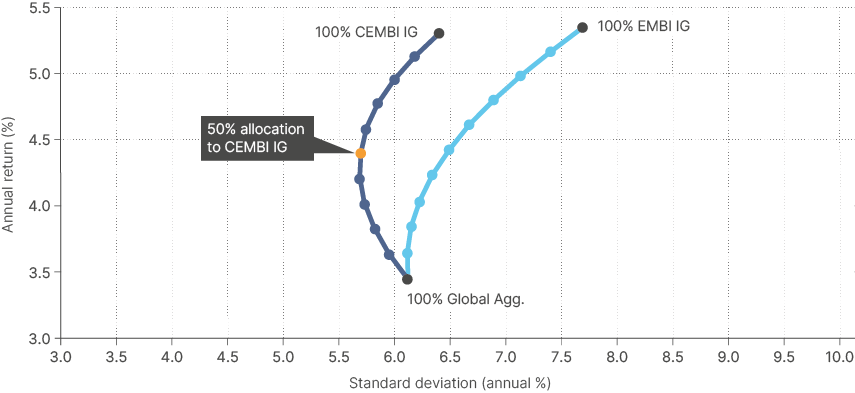
Putting theory into practice, we analysed the performance and volatility of the EMBI Global Diversified IG and CEMBI Broad Diversified IG indices against the Bloomberg Global Aggregate over a 20-year period. We can derive an efficient frontier by mapping the annualised returns against the volatility for both indices. Our analysis shows that shifting a 15% allocation to the JP Morgan EMBI Global Diversified IG Index in an existing Global Aggregate portfolio would increase the annualised returns by 30 basis points (bps) annually, with no incremental increase in volatility. On a three-year rolling basis, EMBI Global Diversified IG returns have exceeded returns on the Global Aggregate Index in 83% of the monthly observations since December 2001.
The outcome is even more compelling when incorporating the CEMBI Broad Diversified IG Index into a Bloomberg Global Aggregate portfolio. An allocation of 50% to the CEMBI Broad Diversified IG Index within a Global Aggregate portfolio can increase annualised returns by 100bps annually, while reducing portfolio volatility by 40bps. On a three-year rolling basis, CEMBI Broad Diversified IG returns have exceeded returns on the Global Aggregate Index in 84% of the monthly observations since December 2001.
Fig 6: Comparison: Addition of CEMBI IG instead of EMBI IG to Global Agg portfolio – since December 2001
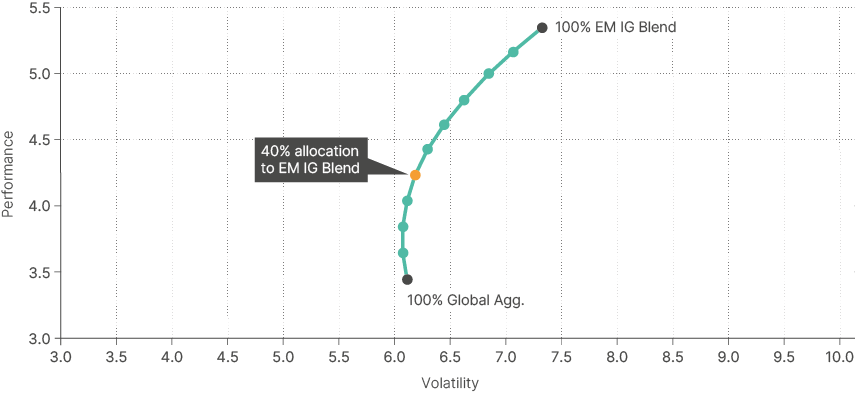
Investors looking to mirror the Global Aggregate’s asset allocation split of approximately two-thirds sovereign and one-third corporate exposure will find an optimised efficient frontier incorporating the above two EM indices. As the chart below highlights, a 40% exposure to a comparable blend of EM sovereign and corporate debt has increased performance by 80bps annually, with no discernible increase in portfolio volatility over the 20-year time horizon. On a three-year rolling basis, the blend of EMBI/CEMBI IG returns has exceeded returns on the Global Aggregate Index in 87% of the monthly observations since December 2001.
Fig 7: From Global Agg to EM IG Blend – since December 2001
Conclusion
Global bond investors can exploit significant advantages by incorporating investment grade EM bonds into their portfolios. This paper has demonstrated that both EM sovereign and corporate debt offer compelling benefits:
- Strong economic fundamentals: EM can boast superior GDP growth forecasts and healthier fiscal positions compared to DM.
- Credit quality: Investment grade EM issuers have lower debt levels and improving creditworthiness.
- Diversification: Including EM debt can significantly expand geographic and issuer exposure.
- Enhanced returns: EM bonds can offer attractive yields and historically delivered risk-adjusted returns exceeding global and US indices.
By strategically incorporating investment grade EM bonds, global bond investors can achieve a more diversified portfolio with the potential to achieve greater risk-adjusted returns. As the EM asset class continues to mature and expand, this strategy presents a compelling opportunity for investors seeking to enhance their global fixed-income portfolios.