
Traditional emerging market (EM) indices, such as the JP Morgan EMBI Global Diversified (EMBI GD), provide great yield enhancement for global fixed income portfolios. However, the high average duration of this index exposes it to volatility from global risk factors.
EM sovereign debt has seen an increasing bifurcation between a relatively narrow set of large, highly rated issuers, and many smaller, less liquid markets. The second tier, usually referred to as ‘frontier markets’ (FM), came under pressure in the aftermath of the pandemic, when many countries lost access to international capital markets.
Since then, FM countries have started attracting greater capital from investors looking for opportunities in lower duration fixed income products, driven by specific domestic factors, that are less correlated to the global interest rates cycle.
This paper outlines the main characteristics of this asset class, and explains how Ashmore approaches the opportunities and challenges it presents.
A dedicated allocation to an actively managed EM Frontier Debt portfolio gives investors the opportunity to:
- Benefit from attractive risk premia and all-in yields by participating in robust sovereign credits and high yielding foreign exchange (FX) instruments.
- Avoid incurring incremental volatility or higher correlation with typical global fixed income risk factors, such as US interest rates.
- Benefit from an alternative allocation in 2025 while larger EM countries are more exposed to ‘Trump 2.0’.
The FM debt universe
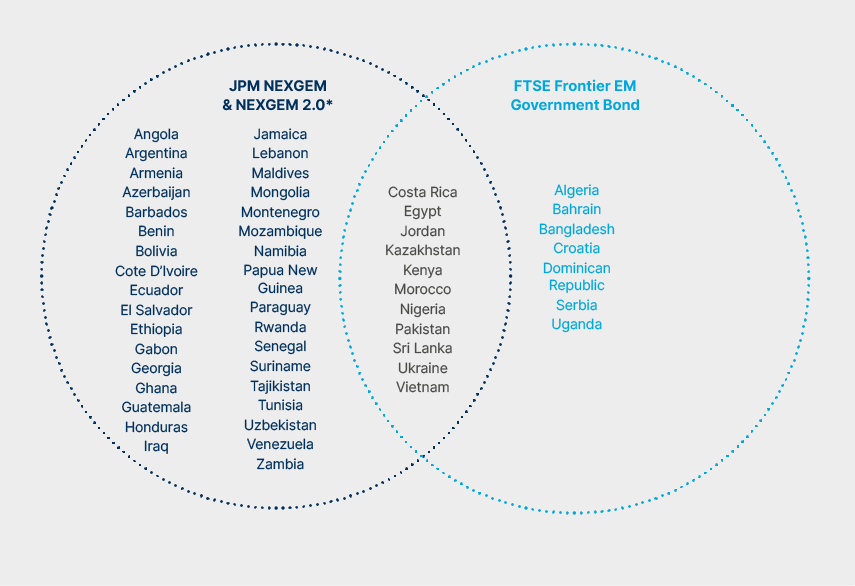
In contrast to EM equity markets, there is no single EM debt index that adequately captures the entire FM debt opportunity set, which encompasses both hard and local currencies. The most widely-used index is the NEXGEM, launched by JP Morgan in 2011, which only includes sovereign bonds denominated in US dollars. It can be characterised as a subset of the broader EMBI GD index, currently representing c. 17% of the market capitalisation of the EMBI GD. The FTSE Frontier EM Government Bond index is a more recent and less widely-used index covering a narrow set of FM local currency bond markets.
The market definition of frontier markets has evolved since the term was coined by the International Financial Corporation (IFC) in 1992. For Ashmore’s FM debt strategy, our definition of the investable universe uses the combination of both indices (Fig 1) as a starting point, and allows for the inclusion of other countries, opportunistically, as long as they exhibit lower levels of economic development, and thus are poorly represented within Global EM debt portfolios.
Fig 1: Ashmore’s definition of the Frontier universe
Characteristics of frontier market debt
Local currency: Attractive yields
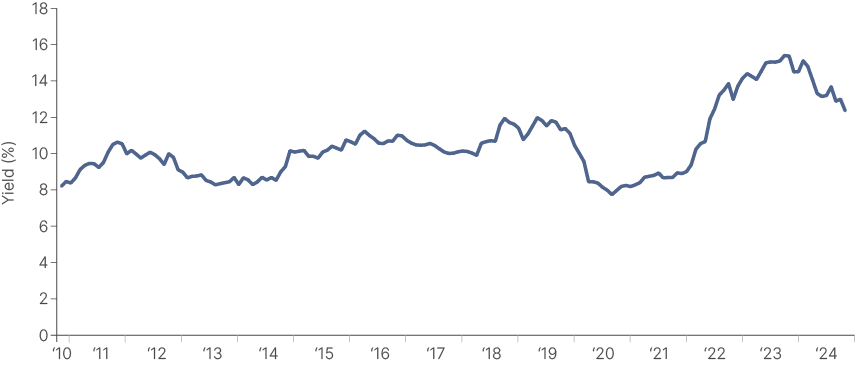
The inflation surge in 2021, followed by aggressive interest rate hikes by FM central banks, led to a doubling in average FM local bond yields between 2021 and 2023.
While progress against inflation, and resulting policy rate cuts, led to some reduction in headline yields, they remain very attractively positioned in the double digits, offering compelling carry opportunities for investors.
Fig 2: Average yield of an equal-weighted synthetic FM index1
Local currency: Attractive FX entry points
Following the drop in cross-border flows after Covid, several FM economies recorded significant balance of payment deficits. These external imbalances were addressed in 2023/24 by central banks adjusting their exchange rates lower (currency devaluation), thereby attracting foreign portfolio flows at cheap FX levels and increasing FX liquidity.
Carefully managed devaluations create conditions for balance of payments stability and thus for attractive excess returns in local markets. For instance, in March 2024, Egypt devalued the pound (EGP) by c.60%. In conjunction, the Central Bank of Egypt significantly increased its main interest rate by 600 basis points (bps). Local bond yields climbed over 30% in the wake of the devaluation, and the local market returned 27% from 6 March to year-end.
Hard currency: Attractive yields
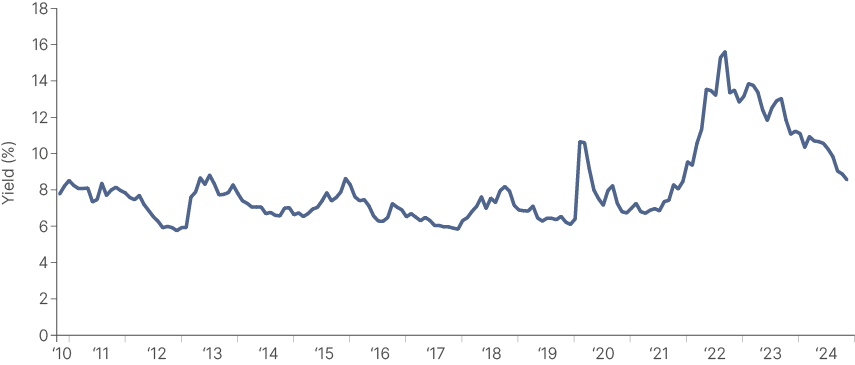
The Covid-related squeeze on foreign funding that peaked in 2022 pushed the NEXGEM index yield up to the mid-teens, a post Global Financial Crisis (GFC) record. These levels have offered excellent total return potential for dollar-based, risk-tolerant investors.
Fig 3: USD-denominated bonds (JP Morgan NEXGEM index YTM)
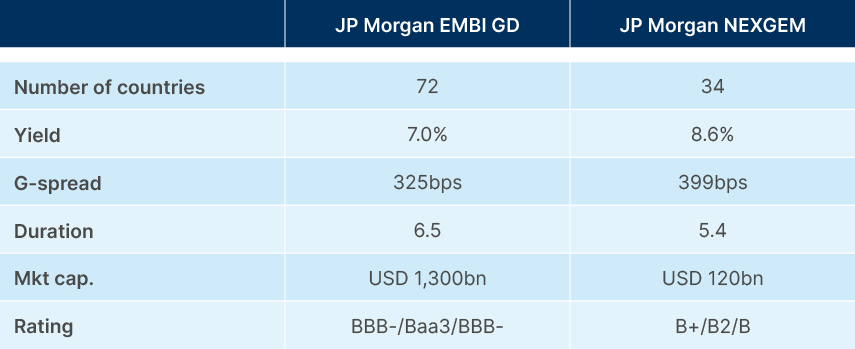
In addition to higher yields, FM dollar bonds also exhibit lower duration than traditional, broader EM indices, as shown in the table (Fig 4) below. These technical attributes make the risk-reward profile of a diversified portfolio of FM dollar bonds quite favourable.
Fig 4: Comparing the broader EM index with the FM index
Hard currency: FM debt performance
The JP Morgan NEXGEM index has significantly outperformed the JP Morgan EMBI GD since inception (Fig 5). This is to be expected, given the NEXGEM carries more risk. The index is currently limited to high-yield issuances, with an average rating of B+, compared with the EMBI GD’s average rating of BBB-.
However, the NEXGEM risk profile is distinct from the high-yield portion of the EMBI GD. The high yield constituents of the EMBI, 51% of the total index, have an average yield-to-maturity (YTM) of 10.12%, with almost a quarter of the high yield bonds single B or CCC rated. This suggests the high-yield portion of the EMBI index inherently carries more risk than the NEXGEM index, which has a YTM of 8.88% and no C-rated issuance.
Fig 5: Frontier NEXGEM index has outperformed the broad EMBI GD index since its inception
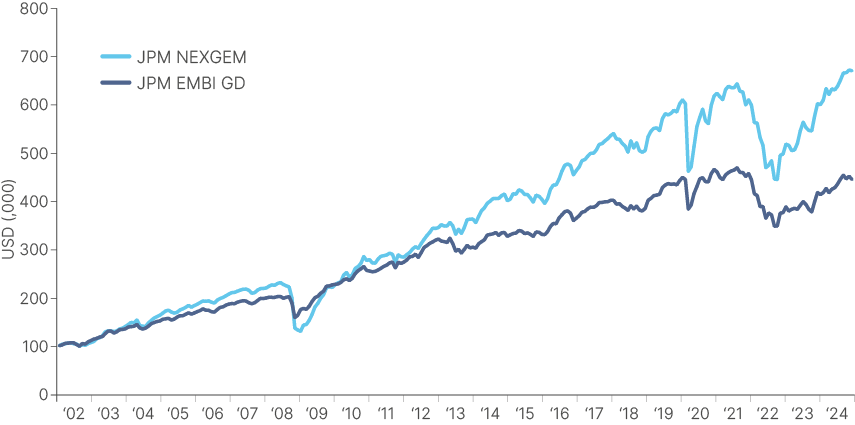
Strong returns have been supported by higher yields, but also by fewer defaults in the index. Since its inception in November 2011, NEXGEM has encompassed a narrower investment universe and consequently experienced five fewer sovereign defaults when compared with EMBI GD. Ukraine, Argentina, Venezuela, Lebanon and Ecuador all had a weightof over 2% of the EMBI GD in the 12 months prior to the default, which excluded them from NEXGEM.
The investment case for frontier markets
FM fundamentals
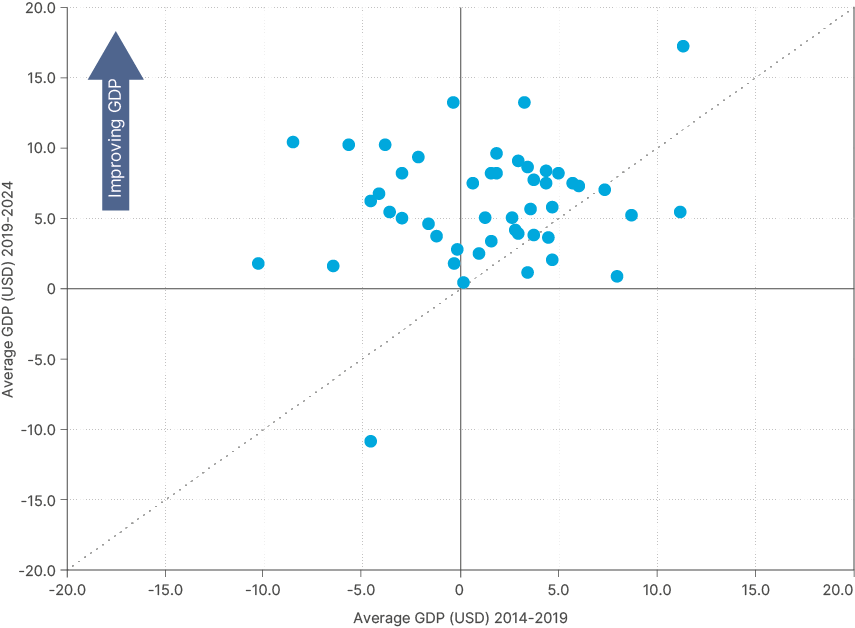
Frontier market economic fundamentals have advanced significantly over the past decade. When comparing the average GDP growth of the Ashmore Frontier universe from 2014-2019 to the next five years (2019-2024) we observe that most countries have accelerated impressively.
Fig 6: Average change in GDP growth (USD current prices)
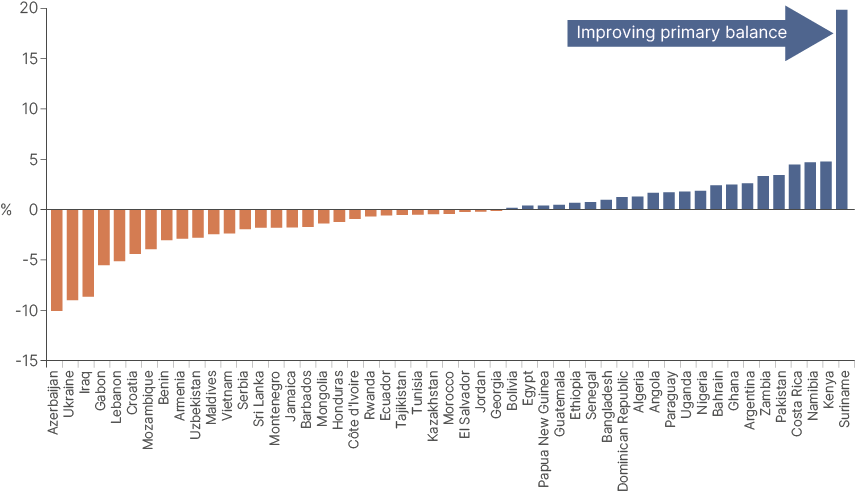
Many FM countries are also showing a stable or improving primary balance (government budget balance excluding interest payments). This shows that these nations are managing their budgets more effectively. Better fiscal discipline tends to foster economic stability and reduce default risk, lowering future borrowing costs as bonds become more attractive to investors. For investors in FM bonds, spotting these improving stories early can provide an opportunity for handsome price gains alongside double-digit carry.
Fig 7: Change in primary balance (2019-2024)
Low foreign investor participation across frontier markets has contributed to credit spreads remaining elevated, including in countries where fundamentals have been improving. As a result, there remains plenty of opportunity to exploit pricing inefficiencies in these assets. However, these high average yields reflect the reality that FM sovereigns can face challenges in servicing their hard currency debt.
Default events can lead to periods of higher volatility. However, debt exchanges or restructuring events, which today are usually backed by International Monetary Fund (IMF) support, have historically paved the way for improved debt sustainability, credit-rating upgrades and renewed market access for distressed sovereign borrowers.
Recent examples include Argentina’s restructuring of USD 65bn of external debt in 2020, leading to a credit rating upgrade from selective default (SD) to B-, and Ecuador’s restructuring of USD 17.4bn of bonds in the same year, resulting in a similar upgrade. This year, Zambia completed debt restructuring negotiations with a USD 1.4bn IMF credit facility, indicating a potential path towards an upgrade from its current CCC rating. These have been some of the strongest performing markets year-to-date, and investors willing to be patient can capitalise on exposure to these bonds as they exit distressed status.
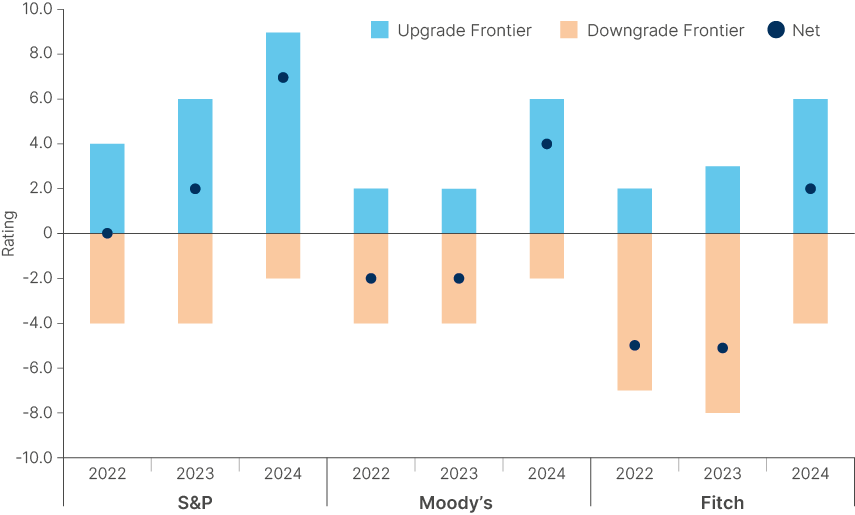
Since Covid, multilateral and bilateral financial assistance for FM economies has intensified. The IMF has stepped up with resilience and emergency loans and has helped many affected countries develop credible economic stabilisation programmes. This has restored investor confidence in the debt of several FM debt issuers and recently allowed for a marked improvement in FM sovereign credit ratings. Fig 8 plots the credit rating changes for FM economies in 2022, 2023 and 2024. It shows a noticeable improvement in the rating agencies’ upgrades/downgrades ratio.
Fig 8: FM upgrades have surpassed downgrades
Local currency volatility
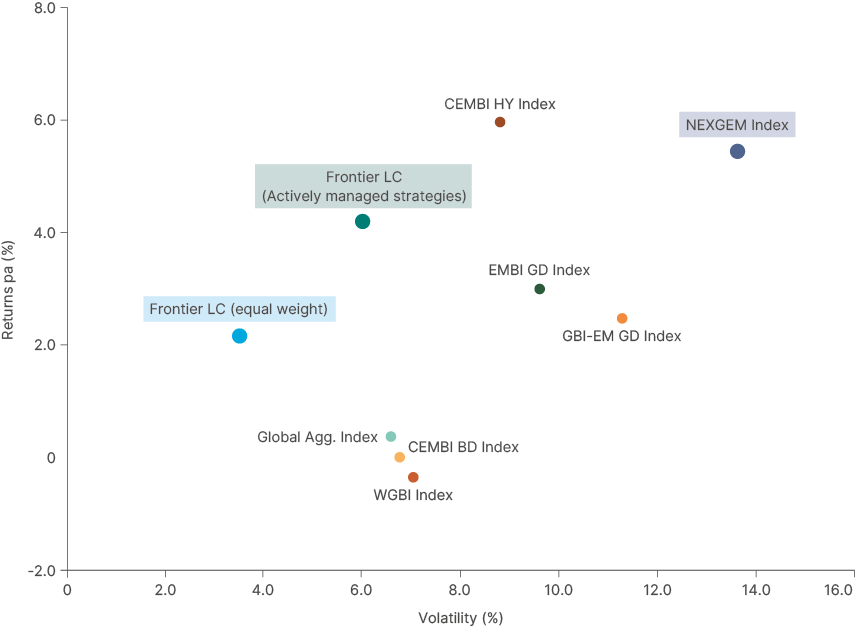
What may surprise the unacquainted is the low volatility observed within the local currency segment of FM debt – which is particularly prominent when compared with more traditional EM indices. Fig 9 illustrates that the equally weighted Frontier Index manages to keep volatility below 4%, a contrast to the EM equivalent (JP Morgan GBI-EM GD Index), which experiences volatility exceeding 10%.
Fig 9: EM Frontier indices vs. global bonds since Dec-2015
The first reason for the relatively low volatility of local debt instruments is the widespread availability of shorter duration instruments in the local currency markets in comparison to external debt instruments. For example, the average life of the bonds included in the FTSE Frontier EM Government Bond Index is seven years, but local currency FM debt products include a number of T-Bills and currency forwards maturing within 12 months.
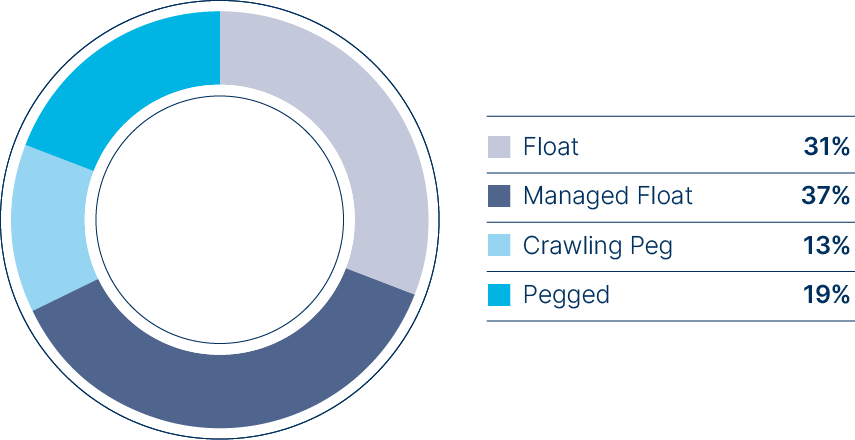
The second reason has to do with the widely adopted use of ‘managed’ currency regimes by FM central banks.
Fig 10: Exchange rate regimes in the Ashmore FM universe
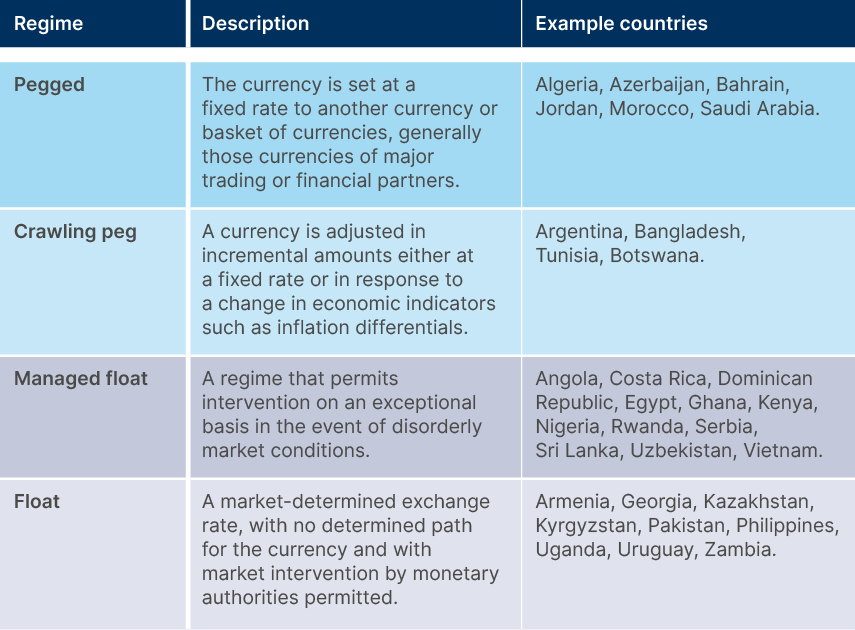
Fig 11: Breakdown of local currency exchange rate regimes (based on the equal weighted synthetic portfolio)2
Currency regimes are subject to changes, sometimes abrupt. An understanding of the nuances in the frontier exchange rate regimes allows active managers to anticipate, react and benefit from policy changes such as the establishment or removal of capital controls, and other regulatory shifts.
Local currency: Liquidity
Liquidity in FM local currency sovereign debt has improved over the last decade, because of important structural reforms that have improved domestic capital market infrastructure in a number of countries. The recognition of the benefits of a healthy local currency bond market is not new. In 2011, the G20 endorsed an action plan to support the development of local markets in EM. Since then, the IMF’s Monetary and Capital Markets (MCM) Department, as well as the World Bank, have been helping governments set up the necessary financial market infrastructure, including debt management offices, middle-office operations – pre-set issuance calendars etc. In FMs, the growth in local bond issuance has been led by countries like Vietnam, Nigeria, and Pakistan, which have managed to extend the maturity of their local bond curves and thus manage their fiscal deficits more effectively.
Although the local currency frontier debt market is still relatively young, and capital flows have been modest, the asset class is starting to attract a broader set of investors, drawn by the attractive yields and diversification benefits. FM debt trading volumes have increased sufficiently to motivate the creation of dedicated sales and trading teams by global financial institutions. This in turn creates a positive feedback loop of demand and supply, attracting more investors and improving liquidity in FM debt markets.
Ashmore Frontier Debt Strategy: a pure alpha approach
Ashmore is a global specialist dedicated to EM and FM investing, with a presence in the asset class dating back to the 1980s.
The Ashmore Frontier Debt Strategy is an extension of our existing EM debt investment platform, which has been in place for more than 30 years. Ashmore already manages c. USD 3bn in frontier debt exposure across other EM debt strategies. However, now that frontier debt has expanded, and liquidity has improved across a wider range of instruments, particularly in local currency, Ashmore is marketing its first dedicated strategy.
Ashmore’s investment capabilities and relationships already extend to most, if not all the FM debt markets. In addition, the Frontier debt research and portfolio management capabilities can draw from the insights of Ashmore’s Frontier Equities team that has been managing a dedicated Frontier strategy successfully since 2010.
The Ashmore Frontier Debt Strategy combines a focus on carry and an active approach to take advantage of periods of volatility. Careful country selection and diversification is key to deliver steady total return. The Strategy’s maximum exposure to a single frontier debt country (including FX) is 10%. It targets a total return of 8-10% per annum over the cycle, and a Sharpe ratio of 1.
The Strategy has been designed to invest in both external and local currency debt, and to manage the allocation across themes actively depending on market conditions. The spreads on frontier sovereign external debt securities tends to oscillate in a wide range and to mean-revert. In contrast, the returns pattern of frontier local debt instruments is more incremental and less volatile. Thus, the Strategy may shift towards sovereign external debt when spreads are wider, capitalising on future capital gains, and to switch back to local currency debt when sovereign spreads have tightened to increase exposure to less volatile ‘carry’ orientated positions.
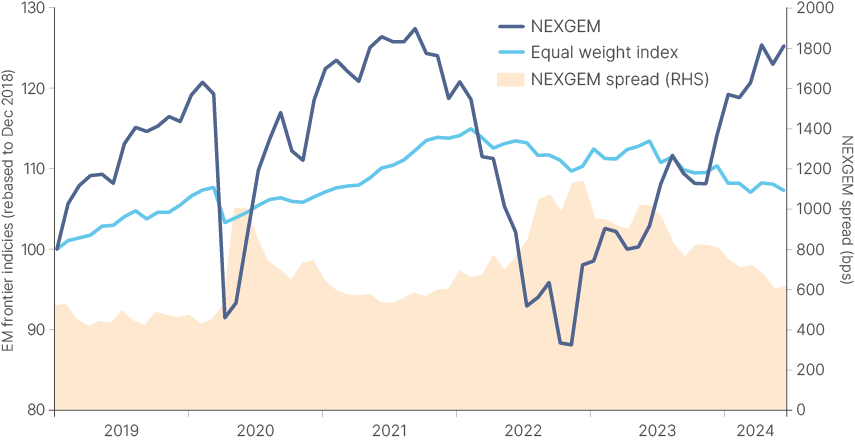
To demonstrate the returns that can be achieved through this approach, we have back-tested the implementation of a blended active strategy since 2018 (Fig 12). The back-tested approach transitioned to hard currency when NEXGEM sovereign spreads exceed 1,000bps, to capture the carry and future spread tightening. As shown in the graph below, when spreads (shaded area) exceed 1,000bps, the hard currency index (light blue line) performs well in the following months. Conversely, when NEXGEM sovereign spreads fall below 600bps, we propose shifting to local currency, to mitigate the volatility that may come from spreads widening.
Over the period, following this approach would have smoothed volatility and yielded an excess return of 12.9%, in comparison to 3.1% from a static 50/50 split over the period December 2018 – June 2024. While switching 100% of the portfolio between local bonds and hard currency bonds is unrealistic in practice, the back-test demonstrates how a nimbly managed blended approach to investing in FM debt can yield superior returns.
Fig 12: Back-tested implementation of a blended active strategy since 2018
Conclusion
Unlocking the potential of frontier market debt
The post-pandemic era has underscored the potential of FM debt as a rewarding and strategic addition to diverse portfolios. With some traditional EMs facing slowdowns – but with growth still outpacing developed markets – frontier markets present unique opportunities driven by youthful demographics, urbanisation, and access to natural resources.
The substantial yield premiums, coupled with improving liquidity and supportive IMF interventions, create an investment opportunity for astute investors. Ashmore’s expertise and active management approach position us to navigate these evolving landscapes, capturing significant growth prospects while mitigating inherent risks. Our global relationships and existing infrastructure ensure ease of access and execution in these burgeoning markets.
Frontier markets are not merely an extension of emerging markets, but also represent dynamic, high-growth opportunities that are set to play a crucial role in the future of global economic development.
1. Equally weighted average of the following 27 currencies:
AOA, ARS, AMD, AZN, BDT, CRC, DOP, EGP, GEL, GHS, KZT, KES, KGS, MAD, NGN, PKR, PYG, RWF, CSD, LKR, TND, UGX, UAH, UYU, UZS, VND and ZMK.
2. Equally weighted average of the following 27 currencies:
AOA, ARS, AMD, AZN, BDT, CRC, DOP, EGP, GEL, GHS, KZT, KES, KGS, MAD, NGN, PKR, PYG, RWF, CSD, LKR, TND, UGX, UAH, UYU, UZS, VND and ZMK.