
Is the Dollar forming a ‘bull-trap`?
Even though the medium-to-long term US Dollar fundamentals remain unimpressive, due to a combination of large external imbalances, a continuous dependence on foreign investors’ inflows and the weaponisation of the currency, the Dollar became the least bad currency in G4 since the beginning of the Ukraine war. After all, the US is the only country of the four largest blocks in the world (US, China, European Union, and Japan) that is a net exporter of strategic resources like energy and food, and therefore not suffering as much as the other economic blocks as these basic materials become scarce.
The US has become dependent on capital inflows to its overpriced equity markets
From a fundamental perspective, we believe the USD rally is unsustainable, as for it to continue requires more inflows to the greenback. However the US has become dependent on capital inflows to its overpriced equity markets. After all, foreign investors hold USD 14.8trn of US stocks and USD 7.7trn of US Treasuries in Q4 2021, the latest data from the US Treasury.1 The net between foreign assets and liabilities is a staggering USD 18.1trn, equivalent of 75% of the US GDP. As foreign investors realise that the secular outperformance of US stocks is unlikely to persist given current positioning and high valuations, rebalancing away from the US to other markets is likely to lead to a weaker, not stronger USD. While this is a long-term trend, in the short term there are a few factors suggesting the greenback may be peaking.
Market dynamics leading to the dollar index appreciation maybe close to a peak
The key market-related drivers for the strong increase in the Dollar index since February (Figure 1) was a combination of a more hawkish Fed (Figure 2), a weak JPY driven by what we see as outdated monetary policy by the Bank of Japan (Figure 3) and increased political and geopolitical risks in the Euro Area. With the USD index more than 10% above its post-covid lows, several analysts are calling for a breakout higher in the Dollar Index. We believe a US dollar ‘bull trap’ may be forming as all these dynamics are close to a peak, in our view. To be sure, the key levels may still be broken, but further large moves from here are unlikely to prove sustainable.
Figure 1: Dollar index spot price
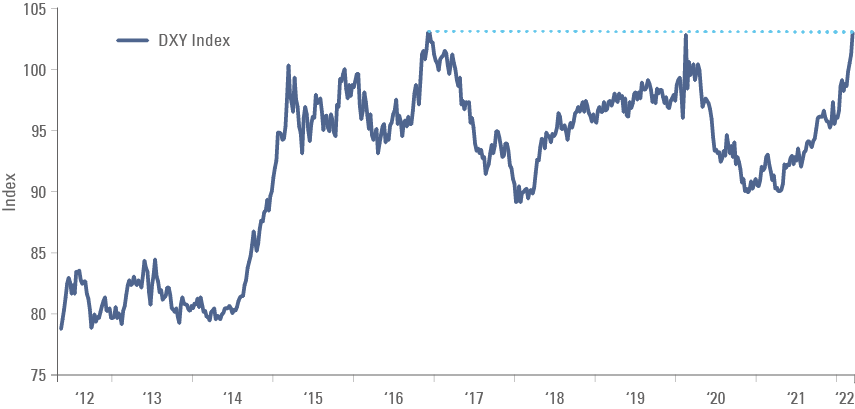
Figure 2: A more hawkish Fed
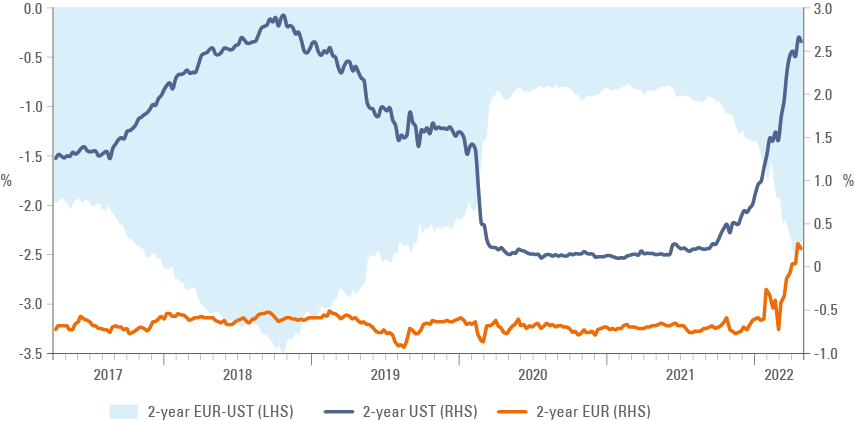
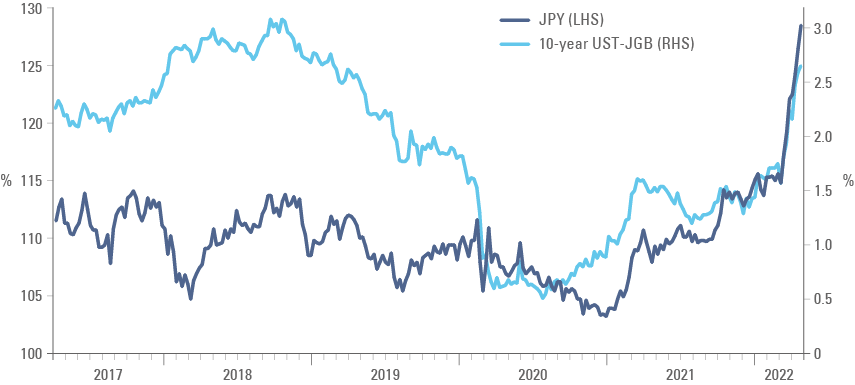
Figure 3: JPY yield differential driving Yen weaker
Europe
In Europe, French President Emmanuel Macron has just won the presidential election, putting him in a good position to remain a strong leader within Europe, driving more public expenditure across the block.
The negative impact of the war maybe largely priced
On the Ukraine conflict, after taking Mariupol, Russia effectively controls the sea of Azov, giving Russian President Vladimir Putin an opportunity to call victory over a strategic objective. The key question remains how interested Russia is (and whether it has the resources necessary) to push all the way to Transnistria (the strip of land in East Moldova with a pro-independence movement) and cut off Ukraine entirely from the Black Sea. We acknowledge that it remains hard to predict the outcome of the war and its paths, but the consensus seems to have converged to a long and protracted war at a time that the Russian ability to fight one is under question after severe personnel and equipment losses in the first two months. The key question for European assets and the EUR is whether the war is fully priced in. We believe these dynamics are by now largely priced.
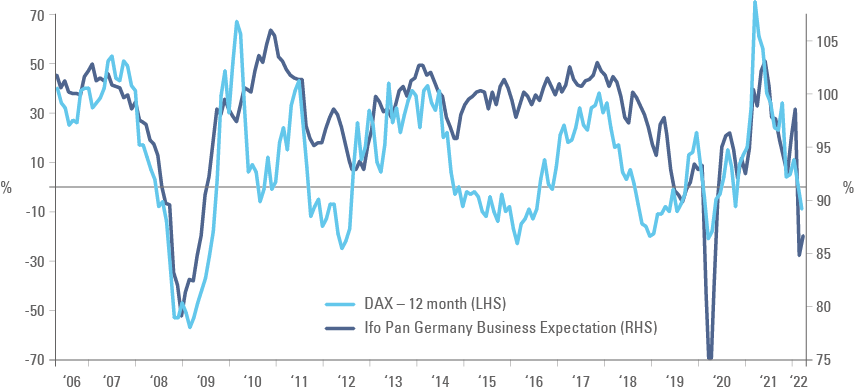
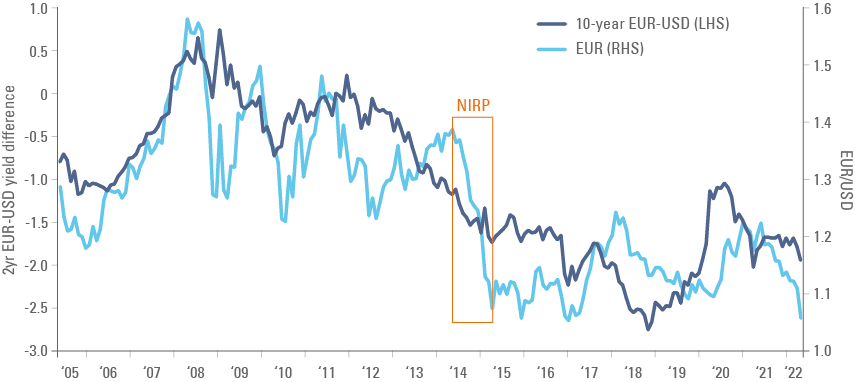
Figure 4 suggests that confidence has already declined to levels seen only during the 2008 financial crisis and the pandemic, with German stocks responding accordingly. At the same time, the EUR seems to be underperforming its fundamentals. The currency is trading below the levels compatible with the current interest rate differential between EUR and USD interest rates as per Figure 5 and has yet to reprice the ECB moving away from negative interest rates policy (NIRP), a move that many ECB board members consider likely already in 2022.
Figure 4: DAX vs. IFO Germany Business Expectations
The EUR underperformance sits at odds with reversal of NIRP by the ECB
Figure 5: EUR vs. 10-year EUR vs USD interest rates differentials
Japan
Last week Janet Yellen and Shun'ichi Suzuki discussed the weakness in JPY during the G7 Finance Minister meeting prior to the IMF Spring meetings. This followed comments from Suzuki saying that he was uncomfortable with the pace of depreciation of the JPY. In our view, the BoJ policy of capping the 10yr at 0.25% is not the smartest move in the current environment. The central banks from commodity importing countries should be trying to stabilise or strengthen their currencies in order to avoid exacerbating the current supply chain shock. By keeping the yield curve control cap, the BOJ is persisting with a ‘weak JPY’ policy (beggar-thy-neighbour) that was better suited when the world had a deflation problem and no supply shocks. Increasing the cap on the 10-year yield or scrapping it altogether would in effect make the JPY stronger while higher yields on JPY would allow Japanese investors to buy US Treasuries on an FX hedged basis (buy USD/JPY spot, sell USD/JPY future) at a more attractive level, hence, helping to support US Treasury yields, thus indirectly backstopping the current sell-off in global rates.
The BoJ policy to depreciate the JPY is outdated and unsustainable, in our view
The Fed
The Fed is most likely going through its second policy mistake in two years, in our view. The first was to keep interest rates too low for too long considering the massive fiscal injection leading to a sharp increase in demand for goods during the covid-induced supply shock. Now we are dealing with a second supply shock in commodities due to the war in Ukraine. The second supply shock is negative for aggregate demand as food, energy, and metal price increases make everything more expensive at the time that the consolidation of fiscal deficits leads to a normalisation of monetary aggregates and a decline in inflation-adjusted disposable income. The text-book response to a supply shock is to look through the primary effect and contain expectations, not hiking aggressively as the Fed has recently pledged to do.
The Fed is doing so because it was too far behind the curve initially. As its hiking cycle deals a further blow to financial conditions (higher mortgage rates, higher credit spreads on corporate bonds and lower equity valuations), it may well face a dilemma of either crashing the economy or lowering inflation. In other words, the Fed can do little to alleviate the current supply shock resulting from higher commodity prices: hiking rates and shrinking the balance sheet will not alleviate the shortage of commodities, unless the tightening is significant enough to lower demand (a recession). This would hardly be a positive scenario for the Dollar, considering the large exposure foreign investors hold to US stocks today.
The Fed hiking cycle maybe close to fully priced
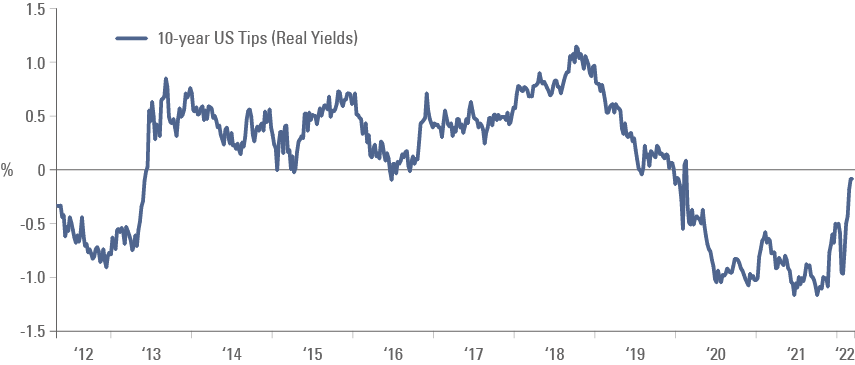
Whereas the Fed must sound hawkish on inflation today for political reasons, it would be even worse if it crashed the economy ahead of mid-term elections. Therefore, the Fed is unlikely to deliver all the hikes currently priced, in our view, and a U-turn to a dovish stance is warranted as financial conditions tighten. Fundamentally, the US economy cannot withstand real rates much above the current level around 0% (Figure 6) in our view, particularly considering how much DM government and corporate debt has increased during the pandemic.2
Figure 6: US 10-year real interest rates
EM debt
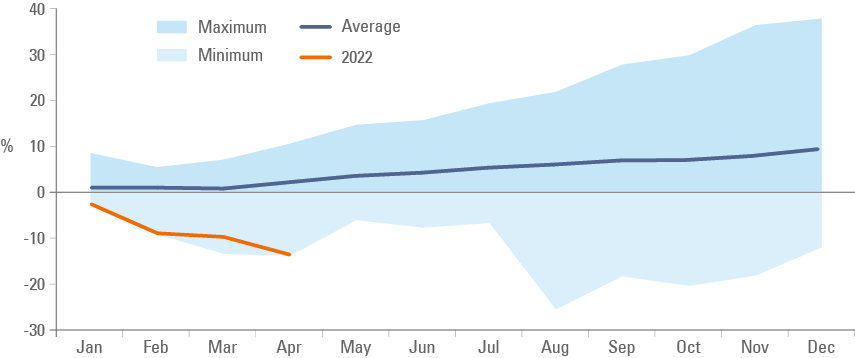
The JP Morgan EMBI Global Diversified index had the worst start of the year since 1995 with a drawdown of 13.9% on a year-to-date basis as per Figure 7. Interestingly, the poor returns year-to-date are not primarily related to Russia-Ukraine, but due to massive 9.2% losses from US Treasury returns. The drawdowns from Russia and Belarus represent around a 3.2% loss at the index level whereas spread widening across all other countries combined led to a further 2.1% loss.
Hence, if the main source of detraction to EM debt stops deteriorating (yield on US Treasuries peaking) most likely EM Dollar denominated debt returns are likely to improve from here.
The EMBI GD had the worst start of the year since 1995 mostly due to wider US Treasury yields
Figure 7: EMBI GD Returns Since 1995
This is particularly true considering credit spreads in EM debt have rarely widened by such a large magnitude in months when US Treasury are trading wider as well. Month to date, the credit spread on the EMBI high yield is 35bps wider in a month that 10-year UST widened 42bps. A simple regression shows EMBI spreads widened when UST was higher by more than 40bps in only three months (or 1% of the time) since April 1999 as per Figure 8.3 EM Sovereign high yield credit spreads are currently sitting above 700bps (Figure 9) when US Treasury of equivalent maturity is close to 3.0%, providing a double-digit yield-to-maturity.
Lastly, this is only the third time since 1993 that the EMBI GD has four consecutive quarters of negative returns. In 1994 a similar streak of losses was followed by a 20% rebound while in 2006 four consecutive red months was followed by a 10% rebound in the asset class.
Figure 8: EMBI GD spreads vs. 10-year UST
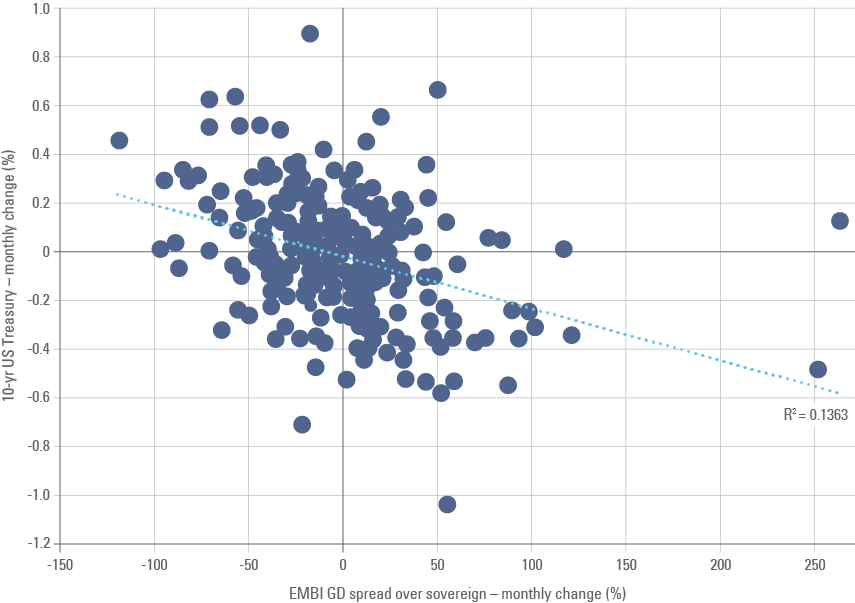
Credit spreads widened together with US Treasury, a rare event
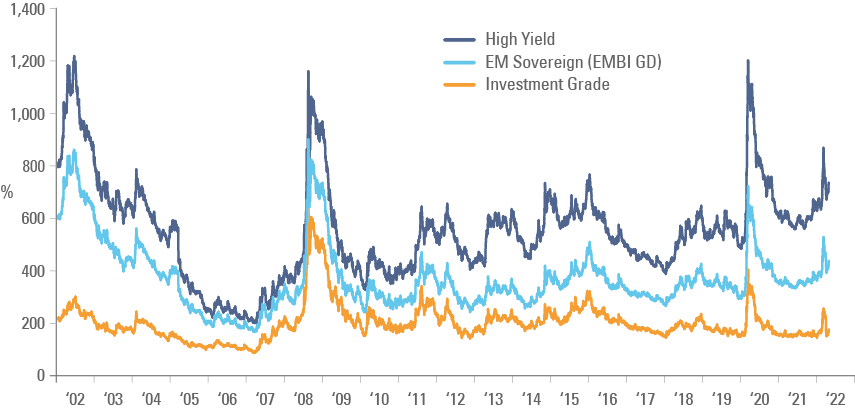
Figure 9: EMBI GD spreads since 2001
In this sense, EM hard currency debt can be seen as a proxy for other EM asset classes, which are under owned and unloved just as structural factors, such as higher commodity prices, are shifting to favour several countries in the asset class.
Conclusion
Emerging market assets underperformed over the first four months of the year as market participants priced in a much more hawkish hiking cycle by the Fed. At the same time, higher interest rates differentials buoyed the greenback lead the US Dollar index to test key levels. It is very likely that the Fed will end up delivering much more modest hikes than priced, as we assume the Fed will become more concerned about growth as mid-term elections approach. Market participants are currently pricing an environment where the USD can only strengthen, but we believe this is well priced in and the long USD position is crowded, hence leading to a potential USD “bull-trap”. The impact of the reversal of the current dynamics on rates and currencies would be positive for EM assets, in our view.