
Smaller stars shine brighter: Investing in Latin America’s Seven Sisters
Investors in Latin America with a focus on liquid instruments naturally gravitate towards the largest countries in the region. Brazil, Mexico, and Argentina jointly account for 82% of fixed income and some 88% of listed equities in Latin America. However, large country size does not equate with large opportunity. When it comes to illiquid investments in particular, such as private equity and infrastructure, the key criteria for successful investing are stable economic performance and predictable policy frameworks.
This is why the case for considering illiquid investments is particularly strong in some of Latin America’s smaller countries. The Seven Sisters – Colombia, Peru, Ecuador, Panama, Costa Rica, Dominican Republic, and Guatemala – together make up about a fifth of Latin America’s GDP. As a highly nuanced group of countries, they are representative of the region as a whole, yet they perform stronger economically and have superior policy frameworks compared to the rest of Latin America. In other words, they have fewer of the downside risks that can accompany investments in the larger countries in the region.
This report outlines the key economic and policy features of the Seven Sisters in Section 2 and compares them to the rest of Latin America in Section 3. Section 4 describes the broader case for investing in Emerging Markets (EM) right now with specific focus on key issues, such as Covid-19, growth rates, debt, and the outlook for EM currencies, stock, and bonds.
1 | The Seven Sisters – a diverse offering
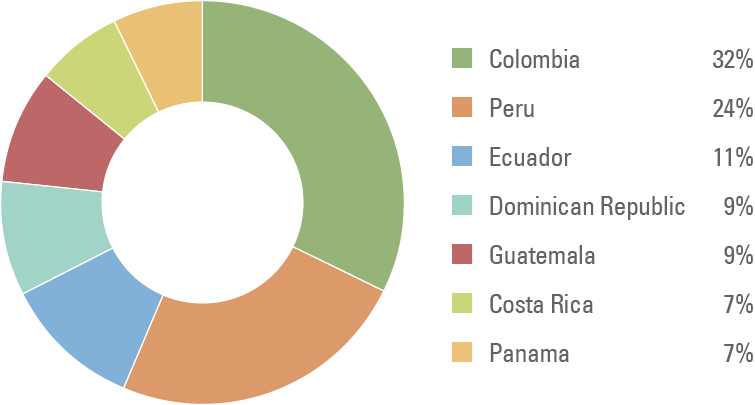
Colombia, Peru, Ecuador, Panama, Costa Rica, Dominican Republic, and Guatemala make up a fifth of Latin America’s gross domestic product (GDP), or approximately USD 830bn (Figure 1). Although they only comprise seven of Latin America’s 33 countries, they are a highly nuanced group, whose differences make them representative of the broader Latin American region and contribute to diversification. There will be opportunities in one or more of the seven countries at any one point in time.
Fig 1: Seven Sisters’ GDP shares (based on IMF estimate of 2020 current GDP in USD)
Colombia and Peru
Colombia and Peru account for 56% of the combined GDP of the Seven Sisters. Colombia is the largest country in the group with a GDP of USD 265bn, or 32% of the group’s total. Peru is the second largest member with a GDP of USD 196bn (24% of total Seven Sisters’ GDP). Investment grade rated, Colombia and Peru both have strong records of credible macroeconomic policy management. They are highly diversified economies with larger industries spanning services, manufacturing, and multiple types of primary industries. Domestic financial markets are broad and deep in both countries. There is respect for property rights, good quality infrastructure, and well developed financial institutions.1
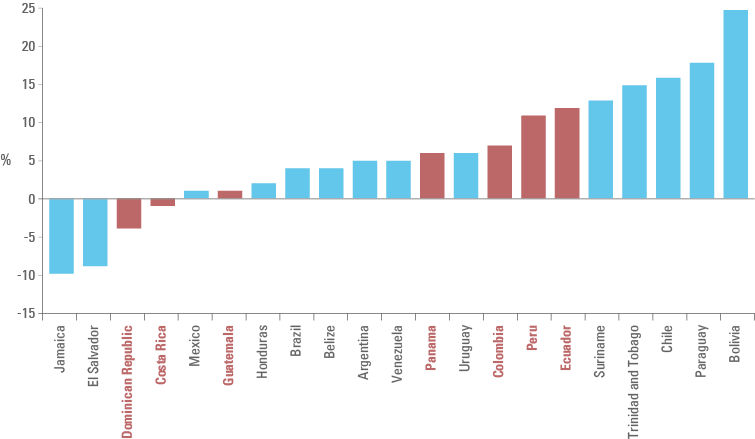
Export performance depends to some extent on commodity prices in both countries. Colombia is a net oil exporter, while Peru is an oil importer, which specialises in exports of ores and minerals. This important difference between the two countries introduces a natural element of diversification. Both countries also import commodities, so net commodity exports as a share of GDP is mid-range in the Latin American context as shown in Figure 2.
Fig 2: Net commodity exports as % of GDP (Seven Sisters in red; average 2004-2018)
In terms of fundamental risks, Peru is heading for a general election next month the outcome of which is highly unpredictable. Peru’s parliament has historically been highly fragmented, but political noise has rarely translated into economic problems and the post-election period should usher in calmer politics, even a chance for economic reforms. Colombia’s main challenge in 2021 is to pass a critical tax reform without which the country could struggle to hold on to its sovereign investment grade rating. Both the Peruvian Sol and the Colombian Peso trade near multi-decade lows in real terms, so there should be significant value in local currency-denominated assets going forward, given the negative outlook for the Dollar. More on the outlook for the Dollar later in this report.
Panama, Costa Rica, Dominican Republic, and Guatemala
Panama, Costa Rica, Dominican Republic, and Guatemala bring slightly different attributes to the Seven Sisters collective. Net commodity importers, Costa Rica, Dominican Republic, and Guatemala are primarily service and manufacturing-based economies. Panama has long been established as a major global financial services and transportation/logistics hub as well as a ‘safe-heaven’ destination for capital flows due to the use of the US Dollar as the country’s official currency. Costa Rica, Dominican Republic, and Guatemala have strong reputations for conservative economic management. They specialise in tourism, often of the eco variety, as well as manufacturing. They receive considerable volumes of remittances from the US. While tourism has experienced severe setbacks during the coronavirus pandemic, the temporary decline in tourism revenues has to a large extent been offset by lower oil prices and higher remittances. On account of their long track records of sound policy management, Panama, Guatemala, and Dominican Republic readily qualified for financial support from the International Monetary Fund (IMF) during the height of the pandemic last year. Only this week, Costa Rica secured a USD 1.8bn programme with the IMF.
Ecuador
Ecuador stands out from the other ‘sisters’ on account of the country’s long history of economic and political instability. As such, Ecuador should be viewed as the ‘option value’ country within the group. In 2020, Ecuador was badly impacted by a triple shock of falling oil prices, capital flight, and a particularly severe outbreak of coronavirus in the coastal region of Guayaquil. Ecuador regained market access after a record-quick restructuring with rare consensus between the government and bond holders in regard to the country’s reform needs as well as the term structure and conditions of the re-profiled debt. It remains to be seen if the successful debt restructuring proves to be a turning point in Ecuador’s erstwhile fraught relations with global capital markets. Ecuador heads to the polls to elect a new parliament and a new president on 7 February 2021. The outcome is binary with one market-friendly candidate and two other candidates, one who answers to former populist strongman Rafael Correa and the other, who draws support from indigenous groups. Whatever the outcome, crises have a habit of creating opportunities; if Ecuador’s election outcome is market-friendly then this country could present some extremely interesting investment opportunities over the next few years.
2 | Pick of the bunch in Latin America
With the possible exception of Ecuador, the Seven Sisters stand out from the rest of Latin America due to generally sustained stronger and more stable economic performances and higher quality of policy making. They have therefore been able to cope better with shocks and business cycles. The rest of this section lists the main advantages of the Seven Sisters over the rest of Latin America:
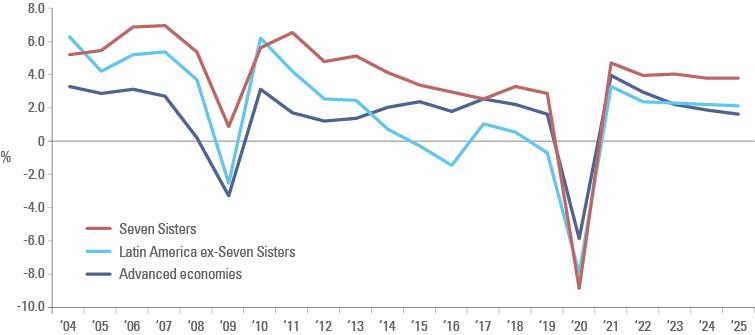
Steadier and higher rates of real GDP growth: The Seven Sisters stand out from the rest of Latin America in that their real GDP growth rates have been both higher and less volatile (Figure 3). They do not perform any worse than other Latin American countries during extreme global downturns events, such as the Global Financial Crisis in 2008/2009 and the 2020 coronavirus pandemic, while they maintain higher and more stable growth rates in the intervening periods.
Fig 3: Real GDP growth (%)
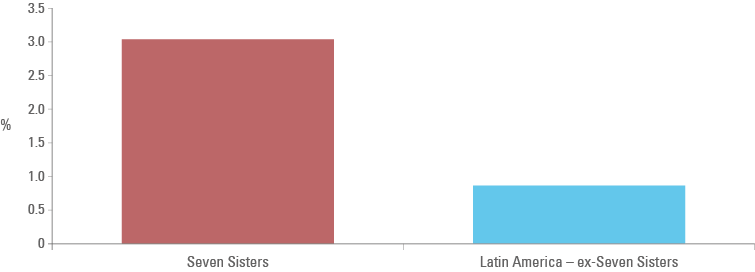
Per capita GDP growth: The Seven Sisters have delivered sustained higher per capita real GDP growth rates than the rest of Latin America. Per capita real GDP growth rates are an important determinant of social-economic conditions. Countries with higher per capita real GDP growth rate experience greater tangible improvements in living standards and tend to have more stable political conditions. Between 2005 and 2019, the Seven Sisters delivered average annual per capita real GDP growth of 3.1% compared to just 0.9% for the rest of Latin America (Figure 4). The IMF expects this trend to continue; the Seven Sisters are projected to deliver nearly twice as fast per capita real GDP growth over the next five years than the rest of Latin America.
Fig 4: Per capital real GDP growth (2005-2019)
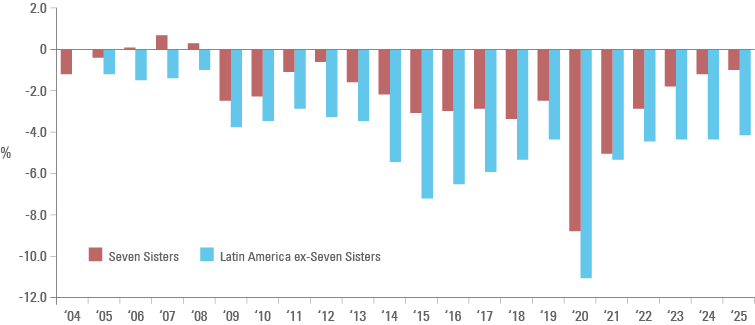
Fiscal policy: Mismanagement of the public finances is the single most important source of macroeconomic shocks in EM. Countries with fiscal discipline therefore have more stable and predictable business environments, which in turn encourages investment. The Seven Sisters have consistently delivered more orthodox fiscal policies than the rest of Latin America with fiscal deficits averaging 2.2% of GDP since 2004 compared to 4.4% of GDP for the rest of Latin America (Figure 5).
Fig 5: Government net lending/borrowing (% of GDP)
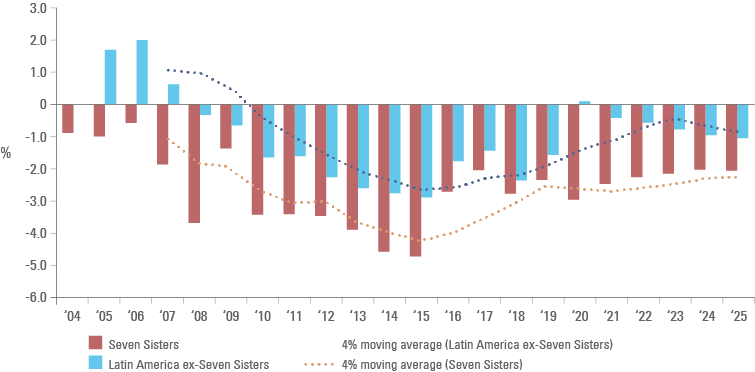
External balances: On account of their superior macroeconomic policies, sustainable debt burdens, stronger institutions, and greater political stability the Seven Sisters have been able to secure greater access to foreign financing capital on a sustained basis than other Latin American countries. In turn, this allows the Seven Sisters to run wider current account deficits (Figure 6). Better access to foreign capital is a clear positive for the group, because foreign capital is critical for the ability to invest and grow. The Seven Sisters run smaller fiscal deficits than the rest of Latin America, so it follows that the private sector is the main recipient of foreign capital. This is consistent with the observation that the Seven Sisters have higher trend growth rates than the rest of Latin America.
Fig 6: Current account balances (% of GDP)
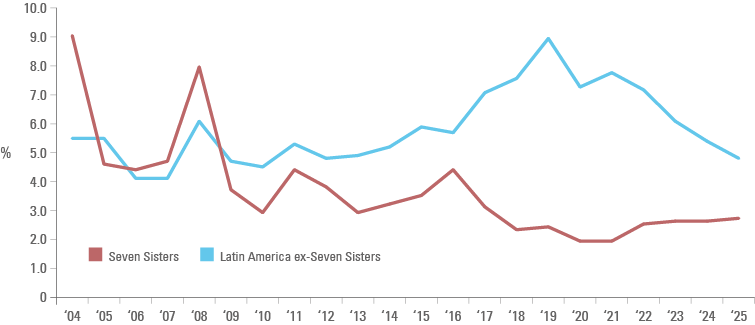
Inflation: The Seven Sisters have low and stable inflation, especially in recent years (Figure 7).2 There is no evidence of pass-through from exchange rate movement to inflation, which is testament to credible central bank policies. Some of the Seven Sisters use the Dollar as medium of exchange, including Panama and Ecuador, which contributes to price stability in the group as a whole. However, this should not take anything away from generally strong monetary policy management in the group as a whole. Greater price stability facilitates greater domestic savings than in other Latin American countries, which enable these countries to rely on their domestic bond markets as their main source of funding (with the exception of Ecuador). Financial self-reliance reduces the risks associated with capital flight episodes during bouts of global risk aversion.
Fig 7: Consumer prices index inflation (%)
3 | The broader EM outlook
The broader outlook for EM naturally has a bearing on the flow of capital to the Seven Sisters. A positive outlook for EM in general ought to result in better returns and, with a lag, more inflows to the Seven Sisters as well. The rest of this report summarises the broader outlook for EM in 2021 and beyond.
EM currencies
The outlook for currencies matters a great deal for everyone considering an investment in EM local markets, regardless of the nature of the investment. Investors in listed stocks and liquid local currency bonds trade FX on a daily basis, but investors in private equity and infrastructure must equally pay attention to FX in order to determine whether to use hedges or not. After falling by 50% versus the Dollar in the period from 2011 to 2015, EM currencies stabilised versus the Dollar from 2016 through 2019. In fact, EM currencies appreciated outright versus the Dollar in the calendar years of 2016, 2017, and 2019. In 2020, the Dollar once again spiked versus EM currencies due to the severe bout of global risk aversion triggered by the coronavirus pandemic, but looking forward from now it is likely that the Dollar will once again retreat from its recent highs, albeit not in a straight line. EM currency upside could therefore become an important part of investment returns for investors in EM local markets in the coming years, including, of course, investors in private equity and infrastructure.
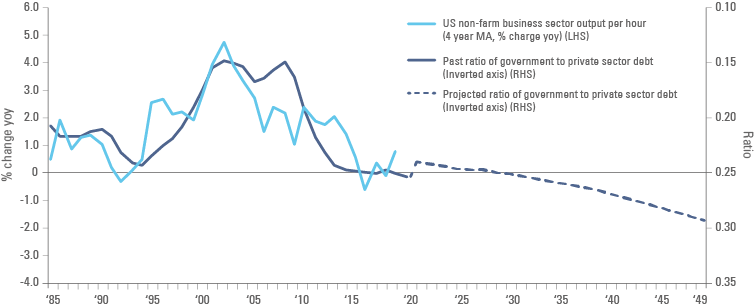
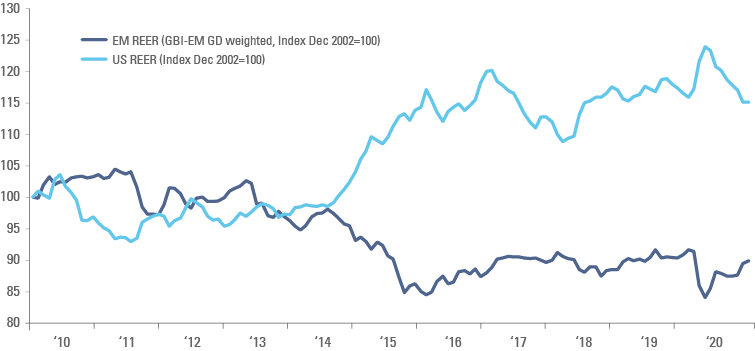
The Dollar is currently overvalued to the tune of about 20% versus EM currencies based on real exchange rates. The Dollar is overvalued to a similar extent from the perspective of US-EM growth differentials over the coming years, based on IMF growth forecasts. Finally, and perhaps most importantly, the Dollar is rich on its own terms, that is, versus US productivity growth. US productivity growth looks set to weaken significantly in the coming years due to a sharp rise in the share of (relatively inefficient) US government spending in the US economy. This should put downwards pressure on the Dollar on account of the strong empirical relationship between productivity growth and government debt in the US (Figure 8). Other factors that also point to a lower Dollar include the Fed’s diminishing capacity to shore up US growth, record large twin deficits, and expensive US assets. Having said that, the Dollar is unlikely to decline in a straight line, because there will be plenty of anxiety and financial instability, which occasionally triggers panic selling EM FX in favour of Dollars, though only on a temporary basis.
Fig 8: The relationship between government debt and US productivity
What does a lower Dollar do for EM?
Some 80% of the global investment universe is denominated in currencies other than the Dollar and a lower Dollar opens the door to all these opportunities, including EM. However, EM local markets offer far better value than non-US developed markets (DMs), because only very few markets in EM have been heavily distorted by Quantitative Easing (‘QE’) policies. Inflows enable EM banks to lend more to businesses and households, which breathes life into domestic demand. In other words, the return of inflows to EM is likely to set in motion a positive feedback loop, whereby inflows ease binding finance constraints, which in turn leads to stronger growth, which then induces further inflows, and so on. Once this feedback mechanism takes hold, we expect EM economies to grow ever faster than IMF’s current projections.
Further along in this process, however, the falling Dollar may eventually trigger so-called ‘Currency Wars’, where EM central banks scramble to buy Dollars in a bid to lean against appreciation of their own currencies versus the Greenback. Since the Dollar is moving lower on the back of real sales of USD-denominated assets (and real purchases of assets in other currencies), it is futile for EM central banks to fight the Green Tide in aggregate. However, FX interventions can buy time. The most visionary EM countries will allow their currencies to appreciate, because inflows are a gift of precious capital, but they will make sure the funds are put to good use. This will be the case if governments focus on reforms and put in place frameworks for attracting long term infrastructure investment, which reduces costs for local businesses, so they can thrive under stronger currencies.
EM Covid-19 risks
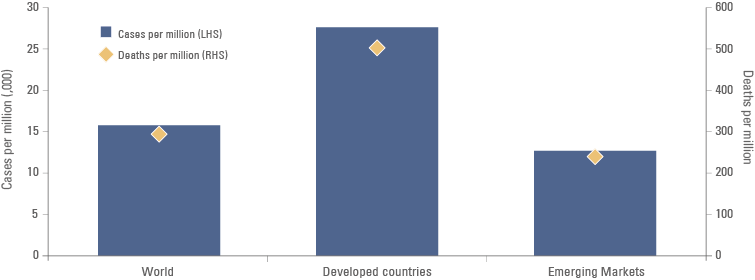
All human beings on earth are the same species, so anyone can get ill. Yet, EM countries have fewer than half the number of cases per million and deaths per million of population compared to DMs (Figure 9). Lower morbidity and mortality statistics in EMs partly reflect structural factors, partly better policy management, particularly in Asia.
Fig 9: Cases and deaths from coronavirus in EM vs DM
The main structural reasons why large swathes of EM has been less severely impacted by coronavirus include:
Younger populations: Younger people are less seriously affected by coronavirus than the elderly, less likely to die, and require less care when they get ill. EM populations are generally far younger than populations in DMs. Differences in age profiles explain about 50% of the lower morbidity in EM countries and 75% of the lower morbidity in so-called Frontier Economies compared to DMs.
Greater social distancing: EM economies rely more heavily on primary and secondary industries, whereas DMs mainly rely on services (tertiary industries). Primary and secondary industries, such as manufacturing, mining, fishing, and farming have less person-to-person interaction than services, which make up the vast majority of jobs in DMs. Greater proportions of EM populations also live in rural areas with lower population densities than in cities. In short, there is more ‘natural’ social distancing in EMs than in DMs.
Bacille Calmette-Guérin (BCG) vaccinations: Countries that inoculate their populations against tuberculosis with BCG vaccines have fewer cases of coronavirus and the seriousness of cases is less severe. BCG vaccines are dispensed universally in EM countries, but most DMs either only vaccinate parts of the populations, or do not vaccinate at all.
Climatic factors: Viruses generally thrive in colder, drier climates, so they are sensitive to seasons. Large viruses, such as COVID-19, get caught in airborne water molecules in more humid climates, reducing airborne transmission, although the benefit of lower transmission in warmer humid climates can be lost if there is widespread use of air conditioning.
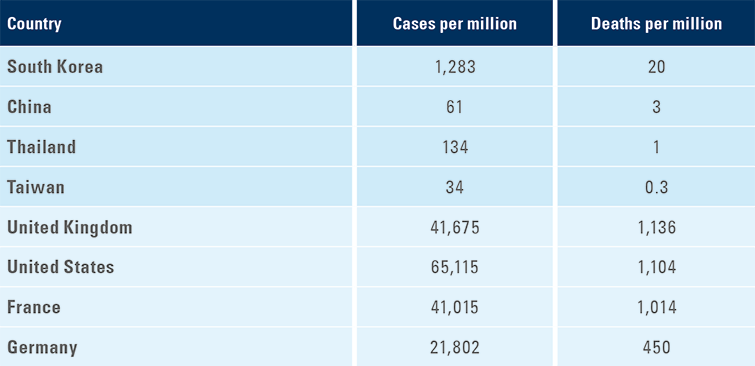
Other than structural differences, EMs have better coronavirus outcomes due to better policy responses to the illness. Policy responses have varied greatly across countries, including within EMs, but EMs have on average responded more effectively to the pandemic. This can be illustrated rather starkly by comparing morbidity and mortality statistics in affluent Asian economies and DMs. It is not possible to control for all differences in the classification of cases and reporting, but even so, we believe that a comparison of these two groups can be instructive, because they have broadly the same economic means to fight the disease, advanced economic structures, and climates with distinct seasonality. Despite these structural similarities, affluent Asian economies have 112 times fewer cases per million and 153 times fewer deaths per million than DMs (Figure 10). These difference are too large to attribute to methodological issues; rather than reflect in larger part policy differences, in our view.
Fig 10: The importance of policy – comparing case and death numbers in Europe/US with Asia
EM growth
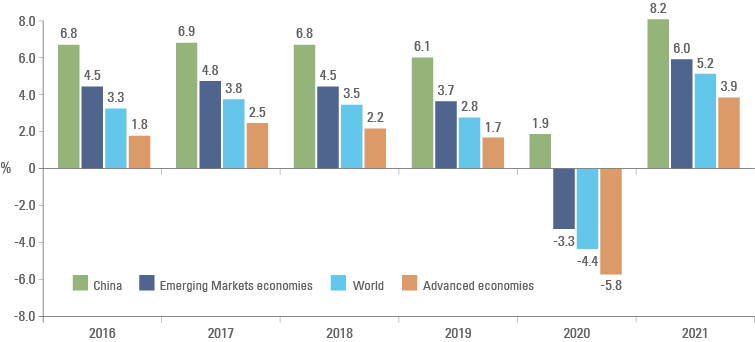
Lower Covid-19 morbidity and mortality rates in EMs naturally translate into milder economic contractions. EM economies have therefore also outperformed DMs in economic terms. Lockdowns are also less effective in EM countries, which have very large informal sectors and low per capita income. The latest growth projections from the IMF estimate that EM growth contracted by an average of just over 3% of GDP in 2020 compared to 6% in DMs (Figure 11). Moreover, IMF expects EM countries to rebound faster in 2021 with 6% average growth compared to less than 4% in DMs. China stands apart from all other countries in terms of its economic resilience in 2020 and looks set to record growth in excess of 8% in 2021. Strong Chinese growth provides an important tailwind for EM, including higher commodity prices, greater outbound Chinese foreign direct investment (FDI), and probably an even weaker Dollar.
Fig 11: EM versus DM real GDP growth rates (2020-2021)
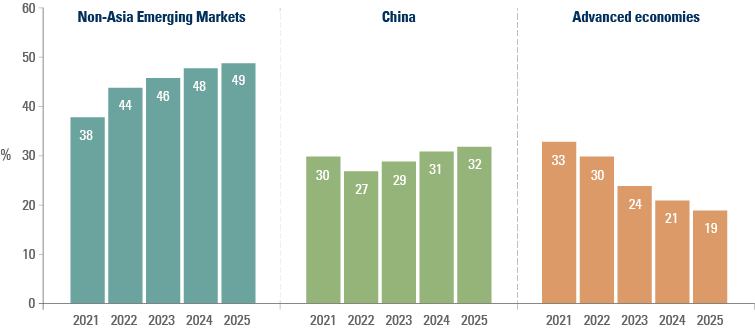
Looking beyond 2020/2021, growth is likely to obey structural constraints to economic expansion. Most DMs, including the United States have overvalued real exchange rates, declining trend productivity growth, and crippling debt overhangs in addition to mounting social problems, partly due to escalating income inequality. By contrast, many EM countries entered the pandemic with considerable spare capacity. Cheap currencies and record low inflation rates mean that they have room to grow for some time. IMF expects China alone to contribute 1/3 of all global growth over the next five years. China is able to do this due to its constant focus on structural reforms, high levels of investment, and generally solid macroeconomic fundamentals. Meanwhile, non-China EM will contribute about half of all growth on earth. Thus, taken together China and non-China EM will contribute more than 80% of all growth on earth by 2025, while the contribution of DMs to global growth will fall to less than 20% (Figure 12).
Fig 12: Contribution to global growth (2021-2025)
Debt
Debt levels rose sharply in all countries in 2020 due to the costs associated with lockdowns and fighting the coronavirus pandemic. Having said that, the fiscal damage has been far less severe in EM (10% of GDP) compared to DMs (15% of GDP, more in G7 economies). EM and DM countries also entered the pandemic with very different debt profiles. EM debt was 52% of GDP before the pandemic, while DM debt was already in excess of 104% of GDP. In 2021, EMs are expected to carry an average debt load of just over 60% of GDP compared to 124% for DMs. The legacy of debt will play an important role in shaping future economic performance, including the level of policy interest rates, and the outlook for currencies in the coming years. It will be tough for DM central banks to hike interest rates meaningfully without triggering fiscal crises, so a return of inflation could have very serious negative ramifications for DM currencies, including the Dollar.
Markets
The arrival of vaccines, a global growth recovery, and less nationalist policies in the United States under the Biden Administration should prove a winning formula for EM. Relative and absolute valuations in EM are attractive after the pullback in 2020, particularly for local markets. The promise of strong performance in 2021 builds on solid returns across EM since the Fed began to hike rates in late 2015. Since 2016, EM bonds and stocks have delivered annualised returns in Dollar terms in or near double digits, while EM currencies, though volatile, have not seen a repeat of the big downdrafts of the 2011-2015 period (Figure 13).
Fig 13: Performance of EM and selected DMs since 2016
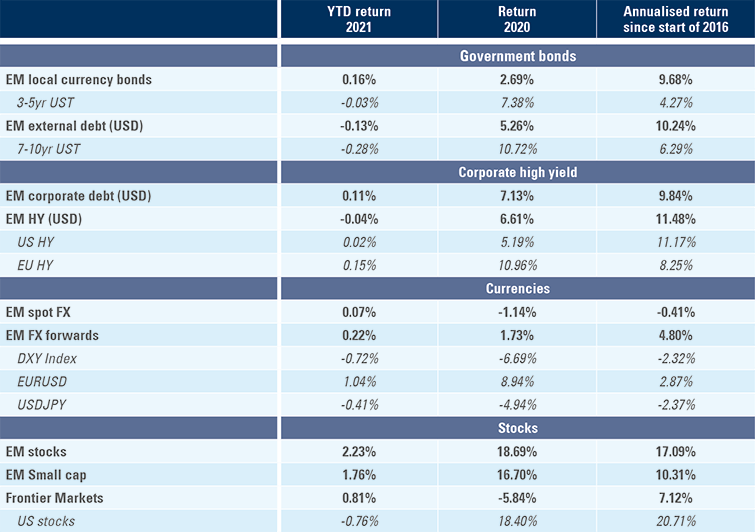
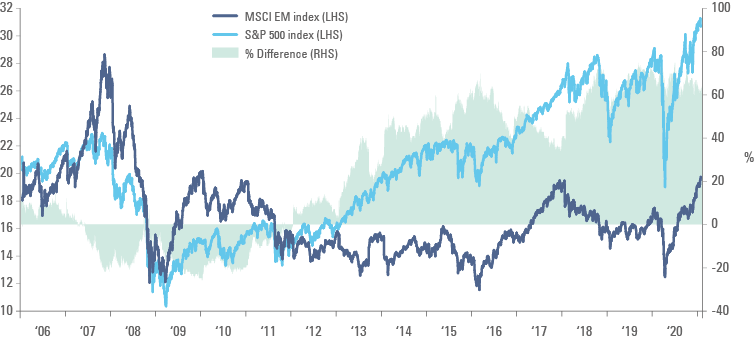
EM assets continue to offer value in spite of the good performance in recent years. This is testimony to the enormous distortions created in global markets by the very uneven application of QE policies. Most institutional investors went heavily underweight EM during the ramp-up of QE and they remain very lightly exposed to the asset class. Indeed, over the past decade more than USD 13trn, or 60% of US GDP, flowed from the rest of the world, including EM to US markets. These distortions are evident in valuations across stocks, currencies, and bond markets as shown in Figure 14.
Fig 14: Residual distortions in valuations for EM stocks, FX, and bonds
Stocks: Long-term price earnings ratios: SPX versus MSCI EM
FX: Real effective exchange rates: US Dollar versus EM FX
Bonds: Yields and change in yields since pre-GFC: US versus EM
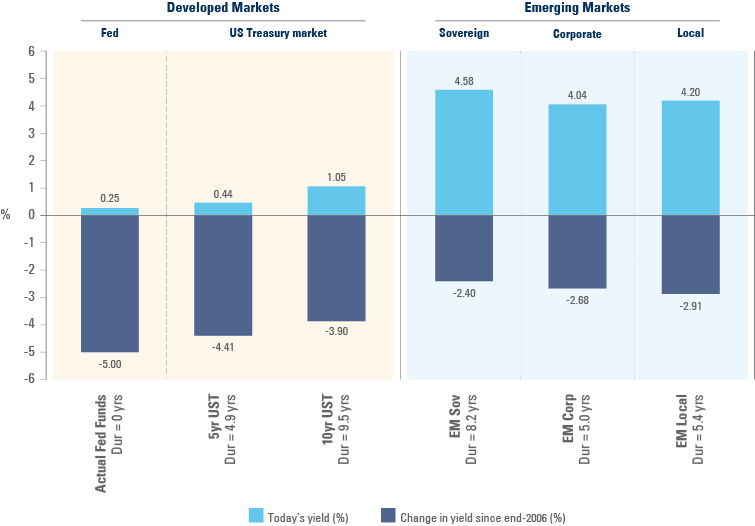
The gradual unwinding of QE-distortion positions is likely to provide a steady flow into EM and provide a source of outperformance for EM assets relative to DM assets spanning a number of years. Based on current yields and FX upside alone, EM Dollar bonds should return more than five times more than US bonds of similar duration over the next five years, while EM local bonds could deliver more than 8 times more than US bonds of similar duration. This assumes a modest appreciation of EM currencies of 20% versus the Dollar over five years, following the 50% appreciation of the Dollar versus EM currencies over the past decade. EM Equities are likely to perform even better than bonds. Strong earnings growth is expected in 2021, so simply maintaining current multiples at around 15x should push the total return for EM stocks as high as 30% this year, excluding any upside from FX.
4 | Conclusion
The benign outlook for EM should favour investments in the Seven Sisters of Colombia, Peru, Ecuador, Panama, Costa Rica, Dominican Republic, and Guatemala. While they are among the smaller and less liquid markets in Latin America they make up for their lack of size by performing better in economic terms and in policymaking. They lend themselves particularly well to private markets, including private equity investment and long-term infrastructure.
1. Panama is now a major oil processing hub, which imports crude and exports refined products.
2. Dominican Republic experienced an inflation spike in 2004, while Peru had one in 2009. In both cases, they were one-off episodes.