
The 2015 Paris Agreement introduced the legally binding goal of maintaining the average global temperature below the pre-industrial revolution average plus 2o Celsius in order to avoid severe stress on natural and socioeconomic systems.
The latest scientific evidence suggests that achieving the temperature target set by Paris will demand the world achieves net-zero emission of greenhouse gases (GHG) by 2050.1 Against this backdrop, several countries – representing in aggregate 53% of the global economy – have committed to achieving the net-zero emission target.2
The United Nations Climate Conference scheduled for 1-12 November 2021 in Glasgow will take stock of countries’ climate plans and seek to enhance the framework for financial, technical and capacity-building assistance, which is important for both Developed Markets (DM) and Emerging Markets (EM). It is already clear that it will not be possible to achieve the Paris Agreement goals under current policies, so more action is required. To ensure success, future action to maximise efficiency and equitability requires that the enormous differences in terms of their emission profiles between DM and EM economies receive full recognition.
This report sets out seven policy recommendations for meeting the goals of the Paris Agreement. Taking explicit account of the differences between DMs and EMs, the report offers proposals for how to measure emissions as well as the actions required of EMs, DMs, and International Financial Institutions (IFIs). The report also suggests how to increase private sector involvement, correctly price carbon sinks, enhance carbon capture in the land-use sector and get the financial sector more involved.
Finally, the report highlights recent policy measures undertaken by the Indian government as part of its contribution to meeting the goals of the Paris Agreement.
The 2015 Paris Agreement
The 2015 Paris Agreement is a legally binding international treaty on climate change with the quantitative goal of holding the average global temperature below the pre-Industrial Revolution average +2º Celsius, but preferably +1.5º Celsius. Meeting these goals demands a material reduction in emissions of so-called greenhouse gasses (GHGs), including but not restricted to carbon dioxide (CO2), the most important of the GHGs. Scientists estimated that CO2 emissions must reach net-zero on average by 2050, while total GHG emissions must reach net-zero between 2063 and 2068 in order to meet the +1.5º Celsius target. To meet the less ambitious +2º Celsius target CO2 emissions must reach net-zero on average by 2070, while total GHG emissions will have to fall to net-zero by the end of the century.3
Under the terms of the Paris Agreement, individual countries have to communicate plans and actions to reduce GHG emissions every five years and start to report transparently on actual climate change actions by 2024. Several signatories to the Paris Agreement have already committed to reducing GHG emissions to net zero by 2050. However, the first meeting to communicate plans and actions to reduce GHG emissions did not take place in 2020 due to the Covid-19 pandemic, which forced countries to postpone their climate plans to the COP26 UN Climate Change Conference in Glasgow on 1-12 November 2021.4 In addition to taking stock of climate plans, the Glasgow conference aims to enhance the framework for financial, technical and capacity-building assistance. This is particularly relevant for lower-income EM countries.
Need for more action
It is clear that the Paris Agreement goals are not achievable under current policies (see Box 1).GHG emissions reached their highest ever level in human history in 2019 at 59.1 gigatons equivalent of carbon (GtC).5 Meeting the +2º Celsius target with a 66% probability of success requires a reduction of total GHG emissions to 41 GtC by 2030, while the more ambitious +1.5º Celsius target requires cutting total GHG emissions down to 25 GtC.
BOX 1:
Is the G20 on track to reach their targets?
“Collectively, the G20 members are NOT on track to achieve their unconditional NDC commitments based on pre-Covid-19 projections. Nine of the sixteen G20 members (counting the EU27+UK as one) are on track (Argentina, China, EU27+UK, India, Japan, Mexico, the Russian Federation, South Africa and Turkey). Five G20 members are projected to fall short and therefore require further action (Australia, Brazil, Canada, the Republic of Korea and the United States of America). Projections for Indonesia and Saudi Arabia are inconclusive.”
UNEP 2020 Emissions Gap Report
The 2020 Emissions Gap Report produced by the UN Environment Programme (UNEP) establishes that current nationally determined contributions (‘NDCs’) – that is, the efforts by each country to reduce national emissions and adapt to the impacts of climate change – will result in a 3º Celsius temperature increase by the end of the century. The report also shows that even if recently announced net-zero emission goals are implemented expeditiously global temperatures will still rise by 2.5º Celsius by the end of the century.6
Contrasting emission profiles of EMs and DMs
Due to the evident challenges in reducing emissions, it is critically important that the next steps are targeted for maximum efficiency and equitability. Policy prescriptions must be both economically realistic and politically feasible. They must therefore take account of the differences in circumstances facing DM and EM economies. Failure to do so would risk non-compliance, which in turn places the entire Paris Agreement in jeopardy.
The good news is that Paris Agreement explicitly recognises the differences between EMs and DMs in clauses 4.4 and 4.5 of the treaty (see Box 2). The most relevant differences from the perspective of designing policies to combat climate change include levels of economic development, technological capabilities, past and present GHG emissions as well as financial constraints.
BOX 2:
Clauses 4.4 and 4.5 of the Paris Agreement
“4.4. Developed country Parties should continue taking the lead by undertaking economy-wide absolute emission reduction targets. Developing country Parties should continue enhancing their mitigation efforts, and are encouraged to move over time towards economy-wide emission reduction or limitation targets in the light of different national circumstances.
4.5. Support shall be provided to developing country Parties for the implementation of this Article, in accordance with Articles 9, 10 and 11, recognizing that enhanced support for developing country Parties will allow for higher ambition in their actions.”
Paris Agreement 2015
Specifically, EM countries tend to be poorer and less technologically advanced. They also tend to export emissions to DMs via industrial products. Their emission profiles can be summarised broadly as follows. EM countries:
- Account for far less of the world’s cumulative GHG emissions than DMs
- Emit less carbon than DMs in per capita terms
- Use less efficient technologies from a GHG emission perspective
- Consume proportionately less than DMs
- Produce disproportionately more than DMs
- Need to continue to develop their economies in order to escape poverty
By contrast, richer and more technologically advanced DMs account for the bulk of global consumption and import emissions from EMs via industrialised products. The emission profiles of DMs can be summarised broadly as follows. DM countries:
- Account for far more of the world’s cumulative GHG emissions than EMs
- Emit more carbon than EMs in per capita terms
- Have access to more efficient technologies for reducing GHG emissions
- Consume disproportionately more than EMs
- Produce disproportionately less than EMs
- Have attained high living standards and social safety nets in place
Quantifying the problem
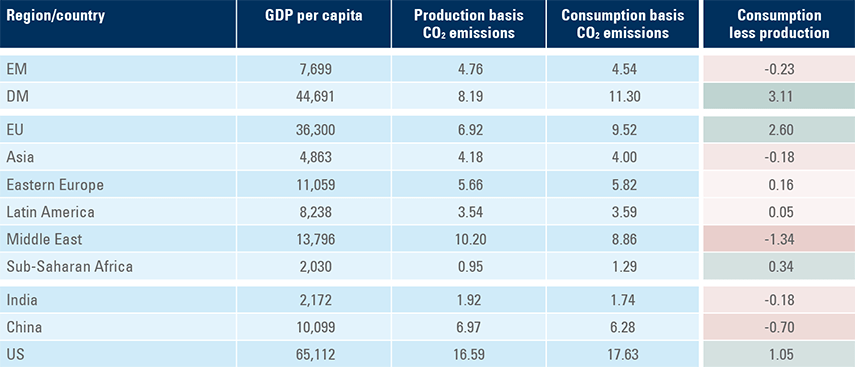
End-demand (consumption) in DMs is the real underlying driver of global emissions, whereas production merely relocates between countries in response to demand. Over the past few decades, the process of globalisation has seen much production move from expensive DMs to cheaper and more productive EM countries, which has contributed to the development of local industries across EMs and lifted billions out of poverty.7 Undoing these advances due to misunderstandings about emissions is bad policy. As shown in Figure 1, DMs account for nearly twice the world average of CO2 emissions on a consumption basis, whereas most EM regions fall far below global average emissions on a consumption basis.
DMs are not only the largest emission culprits; they are also in a better position to effect change because of their much higher average living standards (more than twice the world average). To the extent that limitations must be placed on economic activity such limitations should be imposed in DMs, while EM countries with below world average per capita GDP should be allowed to continue to develop in order to combat poverty. Latin America for example, emits less CO2 on a consumption basis than the fitted line in Figure 1, so they should be allowed to increase emissions outright as part of their efforts to escape from poverty (although this should not stand in the way of efforts to boost their emission efficiency). India has the same emission levels as Sub-Saharan Africa on a per-capita basis, a very different and more accurate picture than absolute emissions.
In aggregate, the World should collectively aim to flatten the curve of CO2 emissions per capita.
Fig 1: Consumption basis CO2 emissions in tons per person per year, by region

While the relative emission picture is clearer when looking at emissions on a consumption basis, production-side emission data offers important information on the potential for increasing emission efficiency on the supply side. The differences in CO2 emissions between DMs and EMs are smaller when measured on a production basis than on a consumption basis, although DMs still emit more CO2 than EMs on a production basis.
Fig 2: CO2 emissions in tons per person per year, by region
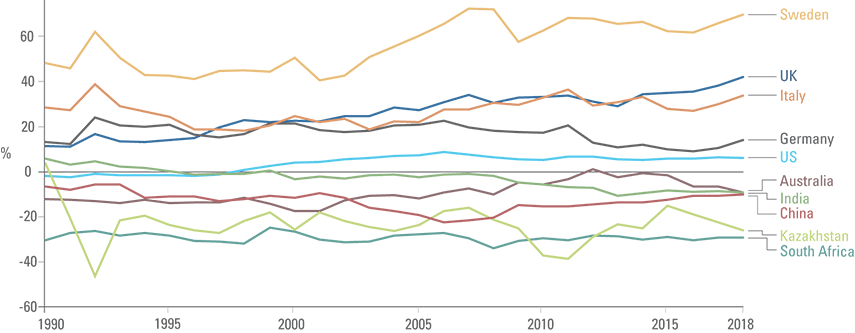
The fact that some of the largest exporters of emissions in the world are EM countries (including South Africa, Kazakhstan, China, India and others) mean that a good share of their emissions is a fruit of DM demands. On the other hand, Sweden, the UK, Italy and Germany stand out among the largest importers of CO2 emissions in the world, as per Figure 3.
Fig 3: CO2 emissions embedded in trade
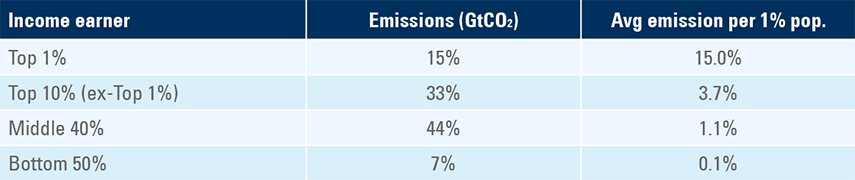
The relationship between income class and total emissions obviates the importance of measuring consumption-basis emissions. The top ten per cent richest people in the world are responsible for no less than 48% of all emissions (Figure 4). The middle 40% income classes contribute 44% of total emissions, while the poorest 50% of people only emit 7% of total CO2 equivalent. The close correlation between CO2 emissions and the level of economic development observed in Figure 1 makes a similar point; any serious effort to reduce GHG emissions must primarily target the wealthiest.
Fig 4: CO2 emissions by income groups
Policy recommendations
The contrasting emission profiles of DMs and EMs lend support to seven policy recommendations, which, if implemented, would advance the attainment of the goals of the Paris Agreement. In addition to distinct policy prescriptions for EMs and DMs to reflect their different circumstances, the recommendations touch on measurement issues through specific sector recommendations to defining roles for International Financial Institutions (IFI). They also show how the private sector can be more directly involved in furthering the aims of the Paris Agreement, particularly if empowered by a global emissions trading system. Finally, the policy proposals include specific sector recommendations for carbon capture and suggestions for how to price carbon sinks properly.
POLICY RECOMMENDATION 1: Measure emissions to maximise equitability and efficiency
Countries should measure emissions on a:
- Consumption basis to understand where the scale of emissions are excessive and where to cut it outright. This assumes that end-demand (consumption) exerts a dominant influence leading to higher supply (production).
- Production basis to identify where to upgrade production technologies to become more emission efficient.
- Per capita basis and taking account of GDP per capita in order to avoid the pitfall of putting the blame for emissions on countries just because they are large.
POLICY RECOMMENDATION 2: Actions for EM countries
EMs must continue to grow until they eliminate poverty, especially given the very low emissions by the poor. At the same time, production in EMs must not put the world’s climate in jeopardy. The twin objectives of raising GDP per capita, while at the same time not putting the climate at risk can be reconciled by improving the emission efficiency of EM industries (supply-side measures). This requires better production technologies, which in turn implies important roles for both DMs and IFIs (see below). The ultimate objective should be that EMs grow in ways that emit far less GHG than DMs emitted at the corresponding stage of their economic development.
POLICY RECOMMENDATION 3: Actions for DMs and IFIs
DMs have a number of extremely important roles in driving down global GHG emissions. Above all, they must reduce their own emissions outright, because DMs are by far the largest contributors to the problem. In addition, DMs can contribute to solving the problem in other important ways:
- Funding to support industrial transformation: A recent research from Morgan Stanley estimates that USD 50 trillion (trn) of investments will be required by 2050 in order to attain the climate target under the Paris Agreement. Of this total, some USD 20trn invested in hydrogen, USD 14trn in renewable energy, USD 11trn in electric vehicles, USD 2.7trn in biofuels and USD 1.5trn in carbon capture and storage solutions. These requirements mean cumulative investments worth USD 11trn by 2030 and a total of USD 23.4trn by 2040. The sums involved are far beyond the financial capabilities of most governments after the Covid-19 shock led to record indebtedness levels. This means that the government will have to create incentives for the private sector to invest in technologies aiding climate change.
- Boost emission efficiency in EM industries through technology transfer: More advanced DM industries can immediately contribute to lower emissions by exporting more emission efficient technologies to EM countries. This requires a commitment to free trade and incentivising cross-border investment. IFIs, such as the World Bank’s Multilateral Investment Guarantee Agency (MIGA) and the International Finance Corporation (IFC) have a particularly important role in this regard as providers of financial guarantees and other incentives that encourage greater DM-EM trade and investment flows.
- Increase support for research and development (R&D) on emissions from current very low levels: As Bill Gates notes in his book on climate change, “All the governments in the world spend about USD 22bn a year on climate change or around 0.02% of the global economy. Americans spend more than that on gasoline in a single month”.11 Public funding for R&D must include explicit subsidies as lowering climate risk is a public good and many research projects do not, at least at the outset, show a clear path to profitability. Moreover, DM governments must commit greater R&D funding and building networks through deeper collaboration between universities and the private sector as well as institutions and businesses with both DM and EM countries.
POLICY RECOMMENDATION 4: Incentivise greater private sector involvement through carbon trading and tax/subsidy policies
Government policies are most effective when they incentivise the private sector to push in the same direction. The single most important action that governments can take to incentivise the private sector to contribute towards attaining the Paris Agreement targets is to establish a truly global emissions trading system.
The ‘cap and trade’ mechanism of the European Union’s Emissions Trading System (ETS) is a good starting point. The system caps emissions by pollutants by industry and then provides emission allowances to companies within the sector.12 Companies that successfully reduce emissions below their limits can sell their excess ‘emission credits’ to companies emitting more pollutants than their cap.13 The emission cap should be progressively reduced to ensure that total emissions in the system are consistent with society’s objective with respect to climate change. One of the strengths of the European ETS is that companies can buy carbon credits from anywhere in the world, which enables the world to focus in the cheapest form of lowering emissions.14
Similar schemes are already in development across different geographies. For example, California, Colorado and other US states have their own systems, as does Ontario in Canada. China launched a nationwide carbon market in February 2021 after running pilot schemes for the past five years in five cities (Beijing, Shanghai, Tianjin, Chongqing and Shenzhen) and two provinces (Guangdong and Hubei).15,16 China’s ETS initially covers the power sector, which accounts for 30% of China’s emissions, but will expand over time to integrate other emission-intensive industries, such as cement, steel, aluminium, chemicals and petrochemicals. India’s Gujarat state has also introduced a cap-and-trade pilot project, which targets particulate matter pollutants from the textile industry.17,18
It would be natural for London, already the largest financial market in the world, to be the centre of global emission trading. Deeper ties between London and large EM countries, such as India would result in the rapid rise of London’s profile as an emission-trading hub as India is on a fast track to becoming one of the largest solar energy markets in the world (see case study section below). If London can mobilise the Commonwealth, its emission market could reach the size of the EU ETS.
In addition to facilitating emission trading, governments can effectively guide the private sector to contribute to meeting the Paris Agreement goals through conventional means, such as taxation. Taxing internal combustion vehicles, while providing tax incentives for electric vehicles will lead to lower emissions in transportation systems. Companies in the consumer and luxury sectors should offset their emissions by financing projects that reduce or capture emissions or alternatively be required to buy emission credits from other companies that are doing the work. Tax incentives can incentivise companies to prioritise projects with the best ratio of capital investment to emission reductions. For example, tax exemptions to coal-fired power stations in countries such as South Africa or India that install and monitor emission filters and tax hikes for power stations that do nothing.19
POLICY RECOMMENDATION 5: Price carbon sinks in accordance with their social value
Carbon sinks consist of vegetated areas on land (carbon is absorbed via photosynthesis) and in the sea (via various chemical and minor biological processes). Soil is also a natural store of carbon. Carbon sinks absorb carbon and other GHG emissions, thereby reducing the need for outright abatement elsewhere.
Carbon sinks are global public goods because they provide benefits that extend beyond the countries they sit in. The social value of carbon sinks should exceed their price as private goods. For example, without social pricing, the Brazilian rainforests will only be valued for its logging and agricultural potential, resulting in over-exploitation. This situation is a massive negative externality as the world loses one of its more important carbon sinks.
Due to lower levels of economic development, most EM countries have much larger carbon sinks than DMs. For example, 62% of Brazil is covered by forest compared to just 13% in the UK. African countries, such as the Democratic Republic of Congo, Congo Brazzaville, and Gabon have huge carbon sinks in the form of rainforests. East African savannahs are also huge carbon sinks. The biggest carbon sinks of all are the oceans, specifically in ecosystems such as algae, mangroves, salt marshes, seagrasses and macro algae.
POLICY RECOMMENDATION 6: Incentivise land use sectors to carbon capture
With nearly one-fifth of all GHG emissions, the agriculture, forestry and land use sector is the second largest contributor to global emissions after the energy sector.20 Each type of activity will demand a different method to encourage carbon capture:
- Livestock and manure (5.8% of total emissions)
Ruminants represents the main source of manure emissions. Large animals kept in confined areas emit more nitrous oxide and methane. Governments should promote healthier lifestyle choices including less consumption of animal protein and, when consumed, obtained from sustainable sources. Governments should reward sustainable production with tax benefits, while taxing intensive livestock farming to deter production. This delicate transition risks rampant food prices – allowing intensive producers to purchase emission credits from sustainable farmers would create an incentive for a wholesale change in practices. - Agricultural soils (4.1% of total emissions)
The main source of emissions is nitrogen-based fertilisers. The promotion of culture rotation and use of natural fertilisers can reduce soil degradation and diminish the need for artificial fertilisation. Governments should reward good practices and tax poor ones. - Crop burning (3.5% of total emissions)
Most large countries have policies to prevent the burning of crop residuals and farmland. However, many countries can improve legislation and tighten enforcement, by using real-time satellite imagery, for example. - Crop, rice and grass (2.8% of total emissions)
Governments can tackle poor management practices such as flooding and grass degradation. However, some practices like flooding rice crops should get a free pass. Rice is an efficient source as a staple crop for billions of people providing close to 20% of the global supply of calories with only 1.3% of total emissions. - Deforestation (2.2% of total emissions)
Forests are important carbon sinks.21 Global deforestation has been a feature of economic development for hundreds of years, albeit a diminishing one over the last decades.22 The pace of deforestation slowed from 151m hectares (ha) in the 1980s to 78m ha in the 1990s and 47m ha in the 2010s due to a decline in the pace of population expansion in EM countries and reforestation in the northern hemisphere. However, the pace of deforestation is still far too high and reforestation is necessary to accelerate emission capture. The United Nations’ Trillion Trees Campaign elucidates the main factors linked to multiple successful reforestation projects:23- Education and awareness campaigns
- Local populations with dependence on forests
- Reforestation incentives
- Quality of project design
- Forest protection mechanisms
- Road infrastructure design
- Choice of revegetation methods
- Funding structure
While reforestation is an important technique of carbon capture, it is neither fast nor the most cost-effective, so investment in improving existing technologies to capture and store carbon emissions should complement reforestation efforts.24
POLICY RECOMMENDATION 7: Mobilising the financial sector
The scale of investment required to meet the Paris Agreement goals is staggering. In most cases, investment requires finance. Pension funds, insurance companies, sovereign wealth funds and central banks manage the bulk of the world’s financial resources. Their capital allocation can have a profound impact on the climate. A non-exhaustive list of strategies prioritising sustainability includes:
- Sustainable Investing
Fiduciary managers can support climate change by requiring better accountability and transparency in regards to climate matters. Fiduciary managers can reward actors that act responsibly with respect to monitoring their emission footprints and have plans to reduce emissions. Such steps are likely to pay off. Investments with good environmental, social and governance (ESG) scores tends to have a higher Sharpe ratio. Despite paying lower yields on their bonds (and/or lower cost of equity), sustainable business models are also less risky. At a minimum, fiduciary managers should identify, rank and sort responsible from irresponsible companies and adjust the risk premium embedded in their models accordingly. This will lower the cost of funding for responsible actors. By contrast, irresponsible sovereign and/or corporate issuers will pay a higher price for capital. The recent re-rating of the oil & gas sector is an example of how fiduciary managers can influence outcomes.25 - Socially Responsible Investing
Socially responsible investing managers will actively add to or cut positions based on very specific ethical guidelines introduced into portfolios in the shape of screening. Hence, a step further than sustainable investing by removing irresponsible countries, sectors or companies from portfolios. An example of socially responsible investing is banning investments in companies involved in weapon production or sales. - Impact Investing
Impact investors are similar to traditional charities in the sense that they actively seek to maximise the impact of the investment in a particular community, society or environment. The main difference between an impact investor and a charity is that the former seeks a financial return rather than just making a donation.
Case study: India
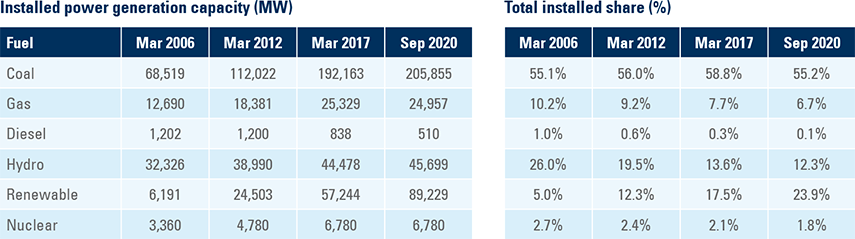
The Indian government is actively looking to expand its renewable energy capacity, focusing on solar energy, but is simultaneously expanding the coal industry. Coal accounts for close to 55% of India’s total installed power generation capacity (Figure 5) after expanding by a factor of three, in absolute terms, between 2006 and 2020. However, at the same time, renewable energy has expanded 14.5 times over the same period. As a result, the share of renewable energy rose from 5% to 24% between March 2006 and September 2020, while coal’s share in the energy mix has remained stable at 55%.
Fig 5: Power generation capacity in India (Megawatts) and % share
The Indian government’s target is to achieve 175 Gigawatt (GW) of renewable capacity by 2022 and 500 GW by 2030.26 This compares to 141 GW in September 2020. If they hit the target, the share of renewable energy will reach 59% in 2030, from 38% in September 2020. A recent report by Moody’s says India is on course to raise the share of non-fossil fuel generation capacity to 45% by 2022, ahead of the 40% commitment.27
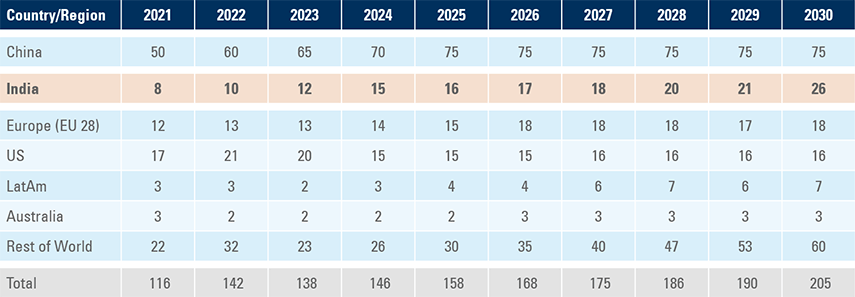
Within renewables, solar energy is already the cheapest form of energy generation in India. This is thanks to a sharp decline in component and installation costs as well as improved funding availability. India is likely to emerge as one of the fastest-growing solar markets globally from 2025 with a larger increase in capacity than both the US and the EU (Figure 6).
Fig 6: Growth in solar energy capacity (GW)
In addition to developing solar energy, India has introduced stricter emissions limits for existing and in-construction coal-fired power plants. The government has identified approximately 37 GW of inefficient coal power capacity to be retired over the next 10 years and replace it with coal-fired plants that are more efficient. The government has also introduced a clean energy tax at a rate of INR 400 per ton of coal used in producing electricity.
Lastly, India has recently introduced new regulations to limit emissions in the transportation sector. Uber and its main local competitor, Ola, are required to electrify 40% of their fleets by 2026 with a set target of 2.5% in 2021, 3.0% in 2022 and 10.0% by 2023. The Indian government is also offering income tax rebates on interest paid on loans to buy electric vehicles. In addition, there are customs duty exemptions on lithium-ion cells and tax exemptions for component manufacturers. The courts have also weighed in; the Indian Supreme Court recently asked the City of New Delhi to consider the introduction of fuel cell buses to reduce air pollution.
Summary and conclusion
The policymakers converging on Glasgow at the United Nations Climate Conference in November face great challenges. To assist them, this report sets out seven policy recommendations for achieving the Paris Agreement targets.
By explicitly recognising the differences between EM and DM countries, our policy proposals seek to maximise both efficiency and equitability in order to ensure that the next actions to combat climate change are effective and politically sustainable.
The bulk of global emissions is due to high levels of consumption in DM countries and this should be the main area of focus. Fortunately, DMs happen to be the richest countries in the world and are in the position to take a lead in emission abatement efforts.
There are important roles for EM countries that face the additional complexity of widespread poverty. Their twin objectives of lowering emissions, while at the same time advancing their economic development can only be reconciled by ensuring that production becomes more energy efficient than it was in DMs at the corresponding stages of their economic development.
A substantial increase in the pace transfer of emission-friendly technologies from DMs to EMs
is crucial. This requires greater funding, but also a commitment to more DM-EM cross-border trade and investment, aided by incentives from IFIs in the shape of guarantees and other
risk mitigating factors.