
Short on time? Download the one-page summary.
Introduction
Unfortunately for die-hard fans of the US equity market, US exceptionalism was driven by unsustainable pro-cyclical fiscal policies that are now on the chopping block. Tariffs and the dysfunctional budget discussions in Washington leading to high volatility in US equities have made this reality clear.
Some analysts still recommend US stocks as a hedge against an even more profligate US budget eventually being passed this year. This is misguided, in our view. In such strange times, it is much more prudent to increase exposure to countries with lower valuations, more sustainable earnings drivers, and currencies that are not overvalued. After a decade of US outperformance, foreign investors are far too concentrated in US assets, particularly risk-on US equities.
Looking at total foreign holdings of US assets, the ratio of private/public sector ownership rose from 1.5x in 2010 to 4.0x in 2025. For every dollar foreign investors have in ‘risk-off’ US Treasuries there are two dollars held in ‘risk-on’ US stocks. Europeans are particularly exposed and now have a strong tailwind behind their own markets. The German EUR 1.0trn fiscal spending on infrastructure, energy, and defence will lead to higher GDP growth and convergence of the German Bund to US Treasuries, which is positive for the euro. China is not far behind in stimulating its economy and will now need to focus on consumption-led growth, which will be positive for most Chinese companies.
We believe a multi-year diversification trend away from US assets is about to begin, driven by geopolitical disputes with large creditor partners, worries about US institutional decay, and isolationism restricting trade and immigration and harming its educational system. The dollar is no longer the haven it was due to the large US fiscal and external imbalances. While it is likely to remain the largest currency in reserve manager portfolios and trade/capital account settlements, the weight in other currencies will increase due to settlement alternatives and diversification.
The inconvenient truth
There is a clear disconnect between the narrative and the reality behind US exceptionalism. The narrative is well known. Despite no longer being the single dominant force in global trade and economics, the US remains a hegemon through its reserve currency. Its world-beating education sector, openness to talented immigration and dog-eat-dog capitalism have also kept the US at the cutting edge of innovation, where its great minds have built the world’s leading technology companies, and its most advanced weapons. Both are difficult to replicate.
Nevertheless, all this has been part of the greatness of America for a century. During this period, the Dollar has had major peaks and troughs, and US equities and fixed income valuations have traded at a wide premium to global assets, and sometimes, even, at a discount. What has driven US assets, particularly equities, to historic valuation premiums in the last decade has not been its century-old structural advantages, but additional macro forces.
In our view, the extraordinary outperformance of the US in recent years has been underpinned by the shale oil revolution and the large pro-cyclical fiscal stimulus since Donald Trump’s first term. We quantified both in our January ‘Emerging View’ and concluded that the latter was significantly more important.1 The piece also showed that the largest US companies have become more dependent on US-based earnings, despite the domestic economy growing at a slower pace than the rest of the world.
The magnitude of the imbalances within the US government budget will now make it very difficult for the US to keep sustaining the macro environment that has led to its equity market exceptionalism. Further fiscal expansion may bring unsurmountable macro imbalances and higher bond yields which are likely to destabilise financial markets. Fiscal consolidation is now the only lucid policy direction to follow, in our view. However, this would directly hit US companies’ earnings.
The sharp increase in US equity market volatility corroborates this policy conundrum. This year, US stocks had a 20% drawdown and the fastest recovery on record, associated with the 2 April reciprocal tariff announcement and various stages of capitulation since. Year-to-date to 25 May, the S&P 500 is down 1%, underperforming the MSCI World, which is up 3% and MSCI EM at +10%. Last Friday’s threats of imposing 25% tariffs on Apple if it didn’t manufacture its phones in the US, plus 50% tariffs on Europe, rekindled volatility.
Where to re-allocate
Some strategists claim US stocks are a better place to invest than bonds, as in their view, the government is unlikely to consolidate its gargantuan fiscal deficit. As the argument goes, large deficits keeping nominal GDP growth elevated would be a positive environment for stocks, particularly for high-quality companies, like the ‘Magnificent Seven’, better equipped to pass inflation through to prices, thus benefiting from ongoing fiscal largesse.
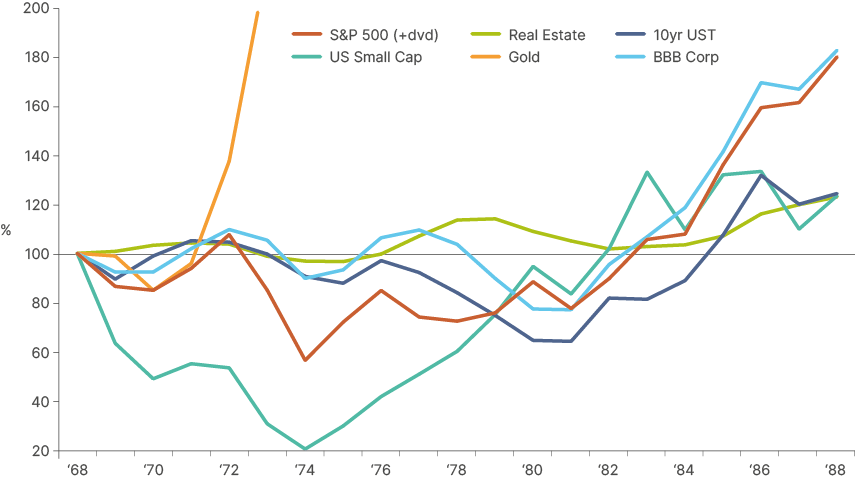
History shows, however, that equities are not always a good inflation hedge. From 1968 to 1978, US stocks underperformed bonds meaningfully as inflation rose from 3.0% to average 6.5% over the period, with a high of 12.3% in 1974. Gold (+201%), real estate (+14%), and BBB bonds (+4%) held their ground well during this decade. Ten-year bonds sold off by 16%, but the S&P 500 was down 28% and small caps dropped 40%. The S&P 500 and small caps had huge drawdowns of 40% and 80%, respectively from 1968 to 1974, as per Fig 1:
Fig 1: Returns on selected asset classes normalised at 100 (1968-1978)
Companies generally can pass price increases through to consumers. We have seen that in all emerging market (EM) countries that debased their currencies, including Türkiye and Argentina. Nevertheless, two facts should encourage caution on US stocks in a higher inflation environment. First, company pricing power declines in a slowdown/recession. This is concerning given tariffs are likely to bring activity lower and prices higher in the US economy. Second, buying assets at high valuations can be a terrible hedge against inflation if the Federal Reserve (Fed) reacts by increasing rates, or the long end of the curve widens. This is what happened in 2022, when stocks sold off as yields rose.
The recent surge in bond yields threatens market stability, particularly in high valuation stocks. It represents declining confidence in fiscal trajectories, exacerbated by the surge in interest expense due to rising global debt stock. Low valuation equities in the rest of the world (Fig 2), with earnings predominantly in currencies that are not being debased, represents a much better bet, with risk skewed to the upside.
Fig 2: Equity markets valuations, and earnings yield vs. 10yr government bonds

There are a few key asset allocation decisions we continue to favour, with the key principle being greater diversification across geographies and asset classes.2
- O/w Cash: Particularly in EM local currency, USD, and GBP.
- Equities: u/w US vs. o/w rest of world, mostly via EMs.
- Bonds: o/w local currency bonds and o/w USD (belly) vs. u/w EUR long end.
- Private assets (infrastructure, private equity, and credit): with focus on markets with undervalued currencies and reasonable valuations.
- Commodities: gold has been a better hedge than UST over the last five years. Industrial metals to remain well supported due to energy transition and AI.
The narrow path for a US soft landing
There are three main stumbling blocks for achieving a much-desired soft landing: trade, budget, and broad institutional policies.
a. The trade war imbroglio
The US stock market’s sharp recovery from 8 April to 23 May took place as the US administration U-turned on its trade policies. However, the reversal to a 10% base tariff and 35% tariff on China is still only temporary, lasting only 90 days. Expecting trade deals before the deadline is optimistic, as trade negotiations typically take a very long time (see Appendix 1).
When it comes to US tariff policy, there are still far more questions than answers. Can we have trade deals with 150 countries in the 90-day reciprocal tariff truce, which expires on 8 July, one day before the deadline for a deal with the EU to avoid a 50% tariff?3 Why would other countries give the US large concessions if China managed to get a significant reduction in tariffs by playing hardball? What about the 90-day reset with China until 12 August? Will it hold?4
Finally, we still have not seen all the sectoral tariffs come into play. Trump has repeatedly said the 25% tariff currently imposed on metals would also be imposed on pharma, autos, and semiconductors. To put it mildly, US equity markets are far from out of the woods when it comes to tariffs, and with sentiment currently buoyant, the risk is skewed to the downside.
b. Budget:
We are not experts in D.C. politics and find it hard to pinpoint how US fiscal policy will end after this budget is approved. Broadly, however, there are two possible paths and implications for the economy and asset prices:
The first is a ‘stealth fiscal consolidation’, over the next four years, which would bring the deficit lower by 0.5-1% of GDP per year towards 3% of GDP by the end of the Trump administration. This would be achieved by a combination of spending cuts, tariffs raising extra revenue, and deregulation supporting growth, thereby shrinking the deficit as a percentage of GDP. Despite US Treasury Secretary Scott Bessent’s view that deregulation measures will impact US GDP from the third quarter this year, we think the sequencing of this policy path would lead to a slowdown first, before the effects of deregulation begin to stimulate the economy over the next few years. The initial slowdown would support continued softening of services inflation and would allow the Fed to cut policy rates by 100-200 basis points (bps). In this scenario, the yield curve would bull-steepen, offering an incentive for investors to roll short-dated T-Bills into long Treasuries and keep more exposure in risk assets.
US equities could hold elevated levels, but we see little upside as prices implied 12% earnings growth at the beginning of the year, which has since been revised to 7% and may face further downward revisions depending on tariffs and the budget.
The second scenario is no fiscal consolidation or further fiscal expansion. The economy would remain supported by pro-cyclical fiscal profligacy. Inflationary pressures would remain, exacerbated by goods inflation from tariffs. As a result, the Fed would hold rates steady, unless unemployment rises sharply. Here, the yield curve would bear-steepen, also offering an incentive for investors to buy long-dated bonds but triggering poor performance in other risk assets. US equities could sell off sharply, if 10–30-year real yields rise too fast.
The main problem with the second path is that it could lead to an unsustainable debt dynamic, which would risk much higher interest costs. In this scenario, the US Treasury would have to adopt forms of financial repression to cap bond yields. This would eventually support stocks (if successful) but would be disastrous for the dollar, leading to further debasement.
In our own view, the commitment of the Treasury Secretary to fiscal consolidation and the ‘bond vigilantes’’ rejection of further fiscal expansion will bring about a more conservative final budget outcome. Renewing the Tax Cuts and Jobs Act does not increase the deficit and spending cuts in the current budget aim to balance out the extra tax cuts on tips, and the SALT cap extension. A 10-15% hike in the average tariff, and some cuts to the discretionary spending rate then suggest a reduction of the budget deficit in 2025 in percentage GDP terms is possible. In fact, we would not be surprised if the fiscal deficit in 2025 falls by around 1% of GDP as suggested by both White House Deputy Chief of Staff Stephen Miller and Scott Bessent. From there, the government would have to approve more measures in the next budget to avoid a deterioration in 2026. But that’s a battle to be had with Congress next year.
Who holds most US assets?
a. Private vs. official sectors
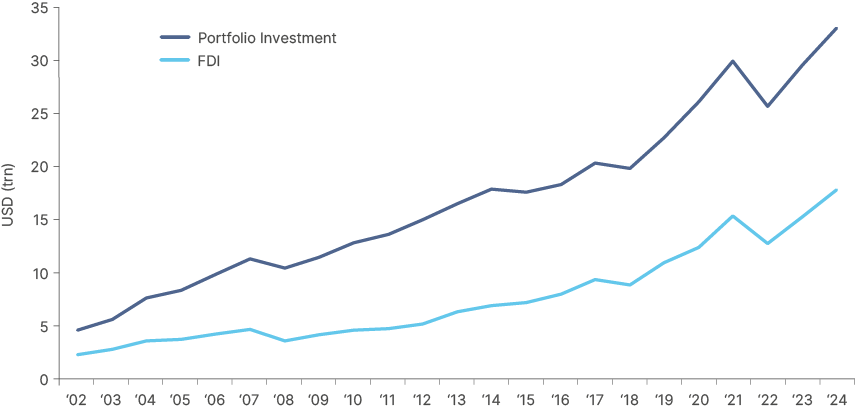
The US is the largest net debtor country in the world, by far. Its net liabilities to the rest of the world have reached a huge USD 26trn, equivalent to 88% of US GDP. This comprises USD 62trn of foreign ownership of US assets (a liability for the US) against USD 36trn of US investments abroad (an asset for the US). Of the USD 62trn liabilities, USD 33trn comprises portfolio investments, mostly liquid assets that can be sold quickly. USD 18trn is direct investment, with the rest made up of private loans and currency and deposit contracts.
Fig 3: Foreign ownership: Portfolio investments vs. foreign direct investment (FDI)
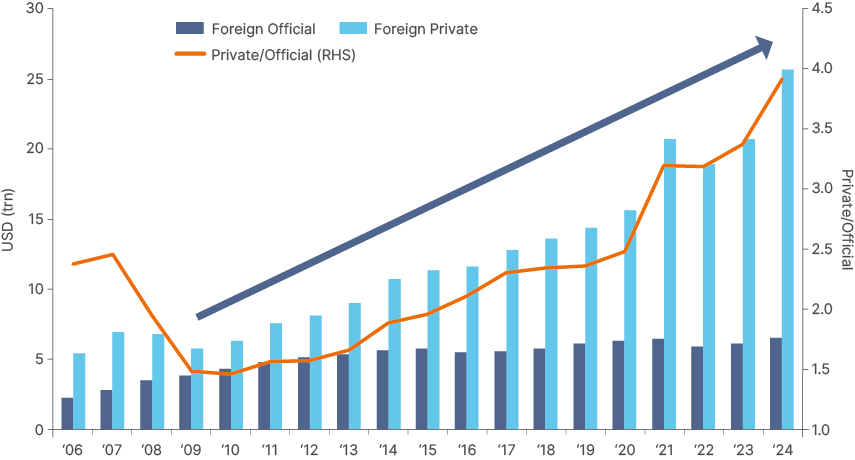
In the last 20 years, the private sector has been increasing exposure to the US and today controls the lion’s share of portfolio investments. The ratio of private to official owners of US assets has increased five-fold from 1.5x in 2009 to 4x in 2024, with assets rising from around USD 5trn to USD 25trn, as per Fig 4. This means that just a 5% reduction of US asset exposure by foreign investors would amount to USD 1.25trn of outflows at current valuations, which would be significantly more than US companies’ average share buybacks over the last five years, at USD 820bn.5
Fig 4: Foreign Portfolio Investment in US: Private vs. Official (USD trn)
b. Europe
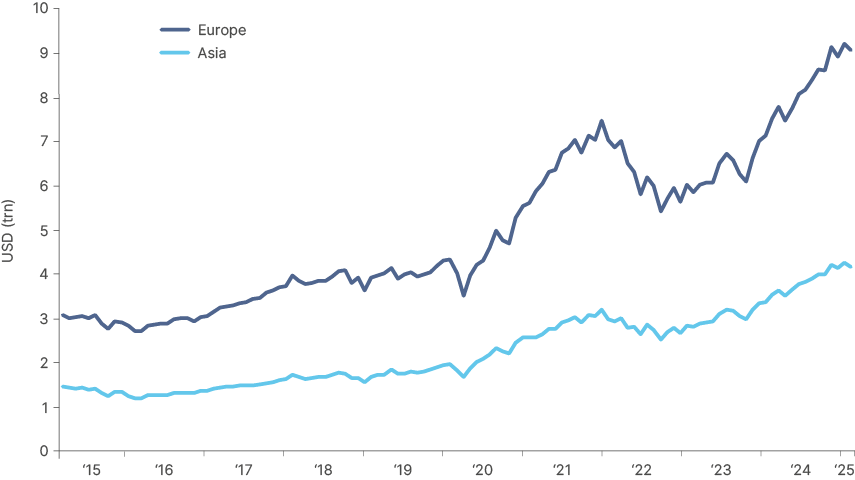
The two largest holders of US assets, by far, are Europe, which holds USD14tn of US assets, and Asia which holds USD9tn. Moreover, two-thirds of European assets (USD 9trn) are invested in US equities today, as per Fig 5. The vast majority of US equity exposure is unhedged, since the dollar would typically strengthen in a risk-off environment. Nevertheless, this relationship has changed in 2025 (see USD smile below), leading many EU investors to hedge their exposure.
Fig 5: Foreign Ownership of US Equities: Europe vs. Asia
It is conceivable we will see significant repatriation flows from European investors. This will be supported by the large fiscal expansion leading to significant investment opportunities in European equities as well as more issuance of high-quality European debt as well as a historically cheap euro. This would likely drive significant US capital account outflows.
c. Asia
Asian countries that have run large current account surpluses with the US over recent years have built correspondingly large holdings in US assets, as these surpluses have largely been recycled back into US stocks and bonds. Asian investors have a more conservative investor profile (as more of the assets are held by the official sector), with close to 55% of their USD 9trn of US exposure in bonds.
China and Japan still have by far the largest US holdings, even as Japan has trimmed its bond holdings in recent years. The raw data suggests China has been a seller of US assets, but it is assumed some of China’s UST holdings are now held in Belgium, and Luxembourg, the domicile of Clearstream and Euroclear, and perhaps Switzerland, and the UK. In nominal terms, but particularly in relation to the size of their domestic economies, South Korea and Taiwan now have significant positions in US assets. Korea holds USD 750bn in US stocks and bonds, 40% of its GDP. Taiwan holds USD 820bn of US assets, 105% of its GDP. Notably, USD 664bn of this position is in bonds, which makes Taiwan the largest holder of US bonds in the world relative to the size of its economy. The recent spike in the TWD as investors began to speculate on the repatriation, or at least hedging, of some of this position demonstrates how significant a shift in positioning from Taiwanese investors could be for foreign exchange (FX) markets.
It is also well known that several Asian exporters have been hoarding dollars, as it gave them a higher yield than local currency and, until recently, a weakening JPY and RMB kept their currencies under pressure. With the recent strengthening of the JPY, most Asian currencies including the TWD, KRW, MYR, and RMB, started to rise as well. This will trigger significant rebalancing of investor and corporate currency exposure, in our view.
Institutional policies
Several narratives/facts are likely to drive a multi-year diversification away from US assets and the dollar.
- The weaponisation of the US dollar payment system via sanctions is encouraging neutral and non-aligned countries to seek alternatives.
- Geopolitics: Escalation of conflicts that force the US to spend more on defence (Ukraine, Gaza) have been driving central banks to diversify out of US Treasuries.
- Less open economy: Barriers for trade, education, and immigration – as well as forcing US companies to manufacture in the US – will lead to higher prices and lower margins. Less immigration and more deportations will lead to lower potential growth and add inflationary pressures, particularly for low value-add services, construction, and manufacturing industries. The ongoing struggle with Harvard University is likely to push students towards universities in other countries.
- Institutions and the rule of law: Trump has threatened to sack Fed Chair Jay Powell, has accused large legal firms of being partisan, and has installed close aides across key establishments, including the Supreme Court. In our view, the US institutional decay predates Trump. There has long been a partisan schism leading to a severely dysfunctional Congress, which has been increasingly dominated by interest groups (i.e., lobbyists for various industries such as weapons, pharma, tech, etc.). Congress has become increasingly transactional, leading to a more ineffective government balance.
- Foreign policy: The current administration’s bashing of key allies like Europe and opponents like China, means these governments are mobilising to become more selfsufficient. Foreign investors thus have more opportunities to invest at home and to fear a less friendly US administration.
- Poor infrastructure: Investors betting on another decade of technology stock hegemony are missing a bigger point. There is no AI scaling without a massive increase in energy generation and heavy investment on the energy grid to support transition and distribution. The overload blackouts in Portugal and Spain last month, and the UK paying for energy generation companies to stop producing attractively priced wind renewable energy in the North Sea, shows the world is neither ready for the energy transition nor for an increase in energy demand. The next big equity investment opportunities, therefore, are likely to be in project finance. This is a space where Japan, Germany, and China outperform the US.
- External imbalances: The US current account deficit, excluding oil, is at a record high of 5% of GDP, as per Fig 6.
Fig 6: United States non-oil current account deficit as % GDP
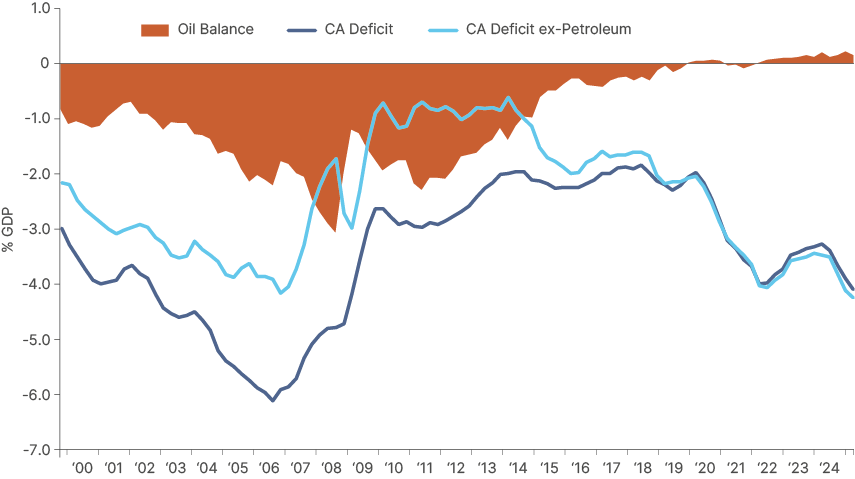
- Dollar settlement: Since the US is energy self-sufficient, exporting countries’ surplus have relocated to other places such as China, Europe, Japan, and India. Even though oil is still priced in dollars, China has been successful at settling oil imports in RMB. This means oil exporters need to make an active decision to invest their surplus in the US. As the US has been actively debasing its currency since the pandemic, reserve managers have been prioritising gold. But the dollar has still been the hegemonic currency for settlement, given the lack of alternatives. Not anymore. The BIS and the BRICS have been working on cryptocurrency projects (mBRIDGE and BRICS Pay) that could bypass the dollar system.6 BRICS Pay is interesting as it is a crypto currency partially backed by gold and a basked of BRICS currencies, making it a good candidate for settlement and reserve assets.
- US rebalancing: Imbalances do not mean that things will change. But the US administration is openly very keen to lower the external imbalance of a historical high current account deficit. Bessent is encouraging Europe and Japan as they implement policies that are leading to a strengthening of their own currencies. This is where the fiscal policy is key. Bessent understands there will be no external rebalancing without an increase in the US savings rates (lower fiscal deficit) and a simultaneous lowering of Chinese and German savings.
- Foreign rebalancing: The fiscal expansion in Germany guarantees lower savings rates and more recycling of Northern European surplus. China is perhaps waiting for the US to show it is serious about lowering its fiscal deficit before attempting to support more consumption. After all, moving from an export-led to a consumption-led growth model is a major challenge. If the US does not rebalance its fiscal deficits, its external accounts will also remain imbalanced. In this scenario, higher tariffs on China would lead to a lot of re-routing, but China would retain its position as the largest exporter in the world and the US the largest importer, even if the bilateral trade declines.
The path to de-dollarisation: the 1960s analogy
The 1960s is fitting as a parable of what could happen to US capital markets from here. The US share of global market cap peaked in 1970 and halved over the following 20 years. Nixon’s decision to delink the dollar from gold led to substantial dollar weakness and eventually rebalanced the US current account from deficit to surplus.
In government bonds, the pace of diversifying out of US debt is likely to be slower than US equities. High quality debt markets in the rest of the world are shallower than in the US. However, the supply picture could change considering the impending European and Chinese fiscal expansion. This change could accelerate if the US consolidates its fiscal deficit, which would drive bond supply and the current account deficit lower, leading to less inflows to USTs, and downwards pressure on the dollar.
In the equity markets, this paradigm shift has already happened. Non-US markets’ significantly lower valuation, and now improving earnings per share, against an uncertain economic and political backdrop in the US is already leading to the first leg of valuation convergence. This is likely to attract flows and further weaken the dollar, making the valuation convergence self-fulfilling.
Correlations breaking down: From the Dollar Smile to the Dollar Frown
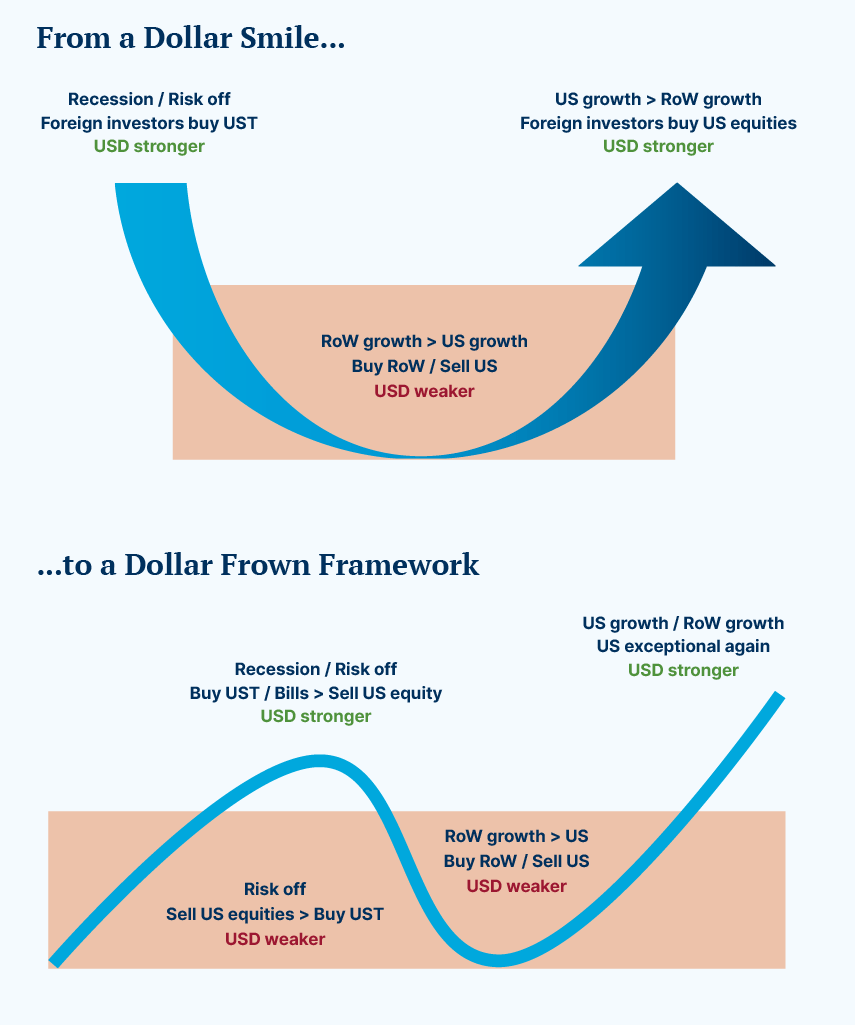
Another factor that should make it evident the US hegemonic position is eroding is the breakdown of the ‘Dollar Smile’ relationship. This elegant and simple model was created by then-Morgan Stanley currency strategist Stephen Jen. He posited that the dollar would strengthen both during periods when the US economy is outperforming the rest of the world, but also during a risk-off recessionary shock. The dollar could only weaken when the rest of the world’s growth was outperforming the US, in a benign macro backdrop.
An analysis of the mechanics of the model explains why it broke down in 2025. Anti-fragile currencies that benefit from recessions are those from countries that are net creditors to the rest of the world, like Switzerland or Japan. In a recession or severe risk-off events, Japanese and Swiss managers are forced to cut risk in their portfolio, which can be achieved either by selling foreign assets to buy local assets or hedging the FX exposure of foreign assets. Both flows drive the CHF and JPY stronger.
The dollar, however, is a currency of the largest net debtor in the world. The Dollar Smile only worked since Alain Greenspan’s tenure (when the Fed started to promptly react to market volatility) because foreign investors would buy more ‘risk-off’ US Treasuries than they would sell ‘risk-on’ US equities, leading to an inflow to the US capital account that strengthened the dollar. But with inflation above the Fed’s target and severe question marks posed by tariffs, the Fed is not currently likely to cut rates in response to market volatility.
Fig 7: Dollar Smile vs. Dollar Frown
Summary and Conclusion
The simple logic of mean reversion suggests that the global overweight to US assets cannot rise indefinitely. In our view, the extraordinary performance of US equities since 2017 has been driven largely by fiscal excess, which has brought the US net international investment liability from USD 8trn to over USD 26trn.
We believe this extreme concentration has now peaked. Since Trump’s return to office last November, several catalysts have emerged that could trigger a rotation out of US assets. Externally, Germany’s planned reform of its debt brake and China’s stimulus point to stronger growth in key economies that, together, hold much of the US’s external liabilities. These shifts create fertile ground for capital reallocation.
The most important domestic catalyst will be the push to reduce both the fiscal and current account deficits. These consolidation efforts are likely to weigh on US earnings and the dollar, reinforcing incentives for global investors and central banks to diversify away from US assets.
For emerging markets, the implications are substantial. The scale of global exposure to US assets relative to the size of EM economies and capital markets means that even a modest shift in allocation could have a disproportionately large impact. Many EMs now combine strong fundamentals, high real yields, improving external balances, and equity markets with structural growth potential. If de-dollarisation continues to gain momentum, EMs are well-positioned to capture renewed inflows from investors seeking diversification, value, and exposure to a different cycle.
Appendix 1
Trade deal timings
- The renegotiation of the North America Trade Agreement (NAFTA) to the US-Mexico Canada Free Trade Agreement (USMCA) took 13 months (16 August 2017 to 30 September 2018), or 14 months until it was signed. The deal was only formalised by all parliaments on 13 March 2020, two-and-a-half years later.
- A study analysing 88 regional trade agreements showed that, on average, trade negotiations lasted 28 months from announcement to signature.7
- The fastest trade deals on record were the US-Jordan FTA in 2000, which took four months, followed by Australia-New Zealand in 1983, which took six months, and the Australia-UK FTA in 2021 which took one year.
Appendix 2
Consumer sentiment also driving fundamentals
i. Tourism numbers to US declining
ii. Consumers favouring EU brands:
Since early March, European media have reported a decline in sentiment towards US brands, particularly in Northern Europe where the consumer is set to be more sensitive to political tensions. With Q1 results, several global companies from McDonalds to PepsiCo distributor Carlsberg have acknowledged the trend. Limited sector wide data makes it difficult to draw firm conclusions for sportswear, but both the European Central Bank’s survey and our in-depth analysis of Google Search trends suggest signs of a shift from US leader (Nike) towards the European leader (Adidas).
Carlsberg CEO: “Then you asked around Denmark. Yes, there is a level of consumer boycott around US brands, and it’s the only market where we are we’re seeing that to a large extent”
1. See – “The inconvenient truth behind US exceptionalism”, The Emerging View, 31 January 2025.
2. See – “Impact investing: asset allocation combining purpose and returns”, The Emerging View, 25 February 2025.
3. See – https://www.whitehouse.gov/presidential-actions/2025/04/modifying-reciprocal-tariff-rates-to-reflect-trading-partner-retaliation-and-alignment/
4. See – https://www.theguardian.com/us-news/2025/may/12/china-us-agree-pause-trade-war-trump and https://www.whitehouse.gov/briefings-statements/2025/05/jointstatement-on-u-s-china-economic-and-trade-meeting-in-geneva/
5. See – Baker Institute.
6. See – https://www.bis.org/about/bisih/topics/cbdc/mcbdc_bridge.htm
7. See Martin and Messerlin (2007).