
The fiscal and monetary policy responses to the Covid-19 shock aided demand and allowed for a v-shaped economic recovery starting in 2020. Further fiscal stimulus boosting demand in 2021 were met with supply shocks, bringing US and EU inflation to the highest levels since 2008.
Emerging Markets (EM) experienced some inflationary pressures, albeit much more modest than Developed Markets (DM). We make the case for DM inflationary pressures to be more persistent than in the last decades due to structural changes in the economy.
A new global macroeconomic regime is afoot with an increasing risk of stagflation within DM. However, 2022 is likely to be another “boom” year when both GDP growth and inflation remains above their long term averages. This is a positive external backdrop for EM assets, which should be supported by higher capex-led economic growth. The most important element for relative asset price returns across EM will be the credibility of the local population on each country`s policies.
How did we get here?
1 | 2020: Fiscal policy front-loaded created excessive demand
The covid-19 shock demanded a bold response from policymakers. The first stage of the shock from February-2020 was a concomitant supply and demand shock as the affected population was forced to quarantine and companies were unprepared to operate during a global pandemic. The unprecedented uncertainty created by global lockdown policies had an acute impact on financial markets. At the worst point of the crisis, the US Treasury (UST) bond market lost liquidity and its volatility increased significantly as investors sold the “risk-free” asset in favour of cash, right in the eye of the hurricane.
With the risk-free asset of choice in limbo, the US Federal Reserve (Fed) had to act. Following the 2008 crisis, the Fed knew its job was to provide as much liquidity as needed, via UST reverse repurchasing agreement, initially to onshore players, then to global central banks. Backstopping the rout in UST allowed for limitless access to cash via the money market, which in turn provided a turning point in financial markets.
At the same time, whereas in 2008 the banks were a fundamental part of the problem, in 2020 the banks helped backstopping the crisis. Sound balance sheets and ample liquidity in money markets allowed banks to lend record amounts to large corporations as they prepared for a prolonged period of uncertainty. The liquidity supported companies` operations and allowed for the stabilisation of credit spreads.
Another big difference compared to the 2008 crisis is that the financial sector was responsible for the housing market boom and bust, leading to cautious countercyclical policies due to moral hazard. In contrast, no one could be blamed for a virus mutation that forced the shutdown of the global economy. Following the sluggish recovery from the 2008 crisis and the banks-sovereign crisis from 2010 to 2012 in Europe, policymakers were convinced that more fiscal stimulus was better than less. Across the world, governments provided loans or guarantees for small and medium sized businesses. In Europe the support came in the form of automatic unemployment insurance stabilisers (furlough schemes). The US and a number of Emerging Market (EM) economies approved legislation to provide direct income transfers to the lowest income in the household sector.
Money was literally dropped off from the sky, not by helicopters, but by electronic bank transfers directly to the populations. The fiscal expansion was funded by the sale of sovereign debt, which was mostly purchased by the Central Banks from the same countries. For the first time since Paul Volcker the lines between fiscal and monetary policy were blurred. The most important exception was China, which put a more cautious approach in place since 2015. The People`s Bank of China (PBoC) kept a tight monetary policy stance expanding its balance-sheet by only 2.2% per year from Dec-2014 to Sep-2021, contrasting with 17.0% annualised growth from May-2002 to Dec-2014. Instead, China relied on technology to deliver targeted fiscal transfers. The government credited digital RMB in the account of low-income individuals that could only be spent in approved e-commerce retailers before an expiry date. The scheme therefore guaranteed maximum efficacy when providing direct spending. Whether the families needed the extra money or not, they would have to spend. Saving was not an option.
In 2020, the fiscal and monetary twin “bazookas” were crucial to kick start the V-shape recovery. The pay cheques for low income individuals, alongside e-commerce and work-from-home capabilities for high value add service sectors allowed for the normalisation of the demand for goods. Consumers gorged on technology products, comfortable apparel as well as home improvement to adapt to the technology-enabled new normal of the world during the pandemic. And last year, the Asian supply chain centered around China was ready to supply the world with goods.
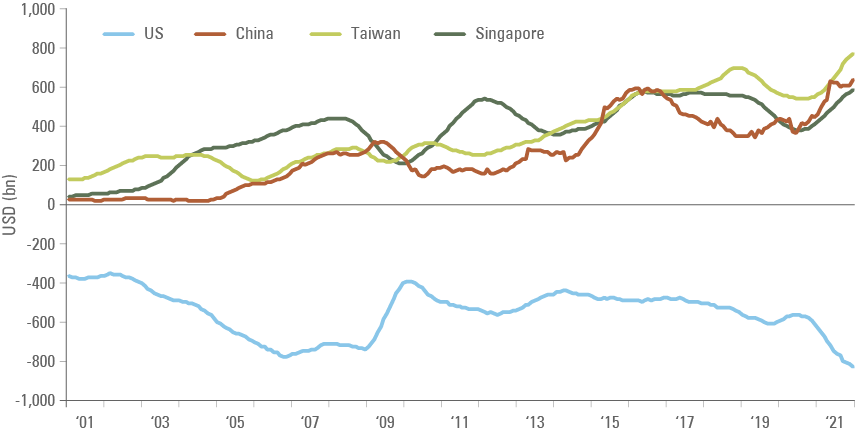
China was the first impacted by the pandemic, but also the first that managed to control the situation and reopen its economy. The experience with the outbreak of the severe acute respiratory syndrome (SARS) in 2003 helped Asian countries to fence themselves against the virus too. Figure 1 shows the trade balance of Asia’s largest manufacturing countries increased significantly after the covid-19 shock. Higher consumer goods production met higher demand from fiscal stimulus.
Figure 1: Trade balance: United States vs. Asian exporters (12-month rolling USD bn)
2 | 2021: Excessive demand met supply shocks
DM policymaker’s reaction to the crisis was far from optimal in a number of areas. In healthcare, the world has collectively failed to provide vaccines to the world population in an equitable manner, allowing the virus to mutate and spread across lower income countries. In fact, DM continues to hoard vaccines and are now administering third jab boosters to its populations while the average low-income country has not vaccinated essential workers with two jabs.
When it comes to the economy, DM policy makers opted for much larger policy stimulus than necessary to stabilise the economy. The resulting surge in demand for manufactured goods (the service sector is still to fully recover) led to shortages across the supply chain, from commodities to shipping.
In the shipping industry, Asia gained 20% market share from the EU and US in the fallout of the pandemic. That contrasts with the 0.5% yearly pre-pandemic market share increase. The large increase in demand imported products from Asia explain the bottleneck in Los Angeles’ ports and why the US, UK and some European countries are struggling to get enough truck drivers to transport the goods from ports to distribution centres.
On the manufacturing side, when the delta variant of the covid-19 virus reached Asian shores, it was met with countries still operating a zero tolerance policy to the virus (China, Australia, New Zealand). In other cases, such as Indonesia, Malaysia, Philippines and Thailand, the delta variant stressed the hospital system leading to stricter lockdowns across the region, mostly between Q1-2021 and Q3-2021. During the second lockdown, demand for Asian goods remained very high, as overly generous pay cheques to US families and furlough schemes in Europe boosted the aggregate income (and saving rates) of the populations well above pre-pandemic levels.
3 | Inflation outlook: not 1970s, maybe 1960s
Despite the supply shocks and the large monetary expansion, we believe the current inflationary pressures are very different from the experience of the 1970s. The seeds for double-digit inflation in the 1970s were sowed in the previous decade when wage growth outpaced consumer price inflation. Lyndon B Johnson`s “Great Society” programme boosted spending in education, healthcare, urban problems, rural poverty and transportation while consumer price inflation averaged only 2.4% during the decade
The higher purchasing parity from American families only translated into excessive inflation after Richard Nixon ended the convertibility of US dollars to gold in 1971, leading to a 385% appreciation on the price of gold against the greenback from Jan-1971 to Dec-1974 and a 1,339% appreciation from Mar-1971 to Mar-1981. The “Nixon shock” delivered a big hit to any country exporting goods and services to the United States.
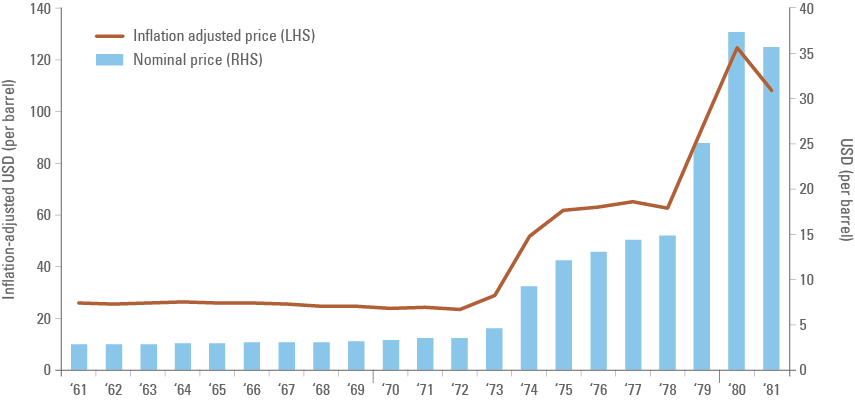
The Organisation of the Petroleum Exploring Countries (OPEC) – formed in the early 1960s – was positioned to benefit from higher oil prices. Contrary to common perception, the OPEC did not impose higher oil prices by consensus. In reality, geopolitical events such as the Yom Kippur War with Israel in 1973 and the Iranian revolution in 1978 changed the balance of power in the region, softening the ability of key players to convince the Arab world about the importance of strong and long lasting relationship with the US. In fact, the oil embargo in 1973 hit at a time when the US energy market was already struggling with shortages. By 1975 oil prices were 239% higher than 1972. The second oil price shock accelerated the 939% surge in prices from 1972 to 1980 as oil prices rose from USD 3.6 per barrel to USD 37.4 per barrel as per figure 2:1
Fig 2: Oil prices during the 1970 ‘oil shock’
Today`s economic environment is much closer to resembling the 1960s than the 1970s in our view. Structural changes in public policy and the economy suggests that inflation will be much more volatile over the coming years than most participants have become accustomed. Supply chain bottlenecks and energy shocks are only starting to emerge, like in the late 1960s, but important deflationary forces remains in place:
a. Deflationary pressures:
i. Some of the supply shocks are temporary:
We do not believe all inflationary pressures the world experienced in 2021 will become permanent. Higher prices of goods are already supporting higher investments in sector such as semiconductors. Shipping costs are also likely to normalise as ports invest to boost capacity and companies re-route some of their imports. Therefore, higher inflation in certain good categories will lay the foundation for higher investment and production at the same time that the full re-opening of the service sectors likely leads to lower demand for industrial products.
ii. Inequality
Inequality has been increasing almost on a single trend line since the oil shocks in the 1970s. The huge increase in global labour markets resulting from the end of the cold war and the Chinese inclusion on the World Trade Organisation (WTO) added to labour supply at the same time that technological progress lowered the demand for labour across economies. These dynamics kept wages under pressure. Large inequality alongside worsening demographic dynamics and higher public sector indebtedness lowered the potential GDP growth and kept inflation constrained.
Most of the wage inflation in the labour market in 2021 was concentrated in the lower income segments of the population. Whereas this should be good news for inequality, the overall impact of higher minimum wage across the aggregate income growth is relatively subdued. Many years or rising wages similar to 2021 are necessary before demand for products expands more significantly.
Therefore, the staggering level of inequality remains a headwind for inflation. Furthermore, the process of lowering inequality will demand higher taxation to the wealthier segments of the population and the process of increasing taxation is often accompanied by lower asset prices.
b. Inflationary pressures:
i. Commodity supercycle & energy transition
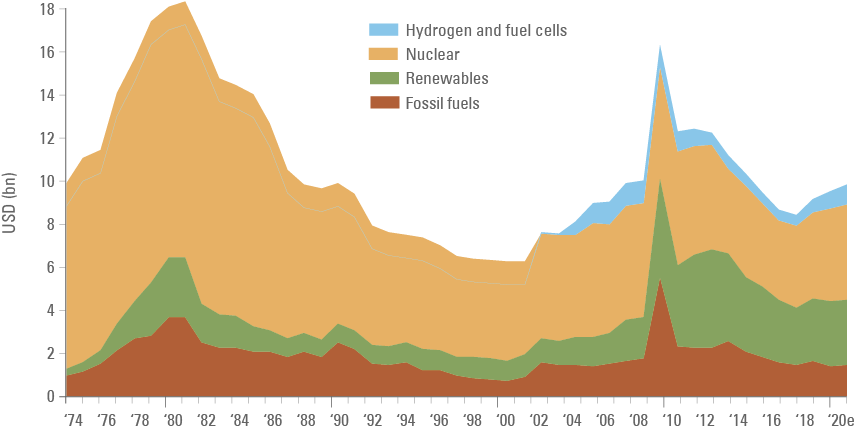
Some sectors of the economy may remain undersupplied for longer. Investment across the energy sectors, for example, declined significantly since 2009 as per data from the International Energy Agency depicted on Figure 3. The declining investment trend has broadly coincided with the 10-year bear market in commodity prices (which started in Mar-2011).2 Even more concerning, investments in the renewable energy space declined since 2009.3
Figure 3: Global public R&D spending: IEA (USD)
The green transition is likely to increase demand across commodity markets as well. The predominant electric vehicles (EVs) technology is centred in storing energy in lithium batteries, which depends on metals with a long investment cycle such as copper, nickel, lithium and others. Low investment levels in commodities are leading to shortages across important energy sources such as coal and natural gas before renewable energy sources ramp up to a significant level.
Lastly, the demand for commodities can have a significant upside if the world is serious about tackling inequality. Higher income across the low income sectors of the population are almost certain to increase demand for commodity-intensive basic goods. Different from most goods and services we measure in the economy, commodities are a volumetric market (not US Dollar based). Higher demand not met by supply can lead to outsized price movements as we have seen during the oil price shocks in the 1970s or more recently since May-2020.
ii. Labour cost pressures after a globalisation “pause”
On a global scale, China added more than 500m workers into the global economy from 1980 to 2020. The end of the cold war led to the fragmentation of the former USSR and the demise of many dictatorships across the World, particularly in Latin America and Eastern Europe, leading to much more open economies and societies. This extraordinary increase in labour supply is unlikely to be repeated.
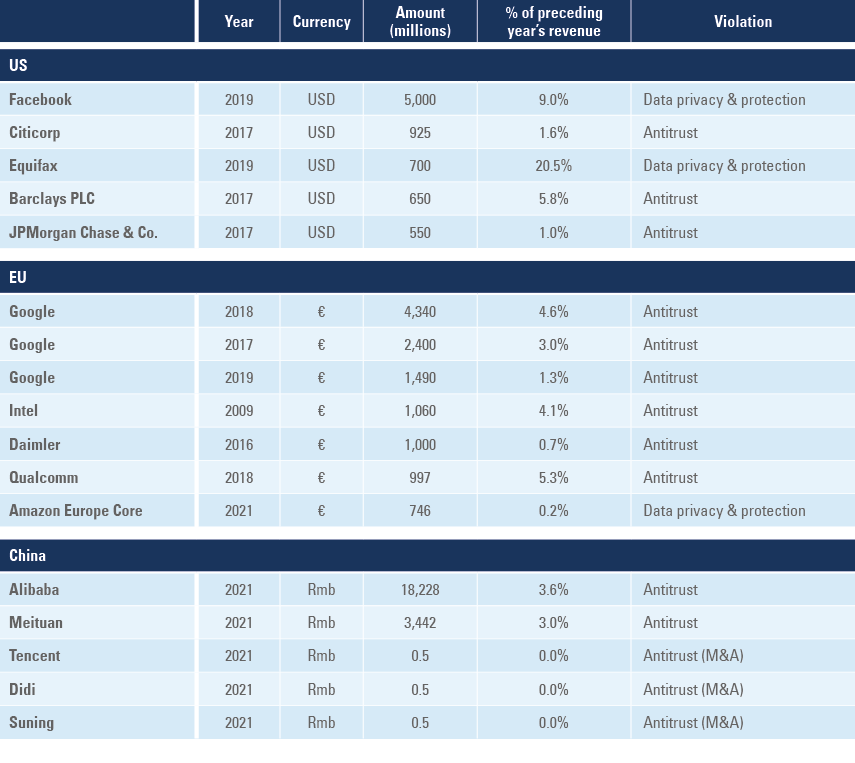
Furthermore, many large countries, including the US, UK and China are now actively working to reduce inequality by supporting low income workers and improving regulations across industries with monopolistic characteristics. China moved ahead of other large countries, regulating large new sectors of its economy such as financial technology, e-commerce, games and others and has set the target to boost the average income of its population and reducing large costs to the middle class, including education, housing and healthcare (the three big mountains). Some global regulators took note and started implementing similar measures. Regulatory pressures are already a reality in western companies (Figure 4) as well, but seem to only be priced in to Chinese markets:
Figure 4: Largest antitrust and data privacy fines in the US, EU and China
iii. Fiscal expansion needed to boost renewable energy supply:
The transition to a world with net zero emissions will demand much larger investments in renewable energy than we have seen over recent decades. Governments will have to invest alongside the private sector in a systematic and thoughtful manner to achieve such objectives. Fiscal expansion plans dedicated to investments in key sectors for the energy transition will be a very welcome development. However, even thoughtful investment in the sector will increase demand for commodities, machinery and labour that currently operates with capacity constraints.
4 | Emerging Market: reaction function to inflation
The central bank of most EM countries adopted a text-book monetary policy reaction function during the crisis, in strong contrast with its DM peers. EM central banks initially added significant stimulus and, in some countries, even supported government bonds via quantitative easing programmes, borrowing an important instrument from DM central bank tool-kit.
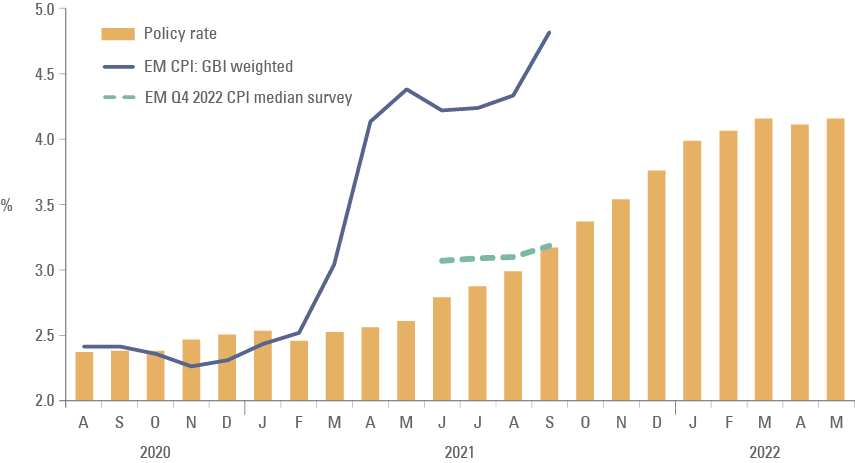
The difference is that EM central banks were much faster to react when it was clear that the global economy was in fact experiencing a supply shock in 2021. Brazil and Russia were the first central banks to hike policy rates and most others have followed. EM central banks signalled further policy rate increases, keeping real interest rates at positive levels. Figure 5 shows EM central banks are now “ahead of the curve” after increasing policy rates above 2022 consensus inflation expectations.
Figure 5: GBI-weighted CPI inflation, 2022 CPI expectation and policy rates
At the same time, there was a very large differentiation in regards to market responses to the monetary policy adopted across EM. The countries where the population trusted their government’s ability to control the fiscal situation faced little market pressures (currency depreciation and yield curve steepening) following extraordinary easy policies. The Chinese Renmimbi, Indian Rupee and Indonesia Rupiah all remained relatively well-anchored (apart from the risk-off environment in H1-2020) and their yield curves behaved well.
Indonesia was able to implement the boldest quantitative easing programme adopted by any EM country, adding significant exposure to government bonds in the balance of Bank Indonesia without suffering the much feared negative capital flight dynamics. Instead, local investors were encouraged by macroeconomic reforms and countercyclical fiscal and monetary policies allowing for a strong economic environment and added exposure to local equities. From 28 Feb 2020 to 27 Oct 2021 the Indonesia Rupiah strengthened 1.0% against the USD while the export powerhouses of Asia: China, Taiwan, South Korea and Singapore did even better as their currencies strengthened 9.4%, 8.9%, 3.7% and 3.4% respectively over the same period.
In contrast, the currency of countries that had little credibility suffered significantly. The Argentinian Peso and the Turkish Lira depreciated more than 34% from 28 Feb 2020 to 27 Oct 2021. Other Latin American countries faced with political uncertainties such as Brazil and Peru suffered foreign exchange depreciation of 19.3% and 14.3% respectively over the same period.
Most importantly, all EM countries were in the position to implement counter-cyclical policies and keep a relatively stable macroeconomic environment, thanks to: (a) deep and developed local capital markets and (b) capable policy makers in central banks. The third element (credibility) simply determined the degree of macroeconomic volatility resulting from countercyclical policies.
5 | A new macroeconomic regime: above trend inflation and growth to remain in 2022, but inflation and growth risks increasing.
We can define four economic regimes by comparing growth and inflation with their averages. The best times for market participants (and the population) are when both growth and inflation are above average (an economic boom) or when the economy is growing above average, but inflation is below average (goldilocks). During economic booms cyclical assets such as commodities and commodity-relate stocks and bonds tends to outperform, while during goldilocks both bonds and stocks do well. The most difficult scenarios occur during recessions, when both growth and inflation below average or in the unusual circumstance when inflation increases despite a recessionary economic environment (stagflation).
Since 2000, DM were in a boom or a goldilocks economy for 71% of the time (world 57%, EM 48%), from 60% of the time between 1980 until 1999 (world 60%, EM 55%). In other words, DM had an extraordinary period in terms of macroeconomic stability thanks to several factors including low labour costs (inequality), globalisation and technological development. In this environment, central banks (CBs) were able to stay behind the curve when temporary price pressures develop, and keep policy at more simulative levels for longer, thereby reducing underlying growth volatility.
However, if we are indeed entering an age where governments actively work to increase the cost of labour and the integration between DM and EM economies stall (mostly due to US-China relationship), then inflationary pressures may become more structural and DM central banks will have to become more active.
The main risk under the new macroeconomic regime over the next period is that DM central banks remain cavalier about inflationary risks when the economy is growing above average. If DM CBs do not tighten policy during a surge in inflation, higher prices will at some point be the culprit for an economic slowdown as the purchasing power of the population gets eroded. Faced with stagflation, DM CBs would be faced with the tough choice of either driving a recession or risking a deterioration on the inflationary pressures – capital markets would suffer in both scenarios.
The ideal policy mix for the future is one where DM treasuries provide fiscal stimulus necessary for the energy transition while CBs act independently to reduce inflationary pressures as currently faced in the US or fears of excessive slowdown as currently faced by China.
Therefore, for the two largest economies in the world, the Fed should get on tapering its quantitative easing policy and signalling the first rate hike for the end of 2022 to early 2023 (depending on the evolution of the data). In our view, China should and will ease monetary policy, which have been kept very tight since 2015. The People`s Republic Bank of China kept the size of its balance sheet broadly stable since 2015, contrasting with a period of strong expansion on its balance sheet in the previous 15 years.
In the short term, higher inflation is unlikely to de-rail global GDP growth significantly. Unemployment rate across DM declined much faster than central banks expected it to, while at the same time, the household and corporate sectors accumulated very large savings. With unemployment rapidly declining coupled with elevated savings rates, it is unlikely that the world economy will decline to stagflation, in our view. A slowdown is plausible, but the global economy will keep growing above its potential in 2022.
EM economies that experienced inflationary pressures are likely to end their tightening cycle by Q2-2022, whereas DM economies are just starting to tighten monetary policy. This is likely to lead to slightly lower GDP growth than originally expected across the world, but EM should be in a good position to take advantage of strong terms of trade and higher demand for its exports driving capex higher across EM.
Summary and conclusion:
The fiscal and monetary policy responses to the covid-19 shock allowed for a robust and speedy economic recovery in the second half of 2020 as the stimulus aided demand.
In 2021 fiscal stimulus boosting demand was met with supply shocks, bringing US and EU inflation to the highest levels since 2008. EM experienced some inflationary pressures, albeit much more modest than DM. We believe inflationary pressures are likely to be more persistent than in the previous decades due to structural changes in the economy, including policies to lower inequality, a pause in globalisation as well as a more cavalier approach to inflation risks from DM central banks.
A new global macroeconomic regime is afoot with the increasing risk of DM falling into stagflation increasing, but 2022 is likely to be another year of above average growth and inflation, in our view. This is a positive external backdrop for EM assets, which will be supported by higher capex-led economic growth. The most important element for relative asset price returns across EM countries during 2021 was not only the policies implemented, but credibility in their policies. This will not change during 2022.
Governments that implement structural reforms to attract more investment and lower fiscal risks will be rewarded with a virtuous cycle – particularly countries experiencing a positive terms of trade shock. On the other hand, heterodox policies undermining confidence will lead to capital flight from local companies and individuals.
1. See: https://www.federalreservehistory.org/essays/oil-shock-of-1973-74
https://www.federalreservehistory.org/essays/oil-shock-of-1978-79
https://www.opec.org/opec_web/en/data_graphs/335.htm
2. Countries included: Australia; Austria, Belgium, Brazil, Canada, Czech Republic, Denmark, Estonia, Finland, France, Germany, Greece, Hungary, Ireland, Italy, Japan, South Korea, Lithuania, Luxembourg, Mexico, Netherlands, New Zealand, Norway, Poland, Portugal, Slovak Republic, Spain, Sweden, Switzerland, Turkey, United Kingdom, United States, European Union.
3. The data does not include China or India, two or the largest producers of renewable energy in the world.