
The outlook is composed of five sections
- Section 1: Global macro review of 2021 and its repercussions in 2022
- Section 2: EM performance across different cycles
- Section 3: Scenario analysis for EM debt total returns from 2022 to 2026
- Section 4: 2022 outlook for China, US, EU and Japan (G4)
- Section 5: Four mega-trends to watch in a new macroeconomic regime
Introduction
The global macro environment is ripe for EM assets outperformance as a combination of stronger growth in China, the end of exceptionalism in the US and less uncertainty on US interest rates, lead to a strong backdrop for EM assets.
China’s GDP growth is likely to bottom in 1H 2022 after a strong slowdown in 2H 2021, led by real estate and energy crises. China is likely to ease monetary policy more aggressively and support local governments, small businesses and individuals via targeted fiscal policy measures. Policymakers are also likely to engineer a soft landing in the real estate sector by incentivising banks to extend developers’ debt maturity profiles, easing macro-prudential measures and promoting consolidation. A more balanced Chinese growth will support EM economic activity during 2H 2022, including equity markets. In Asia ex-China, the massive increase in industrial production is boosting capital investment across the region.
In the US, the fear of interest rate hikes will give way to effective hikes. The Fed will most likely remain behind the curve, keeping real interest rates at negative levels. Historically, EM assets performed poorly during the periods preceding rate hikes (fear of hikes) but outperformed when the Federal Reserve (Fed) is effectively hiking rates.
Next year may also mark the end of US exceptionalism, which started in earnest when the Donald Trump administration implemented pro-cyclical fiscal easing via tax cuts for corporations.
Biden’s overly generous Covid-19 grants to the population extended the period of US exceptionalism. Continuous pro-cyclical fiscal stimulus led the economy to overheat pushing inflation higher in 2021. From 2022, structural factors are likely to keep inflation elevated. The inflation overshoot is already constraining Biden’s progressive agenda. In 2022, US politicians will focus on the mid-term elections in October, when Biden is likely to become a lame-duck president.
In EM, commodity exporters from Latin America to the Middle East and Africa have tailwinds from stronger terms of trade, thanks to higher commodity prices. Therefore, EM external accounts are in a strong position, with several countries that usually run external deficits now running current account surpluses.
After nearly 10 years of underperformance, valuations are extremely compelling and investor positioning is extremely light across local currency assets. Countries that manage to implement solid reform agendas and/or consolidate their fiscal deficits (similar to Indonesia, Ecuador or Angola) will benefit from strong investment from both local and foreign investors.
Section 1
2021 review
Covid-19: “No-one is safe, until everyone is safe”
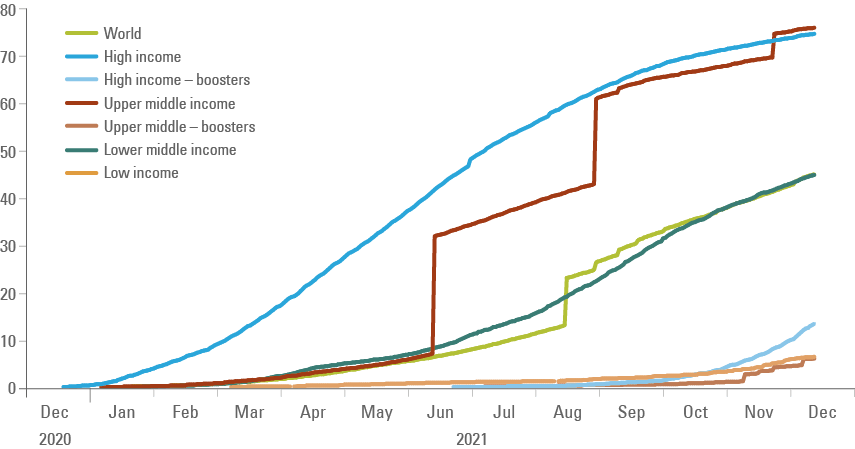
The intense pace of vaccination across the world’s largest countries was a key driver of the ‘v-shaped’ growth recovery in 2021. However, high-income countries failed to support low-income countries with vaccines and logistical arrangements to inoculate their populations, rendering the pandemic longer and more dangerous than necessary.
Figure 1, shows that 13% of the population from high-income countries (and 6% of the population from upper middle income) received a third ‘booster’ jab while only 6% of the population of low-income countries received their very first jab.1 The sheer inability to coordinate renders the Covid-19 pandemic a global endemic crisis as illustrated by constant concerns over new variants such as omicron.
Fig 1: Percentage of population vaccinated with at least one shot by income group
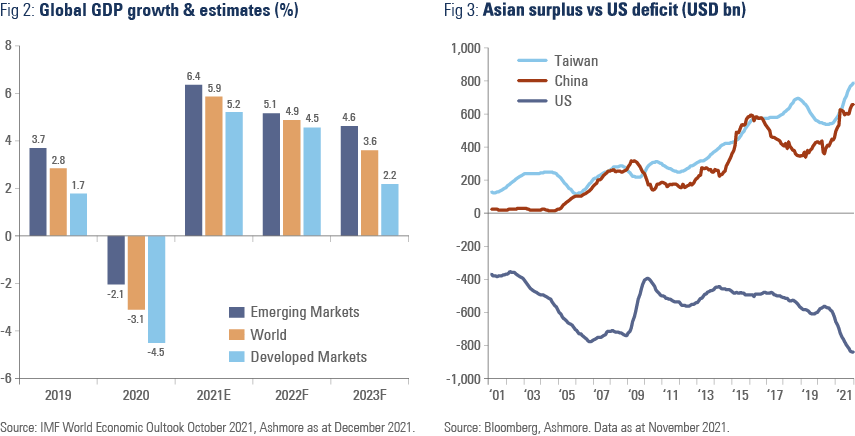
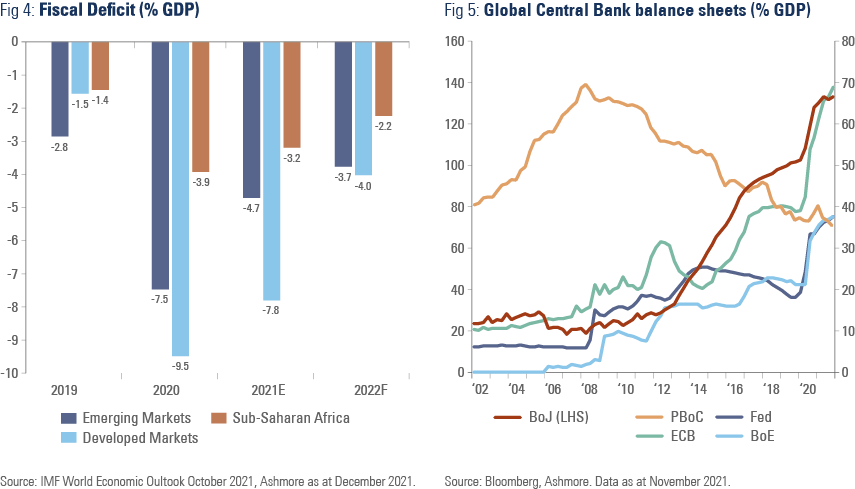
The V-shaped GDP growth recovery (Figure 2) had already started in 2H 2020, aided by massive global fiscal and monetary stimulus (Figures 4 and 5). The largest stimulus since World War II in DM during 2020 and 2021 boosted the demand for goods, predominantly produced in Asia (Figure 3).
The IMF forecasts global GDP growth to keep recovering above pre-pandemic levels in 2022, which we believe is a sound base case, supported by large household savings and ongoing economic recovery.
.
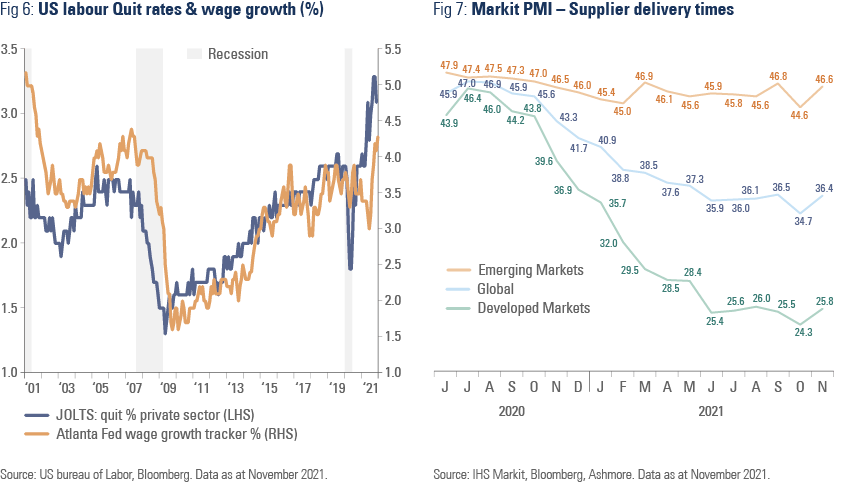
At the same time, excessive fiscal and monetary stimulus led the US economy to overheat. Half of all US small businesses are struggling to fill their vacancies right after a recession and at the same time quit rates have increased, driving wages higher (Figure 6). Labour markets are also tight in other DM economies like the United Kingdom.
Supply chain disruptions became a key issue across DM as illustrated by the poor delivery times reported at the Markit PMI surveys in DM countries in Figure 7. Global supply chains have severe problems that pre-date the pandemic. The world’s container shipping fleet, for example, is the oldest it has been since 2008. The transition of supply chains from ‘just in time’ (lean production) to ‘just in case’ (higher inventories) at the same time that the world stopped consuming services and focused on goods exacerbated the problem. A study by Morgan Stanley tracking seventeen previous supply chain disruptions since 1958 suggests the current disruptions may last until December 2022, should the current episode have the same duration as the median disruption.
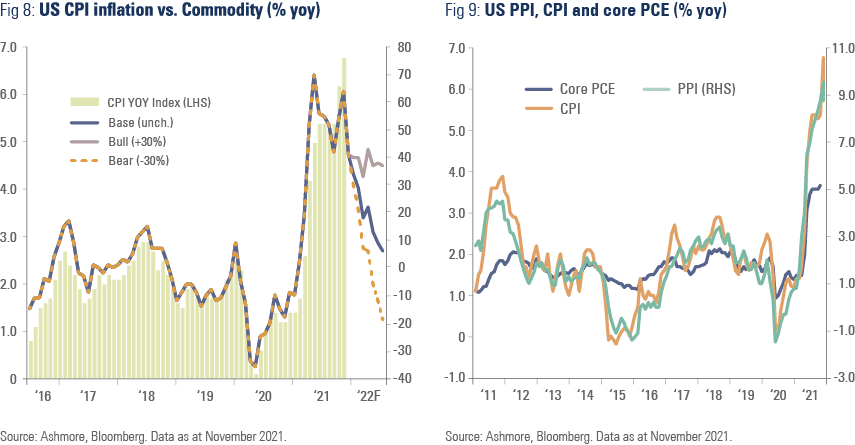
Inflation was initially led by higher commodity prices and base effects (Figure 8), but now it has spread-out across the economy (Figure 9) as CPI inflation is close to 7.0% and core PCE close to 4.0%. DM central banks are at risk of losing control of inflation expectations and gambled with their credibility by keeping monetary policy too lose for too long.
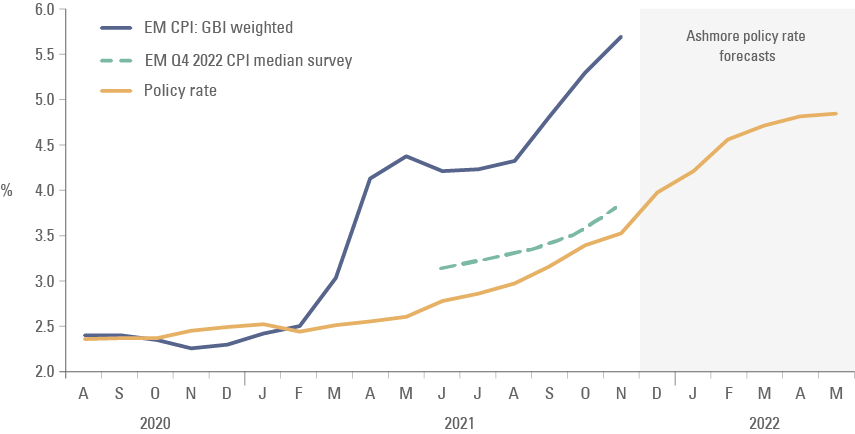
In sharp contrast, EM did not subscribe to the ‘transitory inflation’ thesis. Despite experiencing much larger output gaps than DM economies, EM central banks tightened monetary policy during 2021, and are now ahead of the curve in the process of controlling inflation as EM policy rates was above 2022 inflation expectations (Figure 10) already in mid-December.
Some G-10 central banks such as Norway and England, have already started hiking policy rates and we think most global central banks will tighten monetary policy during 2022 (with exception of Europe and Japan).
Fig 10: GBI-EM GD weighted EM policy rates
EM assets went through a challenging macro environment in 2H 2021. The combination of the fear of the Fed hiking policy rates alongside a sharp slowdown in growth expectations in China (regulations, real estate and energy shortages) kept EM assets on the back foot.
In our view, 2022 EM assets are likely to perform well as China eases monetary policy, leading for a stabilisation and recovery in GDP growth as the fear of Fed hikes gives way to a hiking cycle, an environment where EM assets performed well historically.
Section 2
EM Assets across cycles: No fear of Fed hikes
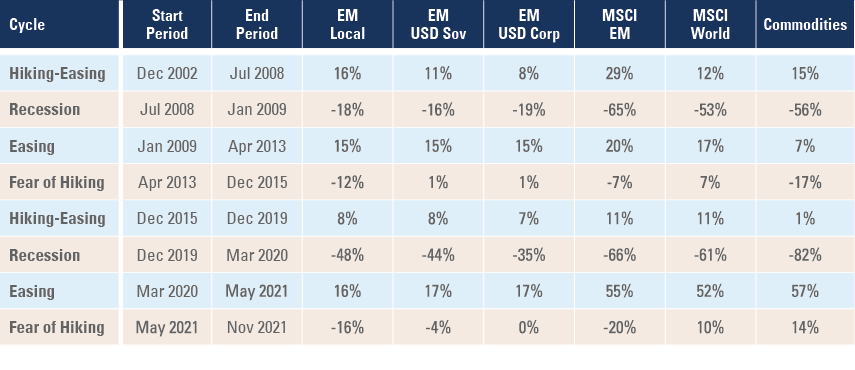
The chart in Figure 11 and table in Figure 12 show that EM local currency assets outperformed during both hiking and easing cycles. Between December 2002 and April 2008, EM local bonds delivered 15% annualised returns, thus outperforming other EM fixed income asset classes as well as global (and US) equities. During this period, the MSCI EM performance was double that of MSCI World.
Similarly, in the four years between December 2015 and December 2019 – another hiking cycle followed by a correcting easing cycle – EM assets performed well despite soft commodity prices. During this period, the MSCI EM performance was in line with the MSCI World and local currency bonds posted high-single digit annualised returns.2 Figure 11 shows that EM assets also performed very well during easing cycles, when the MSCI EM marginally outperformed the MSCI World and EM fixed income posted double-digit total annual returns.
On the other hand, EM assets sold-off during recessions, as the MSCI EM marginally underperformed the MSCI World in the worst drawdowns of the past 20-years. In relative terms, EM assets underperformed the most during when the market is starting to price in a hiking cycle (fear of hiking).
It is interesting that EM local bonds sold-off last year despite the fact that commodity prices were strong, as the market started pricing in higher odds of a Fed hike. This price divergence renders EM local bonds an attractive asset class (deeply discounted), particularly if we are to experience an inflationary scenario where commodity prices remain buoyant for longer.
Fig 11: EM local currency bond total returns vs. Fed Fund & Commodity
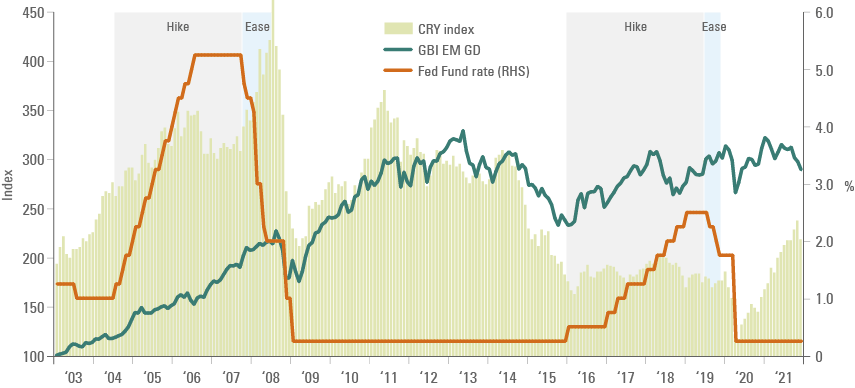
Fig 12: Annualised Returns by asset class across cycles (%)
Section 3
2022 to 2026 total return scenario analysis for EM Debt
Our preference for local assets (vs. external debt assets) is also borne out by our 1-year and 5-year scenario analysis. On a 5-year horizon, EM local currency assets outperform US Dollar denominated fixed income across all scenarios (Figure 13). In the five-year bear case scenario for EM local assets, total returns are still positive even after incorporating a 22% depreciation in local currencies, which would bring EM currencies to new lows in real effective exchange rate terms.
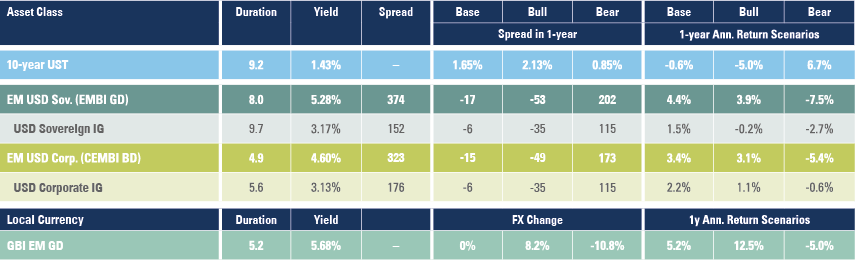
The bear case scenarios for one year (Figure 14) incorporate large losses for EM hard currency assets due to the impact of the credit spreads widening (to 576bps on EMBI GD and 496bps on CEMBI BD) on total returns. These levels of credit spreads are associated with recessions and tends to be temporary.
Fig 13: 5-year scenario analysis3
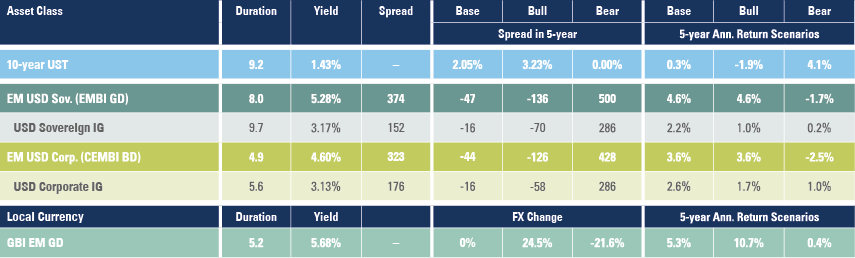
Fig 14: 1-year scenario analysis
Section 4
2022 Global Outlook: G4 countries
1| China
China is very likely to keep its zero tolerance policy against Covid-19 as the bar to reopen the economy is high. The country has relatively limited intensive care unit capacity vs. other large economies. The population is generally more cautious about health risk and the government benefited from the fact that it has managed to keep cases at extremely low levels throughout the pandemic.
Furthermore, by keeping its economy closed, China’s external accounts will benefit from low levels of outbound tourism spending worth c. USD 250bn during 2019. On the other hand, the trade surplus should narrow during 2022 as global spending on services rises – a trend that has been delayed by variants.
Overall, China’s real GDP is likely to expand at around 4.5% to 5.5% in 2022. Economic growth is likely to remain soft until Q1 2022 due to the ongoing slowdown in the housing sector and the Winter Olympics in Beijing keeping a lid on emissions, as the leadership want to display blue skies to the world and keep the air clean for athletes. However, the economy should rebound during the year as the economy benefits from belated monetary policy easing. The People’s Bank of China (PBoC) lowered its reserve requirement ratio in 2021 and signalled further steps to ease monetary policy next year. Importantly the politburo has shifted its intended pace of economic rebalance, favouring stability and economic growth in lieu of common prosperity over the short-term. Fiscal policy is also turning counter-cyclical, leaning against the current economic slowdown.4
Over the medium-term, common prosperity will remain a key policy of Xi Jinping’s third term in power. Xi’s ultimate goal is to boost the country’s fertility rate and lower the risk of secular stagnation. By lowering the cost of housing, education and healthcare (the ‘three big mountains’), Beijing expect people to have an incentive to have more children, allowing its demographic policy shift (from one-child to three-child policy) to work. Therefore, Beijing will channel capital to social housing, broadening high quality education (an area that China already excels) and widening the widening the country’s safety net (childcare, elderly care, healthcare and pension security).
A stronger demographic profile alongside the development and production of top-technology products onshore would also allow China to reduce its dependence on other economies and rebalance its economy by increasing the share of consumption while fixed asset investment becomes a smaller contributor to overall GDP growth.
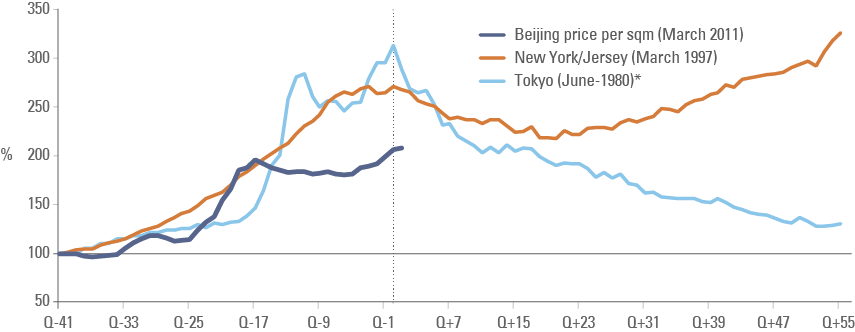
In order to achieve this progress, Beijing will have to engineer a soft landing in over levered sectors of its economy, including the housing sector. We have laid out our view on the Chinese housing market in a recent market commentary.5 In brief, the housing market in China will have a very different fate than both New York and Tokyo, depicted in Figure 15, in our view. Beijing started taking steps to avoid a real estate bubble in 2015 as the PBoC tightened monetary and macro prudential policies for mortgage lending.
House prices are likely to stabilise at a relatively high level in top tier cities in 2022, as valuations will remain expensive to income levels until income rises. Easing monetary and macro prudential polices will allow for a consolidation in the sector and better conditions for a large share of the population that still wants to buy a house in cities. After all, China still has 36% of its population living in rural areas and the country’s path to high-income status requires further urbanisation, implying another 150 million to 300 million individuals moving to cities over the next decades.
Fig 15: Will Beijing follow New York, Tokyo or neither?
2| United States
Economic activity is likely to remain supported (above trend GDP growth) as the high levels of savings in the household sector are spent and wage growth accelerates due to a tight labour market. Inflation is likely to remain under pressure as wage inflation stays above 4% per year and the lenient attitude of the Fed keeps inflation expectations unanchored, despite the gradual normalisation of supply-chains. The Fed will hike policy rates, but with three hikes fully priced in, the risk for a hawkish surprise is relatively small. The key risks to watch for the next 12-18 months are:
a) The US yield curve steepen aggressively, pricing in a higher ‘terminal’ interest rate as inflation expectations rise. In this scenario, the US Dollar should underperform, as short-term real interest rates remain depressed.
b) The economy slowing down faster than expected if inflation remains above wage growth for longer and the savings buffer is spent away. This would require the Fed to U-turn as risk-assets collapse.
Build Back Better may still be approved in 1H 2022, but only after the Senate implements significant amendments to correct some elements of the bill such as large subsidies for electric vehicles. This will be the last big piece of policy approved as politicians shift attention to mid-term election. The base case scenario for US elections is Biden becoming a lame-duck president as the Democratic Party loses control of the House of Representatives and the risk scenario is they also lose the Senate. If the Republicans control both houses of parliament, institutional risks will build-up again in 2024 as Trump comes back to the scene.
3| Europe
Economic activity in Europe is likely to remain supported, like in the US, by high saving rates on household balance sheets. The European Central Bank (ECB) will taper its asset-purchasing programme throughout 2022, but keep rates unchanged at record low levels, as inflationary pressures in the EU are largely due to higher energy prices. Europe would do well to channel its monetary largesse to infrastructure investment, including energy. This would help to lay the foundations for lower risks ahead, but will also keep economic activity growing above potential and the same wage-inflation price dynamics that hit the US in 2H 2021 may hit Europe in 2022.
Immigration will remain a key issue within the EU. Several geopolitical flash points including Belarus, Ukraine, Turkey, Lebanon, Syria, Iran and North Africa will keep threatening the integrity of the union. The risk is that the ‘ever-closer’ EU is disrupted by a clash between protectionists (who wants an ‘ever-closed’ EU) and pragmatists who understand the importance of immigration for economic growth. The German economic transition and French elections as well as whether Draghi manages to remain in power will be important dynamics to watch.
4| Japan
The Japanese economy is likely to be the only DM economy in a goldilocks environment next year with GDP growth around 3% and core CPI around 1.0% in 2022. A gradual increase in mobility allowed by low Covid-19 cases should drive the services sector driven.
Inequality reduction is also a mega-trend impacting Japan. The Liberal Democratic Party remained in power after October 2021 elections with a platform to promote economic growth aided by lower inequality. The government aims to provide JPY 100k (c. USD 900) in cash and vouchers to low-income households hit by the pandemic and children under 18-years old. An income transfer programme financed by asset purchases from the Bank of Japan (BoJ) may drive inflation higher, but is unlikely to lead to a shift in monetary policy in the short-term.
Japanese companies are likely to benefit from higher local and external demand, but their profit margins will be under-pressure from high-energy prices, supply chain disruptions and a stronger currency. Companies will struggle to pass-through higher cost to consumers, leading to narrower profit margins. The JPY is likely to strengthen against the USD (and other DM currencies) as low inflation will keep real interest rates elevated compared with other DM economies while stronger than history economic growth boosts the attractiveness of Japan.
Section 5
Mega-trends (themes): A new macro regime
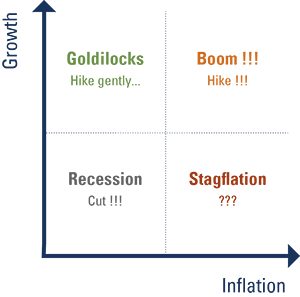
A number of long-term trends will bring a new macro regime away from goldilocks (high growth, low inflation) into a higher inflation environment, as several structural trends will move from being deflationary to inflationary. A macro regime with higher inflation will have profound implications for asset allocation, a trend that is likely to support higher investments into Emerging Markets, in our view. After all, most emerging market countries benefit from either higher commodity prices or higher trade as a percentage or global GDP, and both gain from more inflation.
Fig 16: Macroeconomic regimes: less goldilocks
Theme 1| Low real interest rates & debt dominance
Despite higher inflation in 2021, the first historical mega-trend to highlight is one of interest rates moving structurally lower. This trend pre-dates the recent 30-40 years of history when the secular stagnation thesis became notorious. A paper by Bank of England’s Paul Schmelzing studying the history of inflation and risk-free bond markets (countries or city-states issuing dominant reserve currencies) shows the declining trend in both inflation and interest rates is traceable from the 14th century (Figure 17).6
Fig 17: Nominal bond yields, GDP – and arithmetically-weighted, 1314-20187
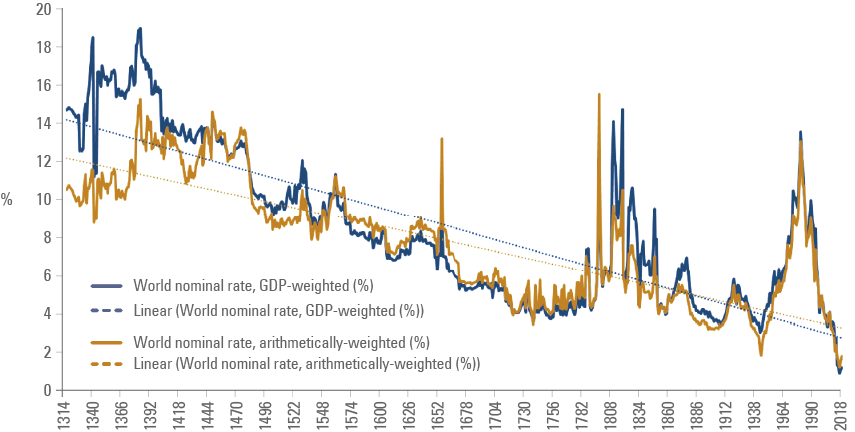
Of course, this trend was not strictly linear. There have been noticeable generational bumps on the road when the downwards inflationary trend is disrupted by a ‘temporary’ sharp increase in inflation. These inflationary spikes tend to coincide with factors such as the availability of precious metals; wars involving the world’s largest economies, and/or; pandemics disrupting the labour market. Examples of wars leading to a spike in inflation included the Hundred Year’s War (1337-1453) during the late medieval period, the War of the Roses (1455-85), the Seven Years’ War (1756-1763), preceding the French Revolution (1789) and the Napoleonic Wars (1803-1815), as well as the First World War (1914-1918) and the Second World War (1939-1945). Inflation also spiked meaningfully during pandemics such as the Black Death (1346-1353).
The trend of lower inflation and lower risk-free rate is an important one for investors as history suggests that inflation and interest rates are (a) rarely stable over the short term; (b) have a strong tendency to trend downward and (c) have remained negative (in real terms) for long periods of time.
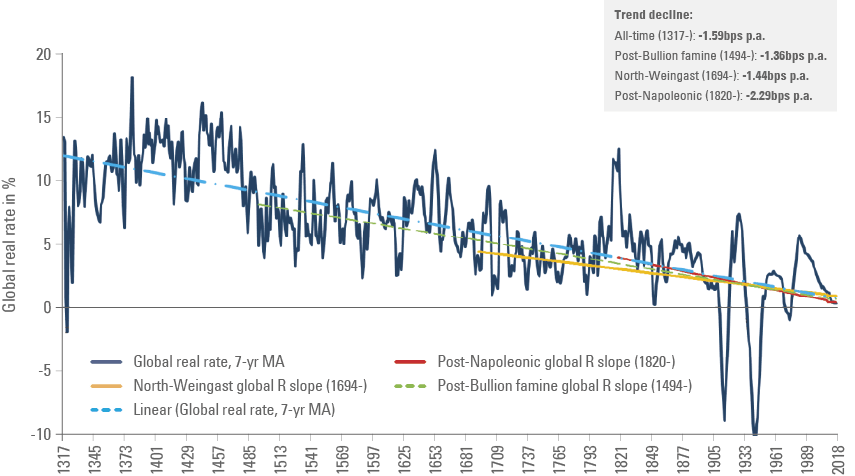
Perhaps Covid-19 will disrupt the long-term inflation trend for a number of years, but it will not alter the long-term decline in real interest rates. After all, the large expansion of debt-to-GDP means central banks will keep real interest rates drifting towards negative levels, in line with the long-term trend depicted by Figure 18, in order to lower the debt burden on public finances.
Fig 18: Headline global real rates, GDP-weighted, and trend declines: 1314-20188
Theme 2| Inequality
Income inequality is a trend leading to deflationary pressures. This is an obvious insight: as a larger share of aggregate income flows to the wealthier part of the population, demand for financial assets (savings) increases at the expense of demand for good and services.
Not only did the pandemic make the inequalities more visible, but also several responses to the pandemic (i.e. monetary policy boosting asset prices and technology oligopolies further consolidating their dominant position) exacerbated income inequality further. Income transfer policies helped to reduce inequality, but doing too much of it in the middle of a clogged supply chain led to high levels of inflation, which eroded the purchasing power of the lower income cohorts the most.
We have highlighted the reversal of inequality would become a key theme in our annual outlooks for the past two years. Now we have evidence this is a trend that will develop further over the coming years. Democratic or not, governments are under pressure to reduce income inequality. Joe Biden’s ‘Build Back Better’, Boris Johnson’s ‘levelling up’ and Xi Jinping’s ‘common prosperity’ are policies sewed from the same cloth.9
If inequality is a source of deflation, reversing inequality will be inflationary, in our view. As a larger share of aggregate income goes to the lower income segments of each country, the demand for basic goods will increase. After all, the poor have pent-up demand for basic goods from food to healthcare, apparel, housing and transportation. This means that demand for commodities (particularly agriculture and energy) is likely to increase. Commodities are volumetric markets that require investment to boost supply (unlike financial assets that growth together with monetary expansion).
Several commodities have a multi-year investment cycle; hence, as demand rises, supply will be slower to respond, leading to higher prices. This is particularly true across commodities suffering from declining prices and low investments such as energy and some metals that are key for energy transition.
Theme 3| Energy transition
One of the main deflationary forces of our generation was the outsourcing of production from the West to Asia (mostly China). Outsourcing production made everything cheaper due to three reasons: (a) better production processes; (b) cheaper labour and; (c) cheaper energy.
To illustrate the scale of the outsourcing, just look at China’s steel production, which increased almost 10-fold from 129 million tons in 2000 to 1,024 million tons in 2020, rising from c. 15% to 53% of global steel production within the last two decades. In contrast, global steel production ex-China expanded by only 6% over the same period.
This massive increase in production would not be possible without a cheap source of energy. Figure 19 shows that between 2000 and 2010, China expanded its coal production by 44 exajoules, equivalent to 83% of the increase in coal consumption. During the same period, coal moved from 25% to 30% of the world energy consumption, while remaining equivalent to 70% of the energy matrix in China.
The outsourcing of production to coal-powered China was deflationary and helped to lower the volatility on good prices. Coal is the cheapest source of traditional energy, extremely abundant (in most countries) and relatively easy to explore. Therefore, coal prices are not only low, but also stable. China is now the largest producer of solar and wind power hardware, fully committed to changing its own energy matrix to clean energy and is set to benefit from elevated global demand for renewables.
Fig 19: Coal consumption: World and China (in exajoules)10

Bloomberg New Energy Future (BNEF) estimates investments in energy supply and infrastructure between USD 94trn and USD 175trn by 2050. This means that annual investment will have to increase by 2-3 fold, from c. USD 1.7trn per year, to between USD 3.1trn and USD 5.8trn, on average, over the next thirty years.
A transition to green energy where solar and wind energy become the predominant source of production would demand between USD 41trn and USD 68trn of investment in storage and transport, for example. In contrast, investment in global energy transition has achieved USD 0.5trn in 2020 with renewable energy investment stable at around USD 300bn per year since 2015.
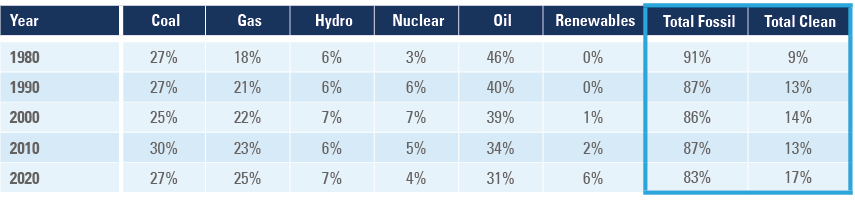
These are big capital investment numbers that will be challenging to execute, particularly considering the very small investment in nuclear energy over the last years and the small share of renewables in the global energy matrix as per Figure 20. We are confident the world will succeed in transitioning to a cleaner energy matrix, but the accelerated pace of transition and investment is likely to be inflationary.
Fig 20: Global energy matrix (% of total consumption)
Theme 4| Big tech regulation: From China with love
Another factor weighing on asset prices over the next years is the regulation of technology sectors on a global basis. Several companies and entire industries, such as financial technology (Fintech) and social media benefits from significant regulatory and tax arbitrages vis-à-vis traditional sectors.
Business models based on growth rather than profits and global tax system loopholes explains the majority of the tax arbitrages. Therefore, the new minimum 15% global tax approved this year and effective by 2023 will address some of the issues faced in taxing large corporations (including big tech).
However, the regulatory arbitrage is the most pronounced. Traditional media groups have strict editorial regulations in order to avoid abusive practices. On the other hand, new media companies, despite their much deeper resources have little-to-no control of the content and in many circumstances benefits from predatory advertisement targeting specific population groups that are vulnerable to influence. On its worst form, new social media companies reaped nice profits as they helped to polarise different opinions and political views, often using false arguments, spreading lies and mistrust across society and influencing political outcomes.
China is leading the process of regulating big technology companies. Several thoughtful regulations were implemented in the Fintech, gaming and educational industries. The core intention of the regulation was to balance society, reduce the influence of monopolies and reduce the regulatory arbitrage between new ‘technology’ companies and traditional businesses.12
There is a big contradiction baked in asset price valuations. Companies that have environmentally unsustainable practices (i.e. oil companies) are being punished with higher cost of capital, but companies that benefit from socially unsustainable practices (social media) and create platforms that lead to monopolistic positions benefit from a boom in valuation.
In our view, the massive valuation premium baked in the asset price of companies enjoying tax and regulatory arbitrages is likely to disappear over the next years as the Western countries (led by EU) implement similar regulations and adjust their tax systems. In our view, investors should be looking to diversify their exposure from overpriced US tech companies towards companies that will benefit from the first three mega-trends mentioned in this paper and to EM tech companies where the valuation is already consistent with the absence of tax and regulatory arbitrages – such as China and increasingly, South Korean technology stocks.
Conclusion
After a strong V-shaped recovery in 2021, global growth is likely to slow-down due to the withdrawal of stimulus, higher inflation levels and the Covid-19 pandemic becoming endemic. However, the large amount of savings in the household sector across DM will keep the global economy growth above pre-pandemic levels. The Chinese economy is likely to rebound over the next quarters as they add monetary and fiscal stimulus while the US will tighten both fiscal and monetary policy.
The cyclical slowdown has to be viewed against four mega-trends that will be evolving in a multi-year period:
- negative real interest rates and debt dominance;
- reversal of inequality;
- energy transition;
- tech sector regulation.
These mega-trends will support the shift to a new macro-economic regime, away from goldilocks, where inflation remains higher than over the last decades.
The global macro environment is ripe for EM assets outperformance due to the combination of stronger growth in China, the end of American exceptionalism and less interest rates uncertainty in the US as the Fed hiking cycle starts. We believe that EM local currency assets have particularly good total return potential, as EM commodity and industrial production exporters’ benefits from high inflation against a backdrop of undemanding valuations, and light technical positions.
1. Income levels by GNI per capita: https://blogs.worldbank.org/opendata/new-world-bank-country-classifications-income-level-2021-2022
High income countries: above USD 12,695
Upper-middle income: from USD 4,096 to USD 12,695
Lower-middle income: from USD 1,046 to USD 4,095
Low-income countries: below USD 1,045
2. The MSCI World largest component are US stocks, which boomed since 2016 thanks to the pro-cyclical fiscal stimulus via tax cut during the Trump administration.
3. Assumptions:
10-yr US Treasury:
- Base case: to 5-year forwards;
- Bull case to highest levels since 2011
- Bear case: to 0.0% (new all-time low)
Credit Spreads:
- If US Treasury widens credit spreads tighten (Sovereign: 0.75x; Corporate: 0.7x)
- If US Treasury rallies, EM credit spreads widen (Sovereign: 3.5x ; Corporate: 3.0x)
- Local current bonds
Clip coupons plus 0.43x 10-year UST yield change plus FX gains/losses
- Currency: bull case: EM REER rallies to its highs; bear case: EM REER sells-off below its lows
Defaults:
- Base case: average default last 10-years (Sovereign: 0.45%. Corporate 0.86%)
- Bull case: best default in 10-years (Sovereign 0.0%; Corporate 0.43%)
- Bear case: worst default levels in 10-years (Sovereign: 1.25%; Corporate: 4.3%; Local 0.50%)
4. See: http://en.qstheory.cn/2020-07/15/c_524065_2.htm
5. See: ‘A consolidation path for Chinese property‘, Market Commentary, 7 December 2021
7. The series excludes hyperinflation years in Germany from 1919-1923.
8. The series excludes hyperinflation years in Germany from 1919-1923.
9. See https://www.whitehouse.gov/build-back-better/ https://www.gov.uk/government/speeches/the-prime-ministers-levelling-up-speech-15-july-2021 http://www.xinhuanet.com/english/2021-08/18/c_1310133051.htm.
10. One exajoule equal to one quintillion (1018) joules. One joule is the amount of electricity required to run a 1-watt device for 1 second.
11. See https://www.bp.com/en/global/corporate/energy-economics/statistical-review-of-world-energy.html
12. See: ‘China’s new development strategy: greener, less unequal, more sustainable‘, The Emerging View, 30 September 2021.