
Emerging Markets (EM) have faced a challenging environment over the past five years, due to a series of global shocks that have triggered elevated market volatility and led the MSCI EM equity benchmark to experience its most protracted drawdown in history. In this environment, global asset allocators effectively deprioritised EM, risking suboptimal allocations.
There are five reasons why asset owners should consider re-engaging with EM equity.
1 | EM is too big to ignore
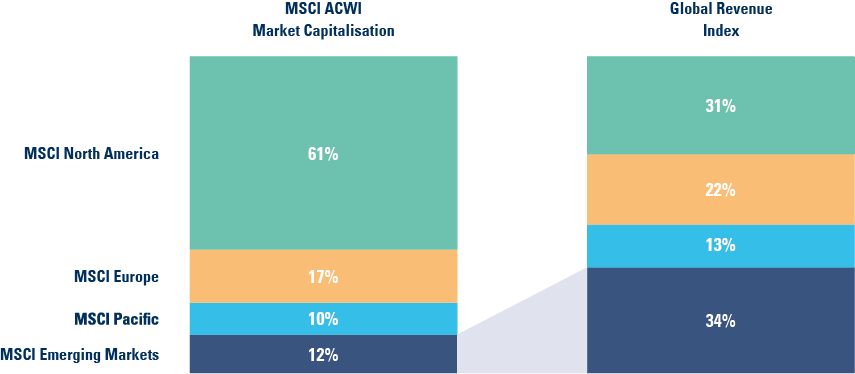
Global allocations are often framed by third party-defined weightings such as the MSCI All Country World Index.1 This market cap-based index requires investors to have a 12% EM exposure for a neutral position. Pension fund surveys suggests the sector holds a material underweight, highlighting investors’ light positioning. However, this misses a more significant point. Market cap-based approaches grossly underestimate EM’s importance. EM represents 60% of global gross domestic product GDP (based on purchasing power parity), underpinned by 88% of the world’s population. More relevantly for equity investors, as Figure 1 shows, 34% of global revenues derived from EM, while North America is massively overrepresented in relation to the share of global revenues.
Fig 1: Global revenues
2 | EM specialisation and diversification matter
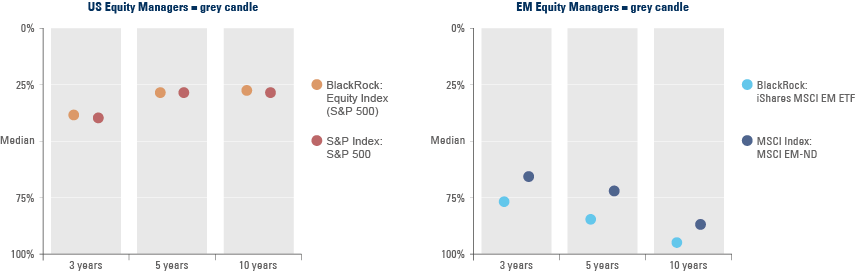
EM’s earlier stage of development and secular growth drivers – such as better demographics and technological leapfrogging – mean they have a higher return potential. However, EM’s evolving macroeconomics, immature institutions and more complicated governance structures also mean they can be volatile and are traded as a ‘risky assets’. These characteristics create significant market inefficiencies and ample opportunities for active managers, and as a consequence, 75% of EM equity managers outperform their benchmark over time, compared to 25% for US equity managers.
Fig 2: EM is inefficient
Some investors choose to access EM equity markets indirectly, via global equity managers who consider EM stocks as part of their global portfolio, or by investing in developed markets (DM) multinationals that generate some of their revenue from EM. Both approaches are suboptimal, in our view.
The first tends to result in an under-allocation to EM, as global managers typically focus their limited resources on DM, their largest ‘benchmark risk’. According to data provider eVestment, global equity managers held on average only 6% in EM as at 31 December 2022. With the second method, the investable universe is materially reduced with negative implications for portfolio diversification and alpha generation. The MSCI World with EM Exposure index, comprising DM stocks with the most revenue generated from EM, has 80% fewer companies than MSCI EM. Furthermore, both approaches are compromised by overinflated stock prices. The price-to-earnings ratio for the MSCI World with EM Exposure index is 80% higher than for the MSCI EM index!
Lastly, investing directly in EM pays off: Ashmore EM Equity stands at the top-decile of its peer group over five years in Morningstar’s universe to 28 February 2023. See: Ashmore Emerging Markets Equity Fund 5 year anniversary!
3 | EM is central to the climate solution
Successful investing in EM requires a deep understanding of environmental, social and governance (ESG) factors. EM is likely to face a disproportionate impact from sustainability challenges, in particular climate change. Yet, EM also have the most compelling investment opportunities linked to the attainment of the Paris Agreement targets and the United Nations Sustainability Development Goals, which over time can be a source of alpha.
Successful ESG investing is complex and prone to challenges. Ashmore’s solution is a standardised, principles-based, scoring framework that is both backward and forward-looking. For instance, companies are penalised for a poor track record of ESG performance yet are rewarded where they acknowledge areas of weakness and commit to improving. Scoring is on an absolute global basis, rather than in comparison to EM or industry peers, which promotes a ‘best-in-class’ assessment based on guidelines consistently applied.
The supply chains of many of the world’s largest companies are based in EM, giving rise to risks which can often be hidden. Primary research helps Ashmore to identify high risk suppliers, which can be mapped to production companies and eliminated from the investment universe. Engagement helps to promote robust policies, third-party verification audits and a strategy of sourcing away from high-risk suppliers.
In addition, Ashmore’s climate disclosures are consistent with TCFD requirements.2 All holdings are scored on climate and other ESG factors, with some portfolios in scope under net zero targets. The carbon intensity in Ashmore EM Equity and EM Equity ESG is consistently 50-75% lower than the MSCI EM Index.
See: The reality of ESG integration in Emerging Markets equity
4 | China: from bust to boom
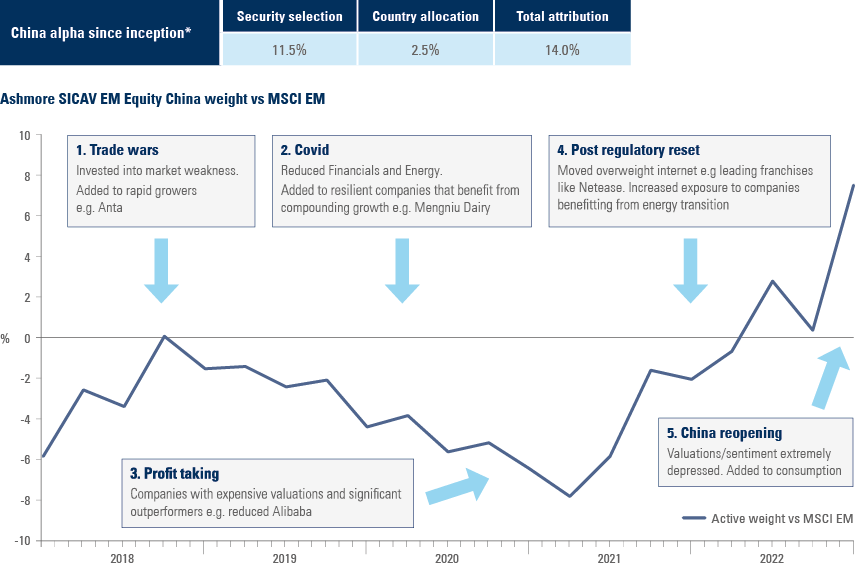
China has reversed several burdensome policy stances and reprioritised economic growth. This should trigger positive earnings revisions and an expansion of share price multiples. The economy’s reopening after Covid has surprised in its speed and magnitude, setting a path to recovery. This creates significant upside for the services’ sector as well as China’s trading partners. In the real estate sector, after an abrupt deleveraging effort, policy has shifted to stabilising distressed developers, supporting the industry. Policies associated with anti-corruption are cyclical, in our view, and has recently turned constructive with public support for the technology and platform economies, underpinned by China’s necessity to compete in a sector of global strategic importance. China has room to ease monetary policy as inflation remained below target. Within this, there is an increasing focus on sustainability in energy sources and in cities. Meanwhile, Sino-US policy opacity means it is likely to remain a source of market volatility.
Hyperbolic news headlines and shifts in investor sentiment provide excellent investment opportunities, as reflected in our significant alpha generation over the recent period. We currently find attractive investments across consumption, power transition and property services.
Fig 3: Active management in China
5 | A period of positive inflections
The outlook for EM has materially improved given several market headwinds are turning into tailwinds. For example, policy actions in China have reversed course and are now pro-business, to the benefit of EM trading partners.
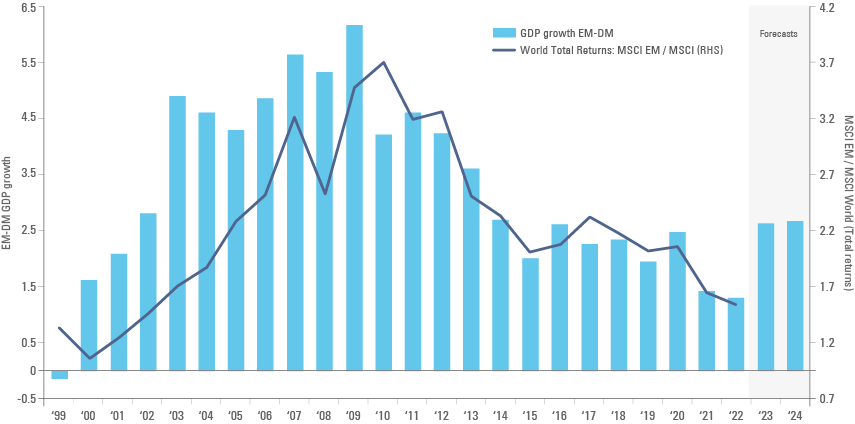
Looking beyond China, other EM countries will also benefit from an improving economic profile compared to their developed market peers. For instance, market consensus expectations (Source: Bloomberg) sees EM real GDP growth outpacing developed markets by 3%+ in 2023 and 2024. Historically, there has been a close relationship between an expanding growth premium and relative stock market returns, and there is little reason to believe this time should be any different.
Fig 4: GDP Growth EM – DM (IMF WEO) vs. MSCI EM to MSCI World total returns
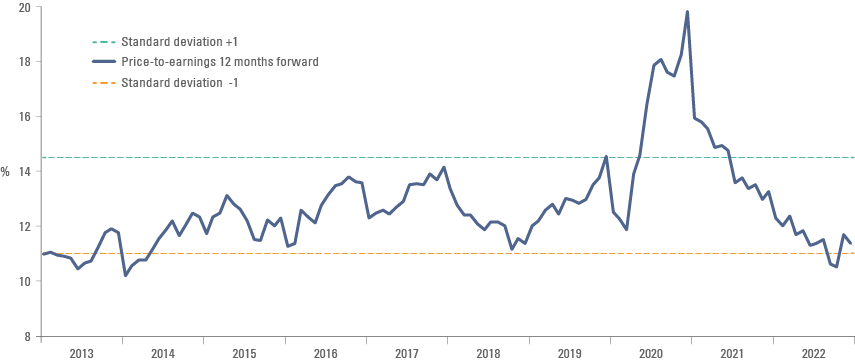
After the longest market drawdown in history, investor positioning in EM equities is currently light. The MSCI EM Index trades around 11.0x forward earnings, below its long-run average of 12.5x. Meanwhile, 2023 earnings growth expectations are prudently in the single digits after declining by around 15% from their highest levels in 2022.
Fig 5: MSCI Emerging Markets price to earnings ratio
Encouragingly, there is increasing evidence of EM corporates cutting costs and maintaining capital expenditure discipline. Thus, margins can expand as higher revenue growth is led by increased demand and lower costs, among other high conviction investments.
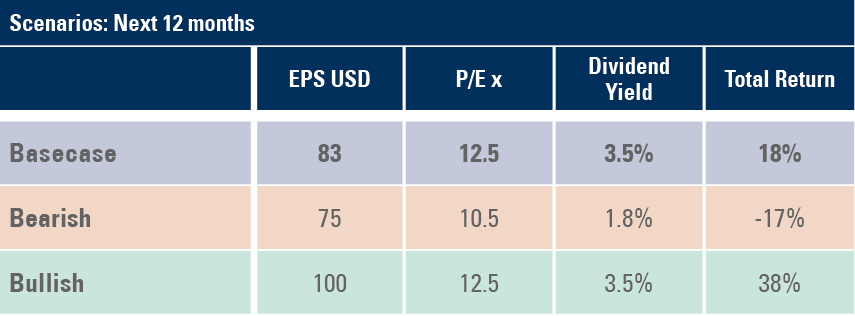
A conservative base-case scenario assumes the current dividend yield of 3.5% and EM multiples rising to 2.5x earnings, leading to ‘high-teen’ returns, as per Figure 6. As always, the heterogeneity of EM means that active management remains key and opportunities plentiful.
Fig 6: Scenario analysis: EM equities returns
Ashmore EM Equity has exposure to South Korean chemicals used in electric vehicles and semiconductors; Chinese renewable energy infrastructure; Brazilian software services; Taiwanese e-paper technology; Kazakhstan fintech; Mexican convenience store; and a Polish supermarket operator, among other high conviction investments.
1. MSCI ACWI incorporates the largest EM and developed markets (DM) freely investable markets.
2. TCFD stands for Task Force on Climate-related Financial Disclosures.