A central bank-heavy week, with the Bank of Japan (BoJ) potentially departing from its negative interest rate policy (NIRP) after eight years. In the United States (US), investors will likely carefully analyse the statement, dot-plot estimates and press conference answers from Federal Reserve (Fed) Chair Jerome Powell. Several other central banks have policy meetings this week. Last week, US inflation was higher than expected. Economic activity surprised to the upside in China, despite lukewarm credit numbers in February and depressed housing activity year-to-date. India announced the dates for its general election. Inflation surprised to the downside in Argentina and to the upside in Egypt.
Global Macro
A potential pivotal week for policy in Japan. The overnight interest swap (OIS) is implying a 50% chance of a 10bps hike by the BoJ tomorrow, down from nearly 80% on 7 March. A hike would bring the end of NIRP in Japan after eight years. The JPY has been closely following the yield differentials between Japan rates and the USD, as per Fig. 1:
Fig. 1: USDJPY vs. 10yr UST – JGBs
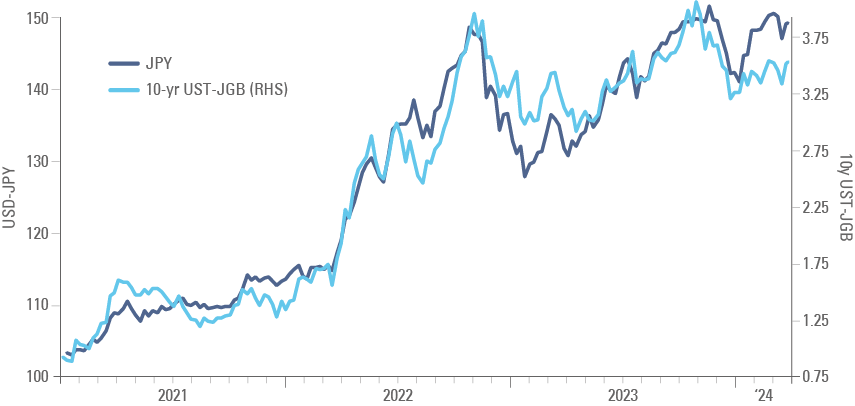
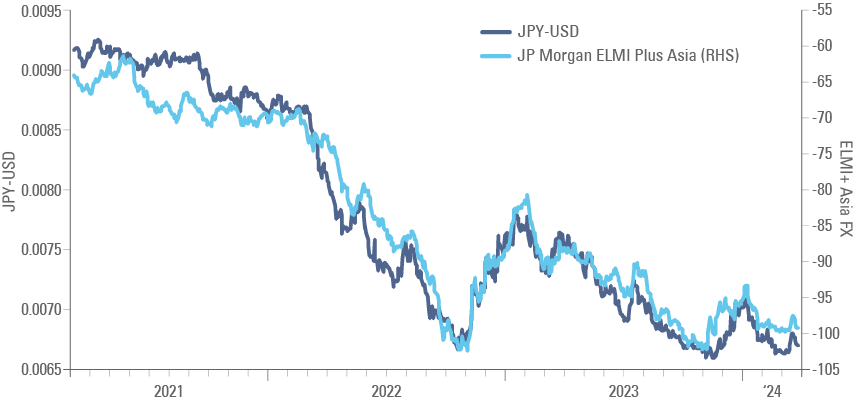
Thus, exiting negative interest rate policy while the Fed and the European Central Bank (ECB) discuss easing monetary policy in Q2-2024 could bring Japanese rates higher while rates decline in US and Europe, in our view. This could be a catalyst for the JPY to strengthen from its very weak levels, bringing relief to EM Asian currencies that have been put under pressure by the weaker JPY, as per Fig. 2:
Fig. 2: JPYUSD vs. EM Asia Currencies
The Fed meets on Wednesday. While no policy changes are expected, markets will monitor the dot-plot chart where each policymaker states their views for policy rates by year end. This morning, the median dots for 2024, 2025, 2026 and long-term are at 4.625%, 3.625%, 2.875%, and 2.5%, respectively. This implies three cuts during 2024, in line with the Overnight Index Swap (OIS) implied rate path. We believe there could be a possibility of some Fed members moving towards a more hawkish stance, as a few members moving their rate cut expectations can bring the dot-plot chart to imply only two cuts in 2024. The only large difference from the dot-plot to the OIS is for year-end 2026, where the OIS is at 3.375%, or 50bps above the dot-plot.
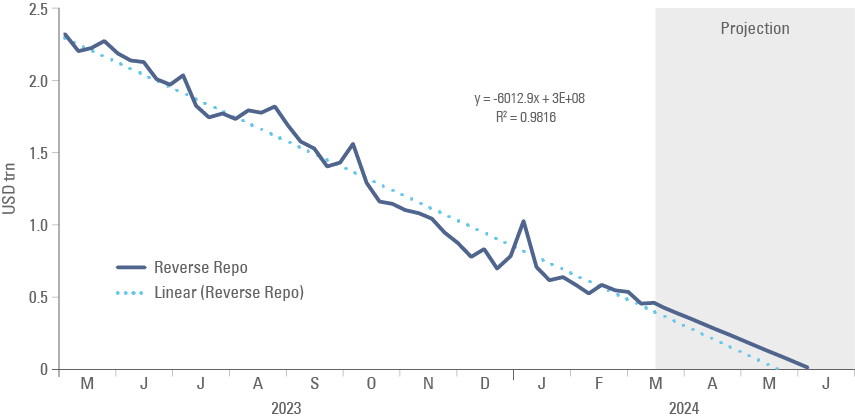
Market participants will also likely monitor Powell’s statement and answers to journalists’ questions. Deliberations about the evolution of quantitative tightening (QT) could be important too. Despite QT, liquidity as measured by the size of the balance sheet minus reserve repos and the US Treasury General Account (TGA) has increased by USD 358bn since last November. The Fed’s balance sheet has declined by USD 325bn to USD 7.5trn since 1 November 2023, and the TGA was down only USD 5bn to USD 748bn over the period, suggesting to us, liquidity should be tightening. However, banks deposits within the Fed via the reverse repo declined by USD 677bn to USD 414bn. A linear extrapolation of the pace of depletion since its peak suggests the reverse repo may be depleted by the end of May, as per Fig. 3. From there, liquidity could start contracting if QT remains in place (likely in our view) and TGA remains unchanged. Money continued to flow to money market funds, which now hold USD 6.1trn, almost the same amount of liquidity in the banking system combined with currency in circulation.
Fig. 3: Reverse Repo Facility
The Federal Open Market Committee (FOMC) meeting happens against a challenging background. Last week, inflation surprised to the upside in the US with core consumer price index (CPI) inflation at 0.4% mom and 3.8% yoy, but retail sales were weaker than expected. Oil prices rose 4.3% last week, trading around USD 86 per barrel and gasoline price futures are up 38.5% from the lowest level on 12 December 2023. Higher commodity prices and sticky service sector inflation can bring back the feeling that the economy is back to ‘stagflation’ after operating in goldilocks (higher than expected growth; inflation declining) for several quarters.
There appears to be much less uncertainty regarding policy in Emerging Markets (EM), in our opinion. On Wednesday, the People’s Bank of China (PBoC) will announce its one- and five-year Loan Prime Rate after an unexpected 25bps cut in February. On the same day, Bank Indonesia is likely to keep its policy rate unchanged at 6.0%, and the Brazilian Central Bank is expected to deliver another 50bps cut on the Selic rate to 10.75%. The Central Bank of Türkiye is expected to keep its policy rate unchanged at 45%, while most economists expect the Central Bank of Mexico to deliver its first 25bps cut to 11.0%. The central banks of Taiwan and Russia will also announce their policy rates, likely unchanged at 1.875% and 16.0%, respectively. In general, higher-than-expected inflation and lower policy rate cuts across Developed Markets (DM) may lead some central banks to slow down their pace of easing, but it is unlikely to de-rail the cycle, in our view. We believe a key reason for this is that DM central banks have been worried mostly about sticky service inflation related to housing and wages, while protectionist policies can interfere on tradeable goods. While some EM countries may also have to deal with sticky service prices, they are most likely to benefit from lower durable goods prices from China, in our view.
Emerging Markets
EM Asia
China: Aggregate financing had strong performance year-to-date (YTD), but were weaker than expected in February. Aggregate financing increased RMB 8.1trn YTD (RMB 6.5trn prior) but increased by RMB 1.56trn in February, below consensus at RMB 2.3trn. New loans increased by RMB 6.4trn YTD (RMB 4.9trn prior) but declined to RMB 1.45trn in February (1.55trn consensus). A large proportion of new loans came from non-bank institutions, leading some analysts to speculate that some of this may be related to Beijing’s purchase of equities via exchange-traded funds (ETFs).
Economic activity was, in general, better than expected, despite subdued credit. The data below is the combined numbers from January and February:
- Industrial Production +7.0% yoy (5.2% est; 4.6% Dec)
- Manufacturing +9.4% yoy (8.2% prior)
- Retail Sales +5.6% yoy (5.5% est; 7.4% Dec)
- Fixed Assets +4.2% yoy (+3.2% est; 3.0% Dec).
- Infrastructure: 9.9% yoy (8.2% Dec)
- Infrastructure ex-Utilities: 6.3% yoy (6.8% Dec)
The positive momentum in the overall economy contrasted with the still-poor performance from the property sector. House completions are improving after Beijing added support to finish building pre-sold houses, but housing starts, sales and prices remained very weak. The yoy numbers below compare with a very low base in 2023:
- Property sales -32.7% yoy in Jan/Feb despite low base. Sales were down by 40% yoy during the Chinese New Year holiday.
- In 2013, housing starts moved to a 16-year low, despite construction activity remaining at more elevated levels. This may explain the contrast between higher copper prices (copper demand is a function of completions) against iron ore prices plunging (steel demand a function of housing starts).
- Official property prices are now declining, but allegedly remain overestimated. There are several reports that brokers are not showing the real prices in houses for sales. The official data showed:
- New home prices -0.4% mom (-1.9% yoy) in February.
- Used home prices -0.6% mom (-5.2% yoy) in February.
India: The government announced the general election will take place from 19 April to 1 June, with the results announced on 4 June. Indian general elections are staggered across the states. The incumbent Bharatiya Janata Party (BJP) of Prime Minister Narendra Modi is largely expected to retain control of Congress. In economic news, industrial production rose 3.8% yoy in January, 30bps below consensus and below December at 4.2% yoy. CPI inflation was unchanged at 5.1% yoy in February, in line with consensus. Wholesale price inflation rose 0.2% in yoy terms in February, in line with consensus, from 0.3% yoy in January. The Reserve Bank of India (RBI) added liquidity via the overnight variable rate reverse repo last Thursday, bringing liquidity in the financial system to positive levels. The Securities and Exchange Board of India has been concerned about large flows into small- and mid-cap (SMC) stocks, submitting questions about the liquidity profile of daily dealing funds in the SMC market. Bloomberg reported ICICI Prudential Asset Management Co. said it will temporarily halt lump-sum deposits in SMC funds after a local asset management company added limits on small-cap fund flows, citing some cases of “valuation distortions” in the segment.1
Indonesia: Consumer confidence declined to 123.1 in February from 125 in January, and local auto sales rose to 70.7k in February from 69.6k in January. The trade surplus declined to USD 867m in February, below consensus at USD 2.3bn and January’s USD 2.0bn. Imports increased by 15.8% above estimate at 10.1%, rising more than the cyclical increase ahead of Ramadan. Exports declined 9.5% in yoy terms in February (consensus 6.4%) from 8.2% yoy in January, partially due to fewer business days.
Malaysia: Economic activity was much stronger than expected. Industrial production rose 4.3% yoy in January, above consensus at 2.0%, from 0% in December. Manufacturing sales increased to 3.2% yoy in January from -4.2% in December.
Philippines: The trade deficit was unchanged at USD 4.2bn in January, slightly better than the USD 4.7bn consensus. Exports rose 9.1% yoy (7.4% consensus; -0.5% yoy prior), and imports dropped 7.6% yoy (5.1% yoy consensus; -3.5% prior).
South Korea: The unemployment rate declined to 2.6% in February from 3.0% in January, also 40bps below consensus. Bank lending to households was unchanged at KRW 1,100trn.
Latin America
Argentina: CPI inflation slowed to 13.2% mom in February, 180bps lower than consensus, from 20.6% mom in January. Inflation rose to 276% in yoy terms, up from 254% in January, but better than consensus at 282%.
Brazil: Retail sales were much better than expected, rising 2.5% mom in January from -1.4% mom in December (consensus 0.2% mom) as the yoy rate rose to 4.1% from 0.1% over the same period. CPI inflation rose 0.8% mom, broadly in line with consensus, from 0.4% prior as the yoy rate was unchanged at 4.5%.
Mexico: Nominal wages rose by a yoy rate of 8.6% yoy in February from 8.0% yoy prior. The January number was revised down from 9.3%. Industrial production rose by 0.4% mom, or 2.9% yoy in January from 0.0% yoy in December, better than consensus at 2.2% yoy.
Central and Eastern Europe
Czechia: Inflation was lower than expected, while higher retail sales were higher. CPI inflation declined to 0.3% mom in February, 10bps below consensus, from 1.5% in January, as the yoy rate slowed by 30bps to 2.0%. Retail sales rose by a yoy rate of 2.4% yoy in January from 1.2% in December, above consensus at 0.5%.
Romania: Inflation was slightly higher than expected at 0.8% mom (7.2% yoy) in February from 1.1% mom (7.4% yoy) in January. Industrial production declined by 3.4% mom (-3.9% yoy) in February from +1.6% mom (+0.9% yoy) in January.
Middle East and Africa
Egypt: CPI inflation rose 11.4% mom, as the yoy rate rose to 35.7% in February from 1.6% mom and 29.8% yoy in January. Core CPI rose to 35.1% yoy in February from 29.0% in January. Higher inflation was most likely led by the overshoot in the parallel USD/EGP to 80. That means inflation may have peaked in February as the official rate depreciated from 30.8 to 50, before improving marginal to 47, forcing a convergence of the parallel rate down to the same (much stronger) level.
Saudi Arabia: The yoy rate of CPI inflation rose by 20bps 1.8% yoy in February. Industrial production declined by 8.8% yoy in January from -10.5% yoy in December.
South Africa: Manufacturing production rose by 2.6% in yoy terms in January, above 0.9% consensus and 1.3% in December. Mining production declined by a yoy rate of 3.3% yoy in January, below consensus at +0.4% and 0.2% prior.
Türkiye: The current account deficit widened to USD 2.6bn in January, slightly better than consensus at USD 2.9bn, but a larger deficit than the USD 2.1bn deficit in December. Industrial production rose by a yoy rate of 1.1% in January, slightly below consensus at 1.5% yoy and 2.3% prior. The unemployment rate rose by 20bps to +9.1% in January.
Developed Markets
Economic activity was weaker than expected in the US last week. The Citibank Economic Surprise Index declined to 24.6 from +44 on 9 February. In contrast, economic activity has been surprising to the upside for a while in Europe. The Citibank Economic Surprise index rose to 51.1 last week from -41 at in December 2023 and -150 in June 2023. Better economic activity in Europe – contrasting with lowering momentum in the US – is putting a ‘spanner in the works’ of investors positioned for a higher US dollar.
United States: CPI inflation came in above consensus for the second consecutive month, but not as bad as feared.
- Core CPI 0.4% mom and 3.8% yoy (3.7% est. and 3.9% prior)
- CPI 0.4% mom and 3.2% yoy (3.1% est. and prior)
- Producer price index (PPI) 1.6% yoy (1.2% est.; 1.0% prior)
Weaker retail sales, but mixed labour market data:
- Retail sales +0.6% mom (0.8% est.; -1.1% prior)
- Real average hourly earnings +1.1% yoy in February (1.3% prior)
- Initial jobless claims: 209k (218k est.) on 9 March
- Continuing claims 1.8m on 2 March (1.9m est.); unchanged (revised from 1.9m)
Japan: PPI inflation rose 0.2% mom in February, bringing the yoy rate up to 0.6% yoy, slightly above the 0.5% yoy consensus and 0.2% yoy in January. Real gross domestic product (GDP) growth rose by 0.1% qoq in Q4 2023 (revised from 0.3% qoq) from -0.1% in Q2 2023.
Europe: Industrial production was -3.2% mom and -6.7% yoy in January, a bigger drop than consensus at -1.8% mom (-3.0% yoy) down from +0.2% yoy in December.
1. See – https://blinks.bloomberg.com/news/stories/SABES0T0G1KW
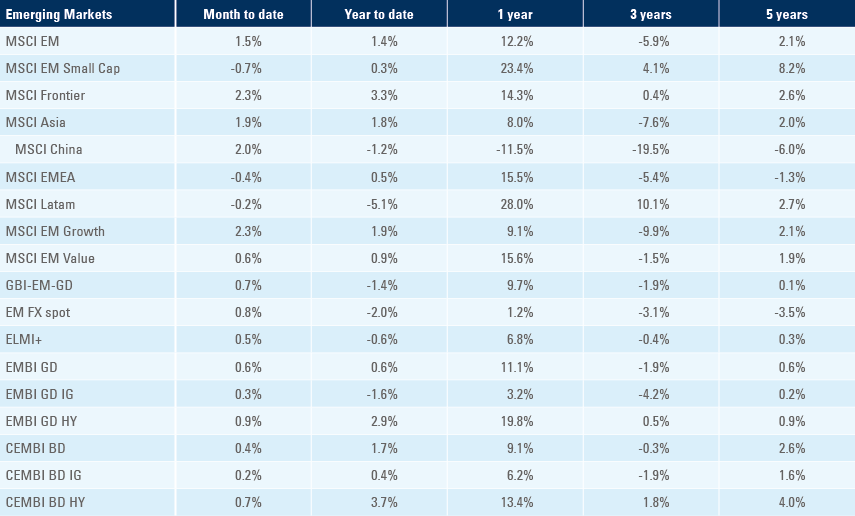
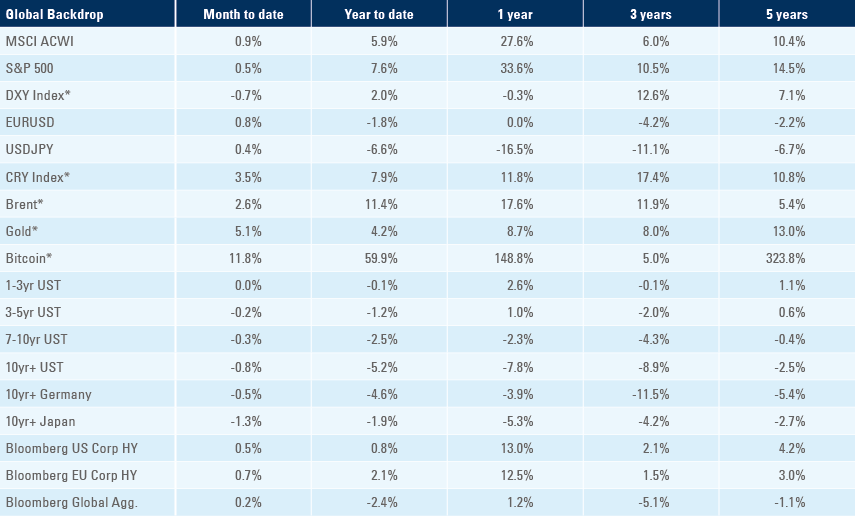
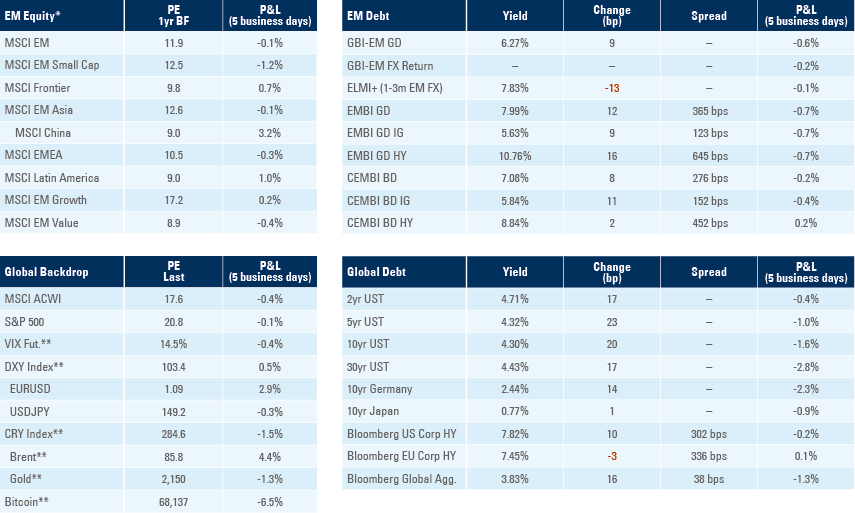
Benchmark performance