
Six risks of employing an ACWI manager to invest in Emerging Market equities
The growing importance of Emerging Markets (EM) has spawned a range of approaches for asset allocators to consider. One such is to rely on All Country World Index (ACWI) investment managers who will consider the EM opportunity in conjunction with Developed Markets (DM). However, such an approach is suboptimal, indeed a high-risk strategy, in our opinion.
EM comprise a diverse and global universe of countries experiencing significant structural changes and economic reforms. Although largely idiosyncratic in nature, they have several characteristics in common. For example, many are at an earlier stage of development than DM, their institutions are less mature, and they are often overlooked by investors. EM attributes often include attractive demographics, rising per capita income, low penetration of goods and services, and improving institutional frameworks.
- EMs contain 84% of the world’s population1
- EMs hold 72% of the world’s foreign exchange (FX) reserves2
- EMs have been a major driver of global growth over the past decade, contributing 66% of global GDP growth3
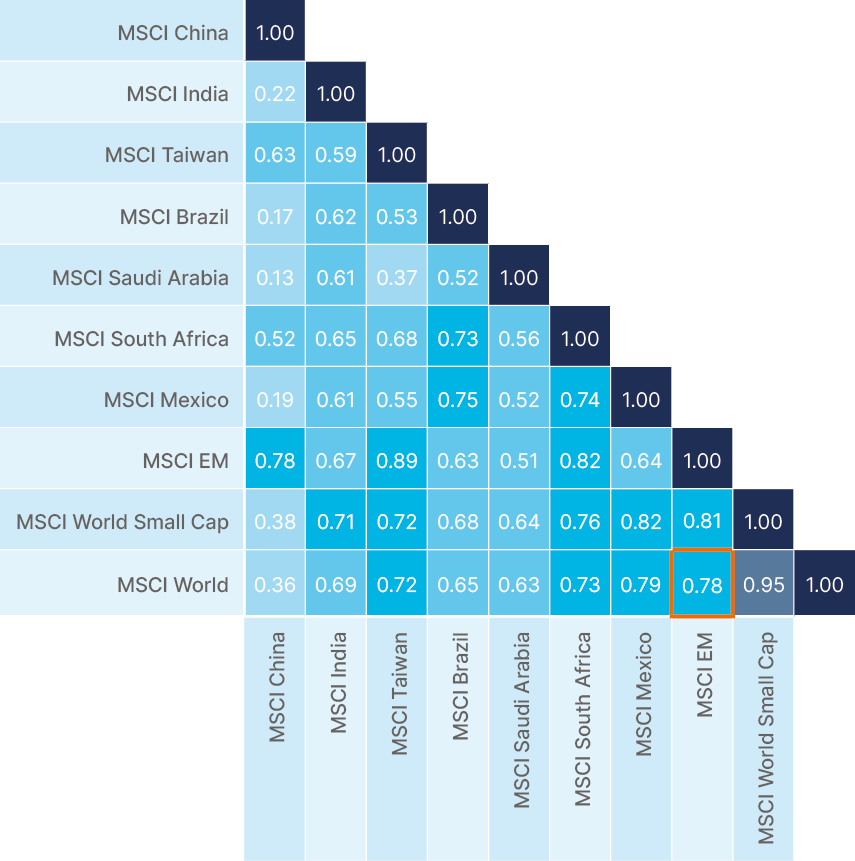
EM countries also display a high degree of heterogeneity. Each has its own balance of growth drivers, and each is at its own distinct stage of development. This results in low intra-correlations within EM, which can provide portfolio construction advantages and diversification benefits to global asset allocations.
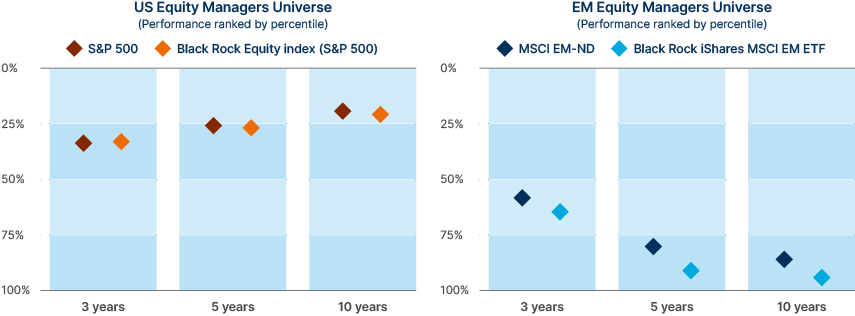
In short, the EM equity asset class is too big to ignore and specialist. EM’s bespoke characteristics also mean they are highly inefficient, and they offer strong alpha generation opportunities for those investors able to exploit the differences repeatedly (see Fig 1). Here, we see a dedicated EM manager at significant advantage to an ACWI manager.
Fig 1: EMs are highly inefficient and typically much more so than DMs
Risk 1
Structural under-allocation
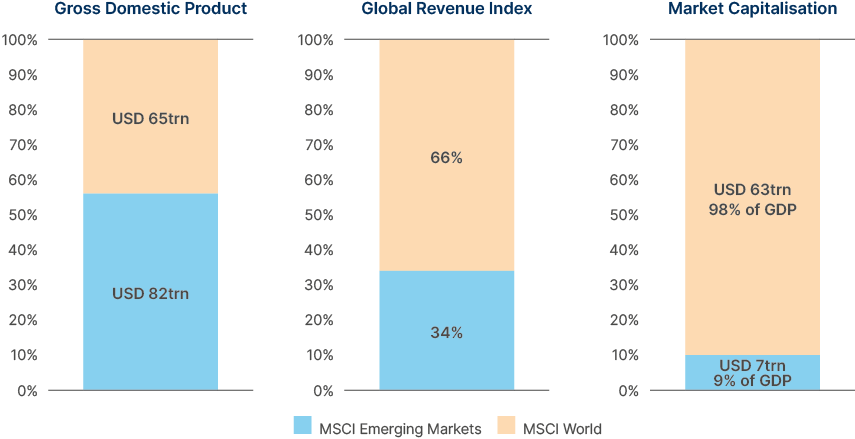
EMs currently generate over half of the world’s gross domestic product (GDP) on a purchasing power parity basis, yet their market capitalisation-to-GDP ratio is only 9%. This compares to 98% for DMs. As EMs ‘emerge’ through greater institutionalisation and capital market development, the closing of this ‘equitisation gap’ should reward investors. Consequently, considering the importance of EM equities through the lens of market capitalisation is ‘rearward looking’ and understates their significance.
ACWI managers risk exacerbating this ‘under-allocation’. EM equities represent only a modest ACWI benchmark weighting and hence EMs are not necessarily a focus of attention and resources. For context, the three largest ACWI stocks (Microsoft, Apple and Nvidia) comprise approximately the same weight as all 1,400 MSCI EM stocks combined. The institutional manager database eVestment points to ACWI managers as having a persistent underweight to EM, currently on average a half-weight on a market cap basis, or one-sixth weight on a revenue basis.4
Fig 2: GDP, Revenue and Capitalisation
Risk 2:
Biased exposure
On a conservative basis, EMs comprise over 3,000 stocks (large, smaller cap and Frontier Markets) in over 50 countries. Taken in combination with rapid EM capital market expansion, researching EMs is resource-intensive. For context, Ashmore currently employs 39 dedicated EM equity investors, approximately half of whom are based in EM countries, who are embedded in a broader investor pool of over 100 EM specialist investors (across equity, debt, currency and alternatives).
In the case of ACWI managers, time and resource constraints mean EM research coverage risks being systematically biased to the largest countries and largest capitalised stocks. EM companies listed as depositary receipts (DRs) tend to be popular with ACWI managers owing to their greater business familiarisation and absent the need for local custody for trading and settlement, given their US or UK listing.
However, such an approach has several implications. The EM investment opportunity is materially shrunk and technology-heavy, which risks duplicating similar investment drivers available in global equity allocations. Exposure is also biased to the most well-researched, and hence likely less inefficient, stocks. Moreover, DRs tend to trade at a premium valuation compared to their fully fungible local EM listing, and often with higher price volatility, perhaps given the greater importance of market sentiment as a price variable.
Fig 3: Comparing MSCI Emerging Markets and S&P Emerging Markets ADR indices

Risk 3:
Top-down complexity
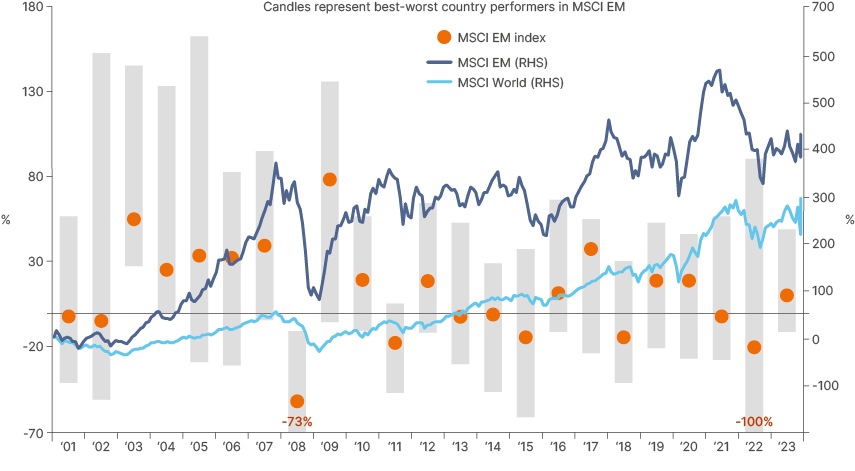
EM companies lead the world in a wide range of industries, yet they sit in transformative economies with often immature institutions. The outcome is a potential high stock return opportunity, yet also high market volatility. A great deal of EM’s price action and volatility can be attributable to top-down drivers, including currency fluctuations. This means a systematic and in depth understanding of top-down factors has disproportionate importance in EM investing. At certain points in the cycle, top-down factors can overwhelm the very best-intentioned stock thesis and earnings forecasts. One can refer to the grey candles in Fig 4, which illustrate the significant dispersion between best-to-worst country performance each calendar year, for example.
Some of the most valuable top-down insights are those generated on a rolling basis. This enables one to build a trajectory for an economic cycle, its rate of change, and likely inflection points. It trumps a point-in-time assessment, given this can be subject to revision. Similarly, forward-looking data assessment can be often the most insightful. For example, an assessment of policy stance, the business cycle, and market factors can all help inform the direction of macroeconomic and earnings data and help build conviction. Informed managers can reduce or avoid exposure ahead of currency weakness and can incorporate FX sensitivities into the investment thesis for stocks. The risk is that an ACWI manager with an approach primarily attuned to managing in DMs, where top-down differentiation is much less material, may lack the capability to assess and mitigate such risks compared to a dedicated EM manager.
Fig 4: Top-down dispersion
Risk 4:
Diluted diversification benefits
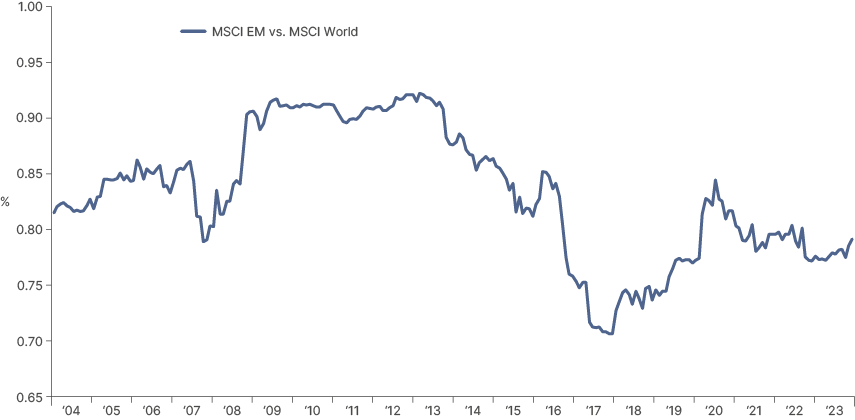
The top-down-led heterogeneity of EM results in low intra-correlations between countries, which provides advantages for portfolio construction, and low inter-correlations between EM and DM, which provides diversification benefits to global asset allocations. These benefits could be at risk of being diluted by ACWI managers who may treat EM exposures more tactically than a dedicated EM investor, and hence ‘helicopter in and out’ of a small number of EM stocks subject to their global outlook.
Fig 5: EM low (intra- and inter-) market correlations
Risk 5:
Investing with impact
The total value created by a company is the profit delivered to shareholders as well as the benefits delivered to customers, suppliers and employees. Increasingly, it is acknowledged that total value includes the benefits delivered to wider society and the environment. Companies that deliver value to all stakeholders have more sustainable returns over the long term, with significantly lower operating risk. Unfair distribution of value among stakeholders is ultimately unsustainable.
(Non)financial risks can be more pronounced in EMs due to sometimes weaker regulatory oversight, lower disclosure requirements and a more dynamic policy environment. Overall, EM companies, especially smaller companies, are relatively new to the demands of global institutional investors, yet this provides an opportunity for active managers ‘to invest with impact’. Through ongoing dialogue and guidance, managers can improve companies’ ‘investability’, improving stock liquidity as well as increasing earnings multiples. This can take many forms and could include improving governance oversight, formalising a dividend policy, enhancing staff retention through an improved compensation structure, or reducing the risk of environmental fines, for example.
All else equal, ACWI managers’ capacity to ‘invest with impact’ may be diluted by the more tactical nature of their allocation, and by investments concentrated in the larger EM companies where market scrutiny is already well entrenched.
Risk 6:
Alternative approaches
An alternative approach to relying on ACWI managers is to gain exposure to EM through direct investment in DM stocks. After all, as per Fig 2 above, around one-third of global revenues come from EM exposures, so certain DM stocks can have meaningful EM exposure. The risk here is that investors are likely to pay a much higher valuation, and for diluted exposure, to EM-centric themes. Further, a meaningful driver of the volatility of these stocks may originate from their business in EM, which an ACWI manager may be less able to mitigate through portfolio construction.
CASE STUDY 1
South Korean vs. Swiss health services
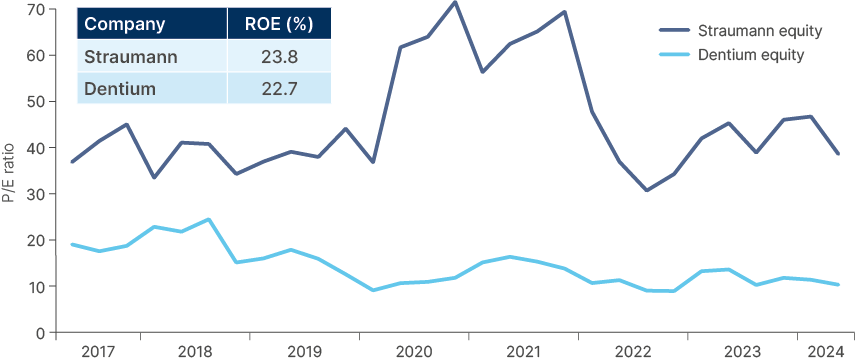
Both Dentium in South Korea and Straumann Group in Switzerland are experts in dental implants. For Dentium, 100% of revenues are from EM countries (primarily South Korea and China). For Straumann, approximately 30% of revenues are from Asia and Latin America, although these regions represent the company’s fastest revenue growth.
While both companies are underpinned by high-quality operations and deliver sustainably strong returns on equity (ROEs), which are typically in the 20% range, the valuation multiple is three times higher for Straumann (37x) than for Dentium (11x).
Moreover, Ashmore is well placed as a meaningful shareholder to help guide Dentium to institutionalise its dividend policy, which can attract more investors and see the earnings multiple expand (See Risk 5 – Investing with impact).
Fig 6: 12 months forward price-to-earnings ratio
CASE STUDY 2
China vs. European
It is a similar picture when comparing leading Chinese sportswear company Anta, whose revenues are dominated by its domestic market, to German sports company Adidas, which generates around 25% of its sales from the Asia-Pacific region.
Anta generates twice the ROE (in the mid-20s) and trades at half the valuation (price-to-book and price-to-earnings) compared to Adidas (May 2024).
Conclusion
EM equity is a unique asset class that requires a comprehensive and systematic investment approach to repeatedly exploit its price inefficiencies, whilst mitigating the challenges. To do so successfully requires significant resources, deep experience, and bespoke global infrastructure, in our opinion. Consequently, relying on an ACWI manager looks to be a suboptimal solution.
1. See – See – https://www.imf.org/external/pubs/ft/fandd/2021/06/the-future-of-emerging-markets-duttagupta-and-pazarbasioglu.htm
2. See – Ibid
3. See – https://www.worldeconomics.com/Regions/Emerging-Markets/
4. See – eVestment. 31 March 2023.