
Asset allocation considerations for new macro and geopolitical regimes
This piece highlights the long-term paradigms shifts that are having an impact on global asset allocation, namely higher geopolitical risks, higher macroeconomic (inflation) volatility and energy transition. While these paradigm shifts themselves are well-known and have been discussed for years, most investors seem to have paid little attention to the implications for asset allocation.
Investors’ portfolios remain extremely exposed, both geographically and to sectors and companies that were the main winners from the 1980-2020 ‘goldilocks’ era. Our main recommendation is for investors to diversify their asset allocation. The returns over the first three years of the current decade highlights how the 60/40 framework (or leveraged risk parity) was very appropriate for the 1980-2020 era, but very inadequate for the new era. In our view, investors should increase their cash exposure and increase their allocation to commodities and real assets.
In geographical terms, a much broader country diversification – with a large overweight to neutral countries to global conflicts – is more appropriate. Several Emerging Market (EM) and Frontier Market (FM) countries are well positioned, both in terms of low valuations and their neutral position to large geopolitical events. In contrast, most investors have the bulk of their portfolios concentrated in the main economic and military hegemon, which currently faces intense internal and external pressures. History shows the assets of the challenged hegemon stand to lose the most depending on the scenario.
1) A new macro regime: Asset allocation implications
The most important recommendation for investors in the new Macro and Geopolitical Regimes is simple, diversification. When times are uncertain, reducing exposure across portfolios and increasing allocation to assets with lower volatility and higher certainty of returns are the simple frameworks to follow. We can break down diversification in two elements:
- Asset class:
- Exit 60/40;
- Enter 5x20: equities; bonds; cash; real assets; and commodities.1
- Geographical:
- Buy neutral countries
- Buy winners and sell losers
In theory, investors are in full control of their strategic asset allocation. In practice, old habits die hard due to investor conservatism. Any CIO that exited 60/40 in favour of 5x20 a few years too early risked their career, but almost no CIO would have lost their job for losing close 23% of the value in their fixed income portfolio and making only 4.4% returns in their equity portfolio in a bit less than three years, from 31 December 2020 to 30 October 2023.2 Over the same period, US Consumer Price Index (CPI) rose by close to 17% and a portfolio of commodity futures rose over 40%. This sticky positioning explains some of the distortions in today’s market prices and why we believe it is not too late for investors to reposition their portfolios.
Asset allocation: From 60/40 to 5x20
Elevated debt levels across the Developed World is another reason to consider diversification. Historically high debt levels have been resolved with restructuring, inflation, or fiscal adjustments. Two out of the three alternatives bring the risk of severe currency depreciation. Portfolio diversification from a geographic perspective would allow investors to lower currency risks. Countries with elevated real rates and sound fiscal policies, such as Indonesia and Mexico, should be favoured.3 Below we consider the merits of the five asset classes considered in a 5x20% allocation.
ASSET CLASS 1: Cash
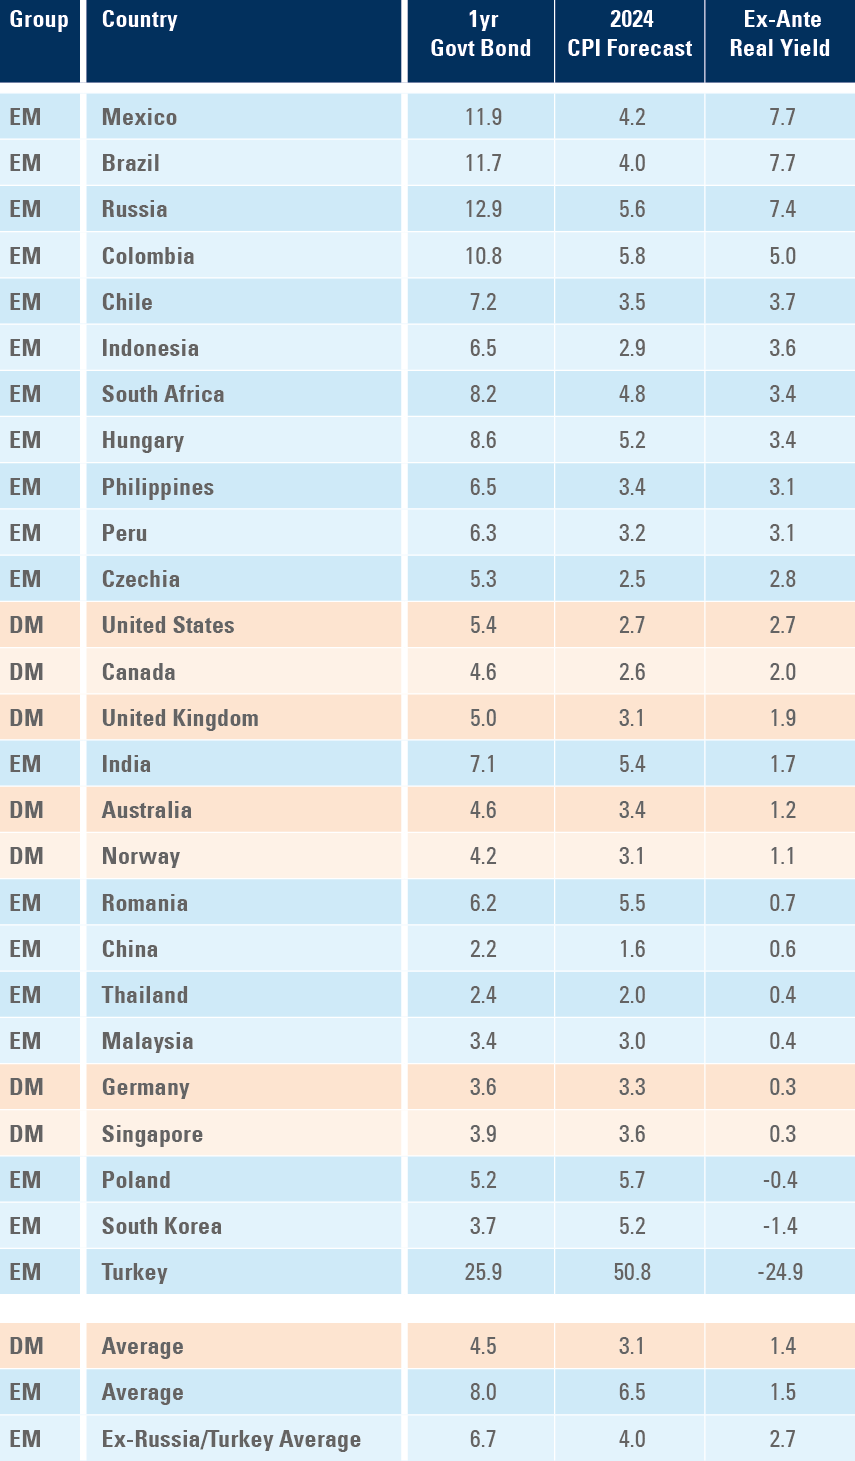
The bar is higher for investors to have too much equity exposure when cash offers a large real interest rate. When thinking about cash, not all roads should lead to the Dollar. Fig. 1 has one year government bonds minus CPI inflation – a good enough proxy for cash – across the largest countries in the world. It is clear that EM local currency short term bonds offer higher real yields than Developed Markets (DM,) despite lower levels of debt.
Cash offers a large real interest rate and a good risk-adjusted return profile
Fig 1: 1-Year government bonds vs CPI inflation
ASSET CLASS 2: Commodities
Commodities are a fascinating asset class. During ‘normal’ economic cycles, commodities have a positive correlation with equities, rising the most in early expansions, but also rising in real terms in late expansions. Commodity prices typically decline in economic downturns and massively underperform in a recession.
Investments in commodities should yield good returns due to tight supply of resources
However, commodities (particularly energy and precious metals) offer higher returns and lower correlation to equities when resources become tight. Policies to reduce inequality, including more power to unions tends to increase demand for commodities. Wars typically lead to a large increase in demand for commodities and can be compounded if the wars are fought in countries with abundant resources and/or if global logistics gets impaired because of conflicts.
Importantly for investors, when commodities are scarce, the spot prices trade at more elevated levels than future prices. The resulting curve shape is called backwardation. Commodity companies tends to trade based on their future valuations, but they earn cash on the spot markets. They can capture this curve ‘arbitrage’. Investors buying commodities via futures can take advantage of the backwardation too, if the difference between the future price and spot is above the yield paid on cash (c. 5.3%). From 31 December 2020 to 30 October 2023, the Bloomberg Commodity Index rose by 43%, while the spot price of the same commodities increased by less than 30%, the difference explained by the backwardation yield. Commodities can also act as a hedge to natural events such as El Niño and are move valuable when supply is tight vs. demand.
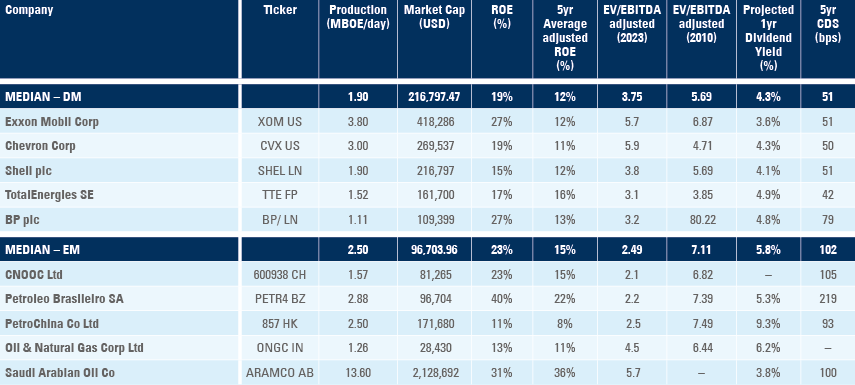
Several EM countries and companies that stand to benefits from higher commodity prices trade at lower valuation levels
As such, total returns to commodity investors tend to be much higher in environments of tight resources, and sticky inflation is frequently associated with periods of tight resources. Therefore, in our view, commodities offer a good diversification to portfolios in the current environment. Several EM counties and companies also benefit from higher commodity prices. And most these assets still trade at a discount relative to their DM peers as shown on Fig. 2.
Fig. 2: Key valuation metrics across EM and DM oil majors
ASSET CLASS 3 & 4: Equities and Real Assets
Any EM and Frontier Markets (FM) investor will be familiar with the pattern of stock prices, in local currency terms, ‘going vertical’ when the country loses control of inflation and its currency. Real estate and other real assets prices also rise under these circumstances.
Inflationary shocks support equities and real assets...
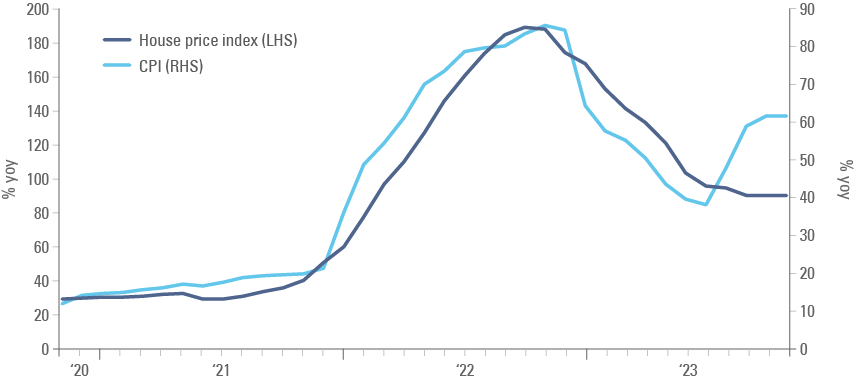
What drives the rally are investors liquidating their cash and buy assets that will hold value over time. Well-run companies selling products with low demand elasticity will be able to increase prices in line with inflation and keep profitability. Companies also have real asset such as land, real estate, and other fixed assets that outperform cash during currency debasement events. This process is illustrated by Figs 3 and 4 on the Argentinian stock market and Turkish house prices over their latest crisis.
Fig. 3: Argentinian stocks in USD and ARS
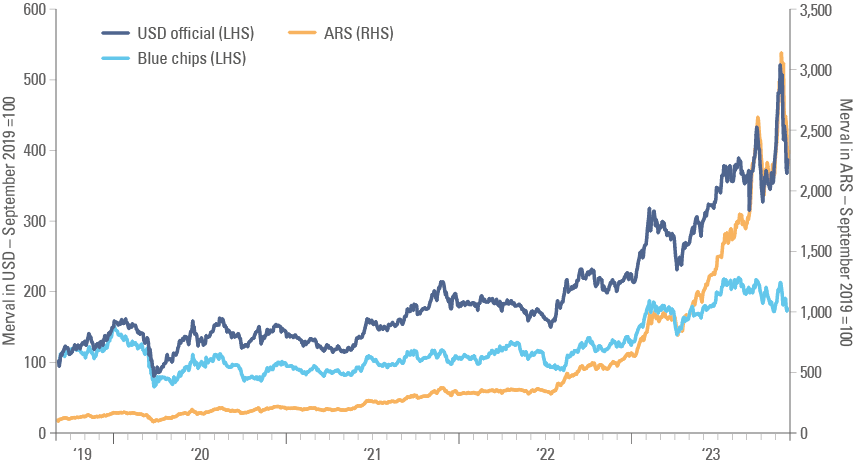
Fig. 4: Turkish house prices vs. CPI inflation
...however, expensive equities and real assets should be avoided
Therefore, real assets can and should be part of one’s allocation during times of heightened inflation volatility. But there is a wrinkle. Most real assets have long duration cash flows. Their valuation is, therefore, affected by long-term interest rates. And higher interest rates for an extended period tends to lower the valuation multiples of long duration assets. This process is not linear and depends on the leverage in the system. Highly levered sectors facing disorderly deleveraging may see large price drops in nominal terms. Unlevered sectors will experience nominal price appreciation below inflation, leading to a long-term decline in value in real terms, even if not in nominal terms.
Undervalued equities and real assets offer the best protection against inflation
Thus, equities and real assets do protect investors against sharp increases in inflation, but the valuation matters. Expensive equities and real assets may lead to overall nominal or real losses in investors’ portfolios. This suggests that investors should look for real assets such as infrastructure and real estate ‘off the beaten track’ such as EM. In our view EM countries offers a larger opportunity set of good assets at attractive valuations.
In the equity space the S&P500 traded at 30.7x earnings, on a price to ten-year average earnings basis, on 30 October. This not only gives the asset class earnings yields close to flat, but also suggests very low future returns. In comparison, EM stocks trade at ‘under-demanding’ 17.0x earnings.
ASSET CLASS 5: Bonds
Despite its massive underperformance over the last three years, bonds should have a place in investors’ portfolios. A well-known adage states that countries will break everything on their way but will refinance its debt. During wars, it is normal for countries to engage in financial repression, or central bank to engage in yield curve control, capping interest rates on long-term bonds.
Yields on US Treasuries are attractive after three years of sell-off...
After three years of negative returns, we think US Treasury yields are attractive for a very simple reason: the US government may have to spend as much as 5% of its Gross Domestic Product (GDP) on interest payments in 2025, if interest rates remain at this level. To afford it, the US would have to increase taxes or cut discretionary spending significantly. That is before incorporating the eventual cost of any significant escalation in the current conflicts in Ukraine and Gaza, or any other conflict.
Therefore, it is almost unthinkable that yields will rise again by 450 basis points (bps), even a quarter of it is hard to imagine. If yields do rise by that much, it’s because inflationary pressures from currency debasement are taking place, and the rest of the well-diversified 5x20 portfolio should be doing its job.
...but Treasury technicals are terrible. EM IC bonds offer better fundamentals, yields, and technicals
On the other hand, with real yields at 2.3% to 2.5% across the curve, bonds offer significant value in case a classic deflationary recession hits the world, entirely possible at the current stage of the cycle. The problem with bonds is that its largest asset class, US Treasuries, have very bad technicals. There are USD 3.7trn of US Treasury securities principal and interest repayments within the next 14 months. The fiscal deficit added to USD 1.7trn year-to-date. Even if the fiscal deficit is consolidated, there is close to USD 5trn of US Treasury issuance until the end of 2024. We prefer bond markets that offers higher yields, better repayment fundamentals and better technicals. EM corporate investment grade bonds, for example offers 6.8% yields for bonds that mostly trade below par and less than 5-years of duration exposures. In terms of technicals, EM Corporate IG issued only USD 155bn in until the end of September and the fundamentals are solid.
Weighting
Of course, a 5x20 approach is simplistic. However, if one is uncertain about the returns across assets (or asset classes) the equal-weighing approach is a good starting point. Nevertheless, investors may want to adjust their weighting to an optimal structure.
Investors should focus on identifying and allocating capital to ‘neutral’ countries...
Geographical diversification
The first rule in terms of geographical diversification during times of conflict is to buy neutral countries. The trouble is that neutral countries status is not set in stone and change according political and geopolitical dynamics. For example, the entire Latin American continent is likely to remain neutral to regional and global countries. Latin American countries are, after all, very far from the main geopolitical fault lines. Most African countries are also likely to remain away from most conflicts. India, Kazakhstan, Indonesia, and Malaysia will also try their best to remain neutral. Examples of neutral countries that are in a more complicated situation currently are Saudi Arabia and the United Arab Emirates.
...as it is far harder to define and identify winners of wars
It is far easier to identify neutral countries than winners and losers of wars. Will Ukraine emerge victorious? What constitutes victory for Ukraine? What will be the cost for Ukraine and the West? Will Israel or Palestine emerge victorious? Again, how can we define victory and at what cost?
How to think about asset allocation in a second Cold War II framework?
Cold War II & flawed assumptions: US/DM is safe, EM is dangerous
A good framework for the current era would be to make the parallel with Cold War I. Instead of Russia, it is China who is the superpower challenging the existing hegemon. Like Russia, China doesn’t have a democratic system. Unlike Russia, however, China has embraced capitalism. China’s rapid economic growth, millenary cohesive society, population size and current level of development makes it a far more challenging opponent than Russia. The question is, who will emerge as the winner of the Second Cold War?
Logic, alongside an appreciation for democracy would suggest the US should have the upper hand in a second Cold War. But what are the odds? 55%-45%? 65%-35? Maybe 75%-25%? A sophisticated artificial intelligence model backed by game theory may offer an answer, which will be as good as any odds assigned by pundits. Would you bet a large share of your savings, with 95%-5% odds, that the US will emerge as the undisputed and unscathed winner?
That is the bet one takes when allocating to global stocks passively. US stocks today represent c. 62% of an MSCI All Country World Index (ACWI) while China only represents 3% of it.4 Worse still, a large amount of such a passive portfolio would be concentrated in stocks with large exposure to China (Apple, Tesla, and Nvdia, for example). Even if the US emerges as a winner, it is quite possible that these companies position in China will suffer. On the other hand, there are scenarios where China emerges as victorious, becoming the most important player in economic and military terms in the South China Sea. This may provide a boost to Chinese economic position and asset prices, at least in relative terms to the existing hegemon. Investing in China maybe politically challenging, but a fiduciary not bound by political pressures and considerations may want to consider a much better diversification than provided by indices today.
Diversification, and focus on neutral countries
Moreover, the total EM exposure is less than 10% of the MSCI ACWI today. This means that EM ex-China is less than 7% of global passive portfolios. And EM ex-China is mostly comprised of neutral countries (i.e.: India, Indonesia, Brazil) that should constitute a much larger proportion of investors’ portfolios, in our view. Thus, the answer to the geopolitical threats is to have more, not less exposure to EM. Importantly, global investors have zero exposure to Frontier Markets, which offer diverse growth vectors (Vietnam, Africa, Middle East) and the lowest correlation to traditional markets.
The next sections discuss the key fundamental reasons for a new asset allocation framework, namely: geopolitical risks, higher inflation volatility and energy transition.
2) Higher geopolitical risks: The end of Pax Americana and the peace dividend
Several readers may disagree with a few of the points below. Please bear in mind that our intention is not to take a political stand, but to establish observable facts from an independent observer perspective. Most of the democratic world remains inspired by what America represents (democracy, individual freedoms, meritocracy, etc). The US has a very long list of extraordinary institutional qualities, including the division of power between executive, legislative and judiciary, the strength of its rule of laws, top universities driving technological advancements, etc. The problem is that more non-Americans do not feel (at least directly) the benefits of the US qualities, while they do directly feel the impact of some of the problems listed below:
No ‘just’ war since Desert Storm in 1990
The tragic terrorist attacks of 11 September 2001 unleashed an era of US revanchism that led to a series of mistakes (acknowledged by Joe Biden on his visit to Israel). For example, the invasion of Iraq and the military interventions in Afghanistan were disastrous for local populations and destabilising for their respective regions.
Was the recent NATO expansion crucial?
NATO expansion failed to bring stability to the Western Geopolitical Faultine
There is no logical, political, or legal justification for Russia’s invasion of Ukraine. At the same time, it is not hard to argue that, at least so far, the expansion of the North Atlantic Treaty Organisation (NATO) has brought problems to several countries in the region, starting with Georgia and Ukraine. The entire border with Russia, from the Baltics to the Balkans is in high alert. The close proximity between Russia and Iran as well as Russia rising influence in the Middle East increased the risks across the Western Geopolitical Faultline.5 Several would argue that the world may have faced this situation even without NATO expansion maybe so, but it is not clear that NATO brought more security to the region.
Is the Global South represented in the United Nations?
The only factor connecting the BRICS (Brazil, Russia, India, China, and South Africa) and its new members (Ethiopia, Argentina, Saudi Arabia, United Arab Emirates, Egypt, and Iran) is a sense that the post-WW2 set of institutions under the United Nations (UN) umbrella is not working for the Global South. The Dollar fluctuation and US monetary policy leads to booms/busts liquidity shocks in EM and FM economies that are neither desirable nor easy to deal with. To make things worse, the weaponisation of the Dollar has brought more uncertainty to the system.
The UN system needs reform
The UN’s largest financial institutions needs reforms. For more than a decade these institutions have largely failed to represent the current political-economic state of the world. This is something most International Monetary Fund (IMF) senior executives recognise and have actively worked towards improving, alas, with limited success.
Initiatives such as the BRICS expansion and the China’s Belt and Road (B&R) may be seen as an attempt of bypassing these institutions. B&R loans, however, have complicated the debt situation for FM economies that saw China as a more important ally but did not have proper procurement rules in place when bringing infrastructure projects backed by Chinese state-owned banks and insurance companies.
Dysfunctional politics and social media
Politics has always been an ‘ugly game’. But the election of Donald Trump in the US and Brexit in Britain highlighted how well-intended systems can distort a democracy. The role of social media at empowering the share of the population that have negatively been impacted by globalisation, and thus susceptible to extreme narratives, remains in place and maybe further complicated by artificial intelligence and deep fakes. Social media and political lobbying structures can result in a dysfunctional political environment, increasing the odds of poor decisions. The recent removal of the Speaker of the House of Representatives at a time of intense international uncertainty, coupled with the inability to find suitable alternatives to Biden and Trump for 2024 are emblematic of the dysfunctional political landscape in Washington DC.
The global political landscape is increasingly dysfunctional
America First > Trade War > Tech War > Supply Chains
From a foreign policy perspective, Trump probably had the right instincts when it came to dealing with international foes. Bringing (some) of your enemies (Russia, North Korea) closer to you to avoid a fight may have helped to avoid conflicts, in our view. Trump’s decrying of Europe’s dependency on Russian energy as a strategic mistake was prescient. In the Middle East, the Abraham Accords were a landmark foreign policy achievement that was obfuscated by the controversial transfer of the US embassy to Jerusalem.
Trump’s foreign policy: A mixed record
However, Trump mixing foreign policy with local politics created much confusion.
- The infamous wall in the Mexican border exacerbated the immigration crisis.
- The misguided trade war with China achieved nothing of strategic importance. Instead, it increased anti-Chinese sentiment in America and anti-US sentiment in China.
- The aggressive pushing around of Europe alienated a key ally and reduced the cohesiveness of the West and NATO.
Supply chain rebalancing is not easy. EM ex-China tends to benefit the most.
The trade, tech wars and the pandemic forced companies to rethink their supply chains. Having too much concentration on both components and manufacturing from one country (China) has proven undesirable. The trouble is that moving production away from China will be very costly and will take much longer and cost much more than most investors and companies are willing to admit. The reality is that no other country is likely to achieve the scale of production China has today. Thus, not only there will be a large amount of capital invested in building these redundancies, but the productivity rate of these investments will quite possibly be much lower. Any strategy of diversifying production away from China will have to focus on increase production in countries with large populations. Mexico, Brazil, Colombia, Poland, Hungary, Morocco, South Africa, India, Indonesia, and Vietnam are likely beneficiaries.
Pro-cyclical fiscal expansion and the USD cycle
The most remarkable impact Donald Trump had on the economy was the approval of the Tax Cut and Jobs Act in November 2017 (effective January 2018). The tax cut, alongside the cumulative gains from globalisation and technological developments, led to an extraordinary cycle of return on equity for several US companies. Global investors relocating capital from the rest of the world to US stocks became a critical factor for US stocks multiple expansion. The large inflows to the capital account also explains, in our view, the Dollar strength, despite the current account deficits.
Unsustainable pro-cyclical fiscal expansions created massive distortions...
Fiscal and monetary policy decisions
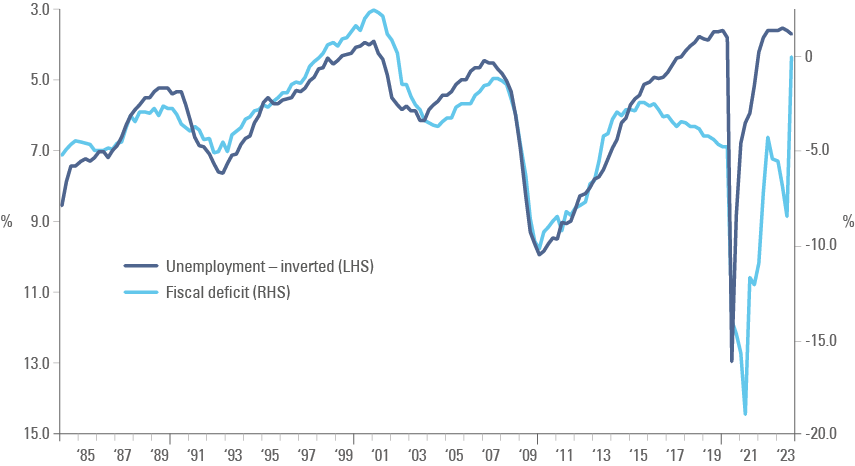
When Biden was elected President, the Democrats doubled down on pro-cyclical fiscal policy expansions (Fig. 5), which created massive distortions in the global economy, including inflation, higher interest rates, strong USD, tight liquidity in offshore dollar system (Eurodollar), and large US indebtedness. It also boosted the extraordinary return on equity (ROE) environment for US capital markets, explaining today’s distortion on market cap weighted benchmarks such as MSCI ACWI.
...and led to extraordinary returns for US stocks
Figure 5: US unemployment rate (inverted) vs. fiscal deficits
Dollar hegemony
It will be very hard to displace the Dollar as a reserve currency. Nevertheless, foreign exchange (FX) reserve managers will accelerate the diversification to other currencies and assets. The seizing of Iraqi, Afghanistan, and Russian FX reserves delivered a blow to one of the few instruments that EM and FM countries had to deal with liquidity crises under the current system. Regardless of losing its hegemony, the Dollar is likely entering a weakening cycle as we have discussed in previous publications.6
BRICS eureka = Old relic + Digital innovation
It is possible for BRICS to come up with a settlement system to bypass the Dollar. Bringing together traditional and new technologies could have a powerful effect. A digital RMB backed by gold would be an alternative to the settlement of trade within the Global South. Such a digital currency would also be attractive to reserve managers. Furthermore, the questions around rule of law and inconvertibility would be addressed by the gold convertibility. This does not mean that China would have to fully adopt a gold standard. Instead, it would just need to hold enough gold to clear the external imbalances from its trade with the Global South. Whilst China would presumably prefer to keep the entirety of the gold reserves within its own borders, part of the gold custody could be held in neutral offshore centres such as in Singapore, Dubai, and Uruguay, enabling the conversion of e-RMB to gold without sole dependence on Chinese shipments of gold.
A digital RMB backed by gold could be an alternative for trade settlement within the Global South
3) Higher inflation volatility
In a recent Bloomberg interview, the former Chief of the New York Federal Reserve William C. Dudley framed inflation well: “Inflation is a result of tightness on resources plus inflation expectations”. This suggests central banks are not in full control of inflation as Dudley himself added: “If you get rid of the first piece and say inflation depends on inflation expectations, well then you really don’t have a coherent model of inflation”.
Inflation is as a result of resources availability and inflation expectations
Central banks have written a myriad of papers about the wonders achieved by inflation targeting regimes since New Zealand implemented theirs in 1990 and most others followed suit. However, the question now is: have we moved from an era where resources are plentiful to one where resources are scarce? The changes described in Fig. 6 suggest that resources are about to get much scarcer.
Figure 6: Was the 1985-2020 goldilocks era an exception?
The inflation – Geopolitics nexus
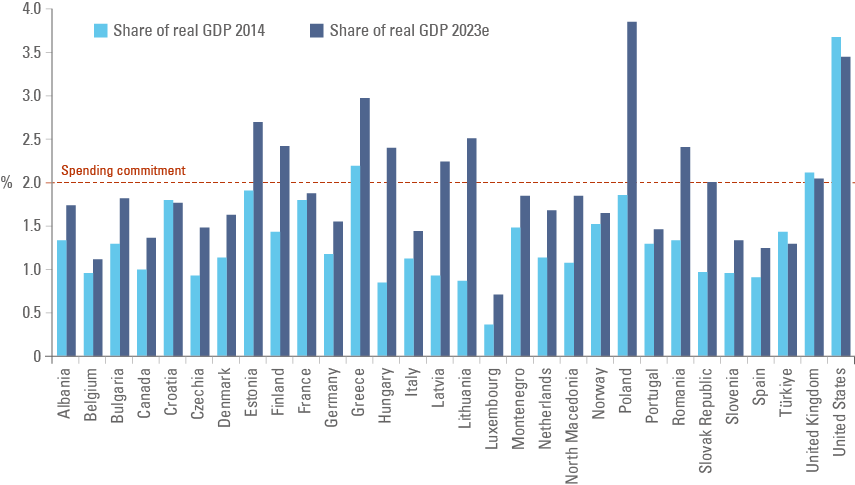
As previously mentioned, higher geopolitical uncertainties tend to lead to a significant increase in defence spending. The cost of deterrence can be estimated by looking at NATO defence spending. NATO countries spends between 1-4% of their GDP, with the US spending close to 3.5% of GDP. Other NATO countries have been increasing their defence spending and now contribute 1.7% of their GDP on average, as per Fig. 7.
Deterrence is expensive...
Fig. 7: NATO countries defence spending vs. 2% commitment
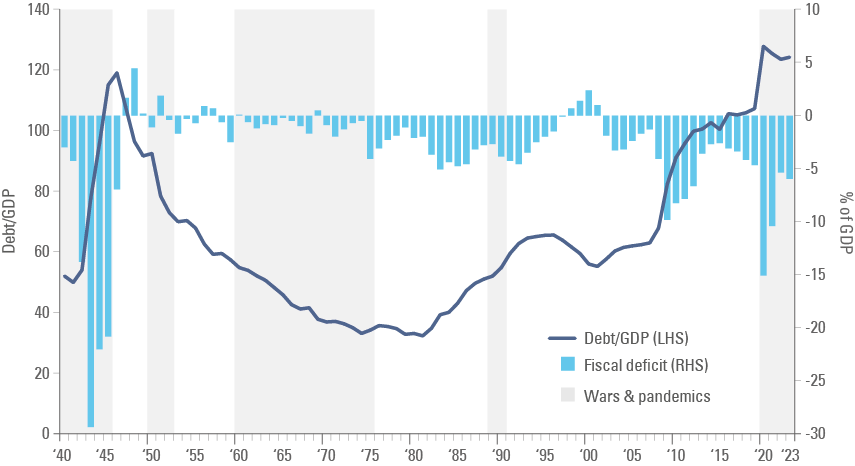
However, deterrence costs pale in comparison with the costs of wars. The US total spending increased from 10% of GDP in 1940 to 43% of 1943 after it entered the WW2 in December 1941. The total outlays from 1942 to 1945 added to 150% of GDP (37.5% p.a.), compared to 9.6% in 1940 and 13% from 1947 to 1949 (before the Korean War). The result was fiscal deficits between 14% and 30% of GDP from 1942 to 1945, an average deficit of 22% of GDP. This led to a massive accumulation of debt (as per Fig. 8), mostly monetised (purchased by the Federal Reserve). In the case of WW2, despite its massive cost, the US also massively benefited from suffering very little infrastructure. The US also suffered much lower casualties as percentage of its population than France, Britain, Germany, and Russia. This allowed the US to emerge as the undisputed hegemon post WW2.
...but wars drive extraordinary fiscal deficits and debt accumulation
A troubling question arises when thinking about the cost of war in the context of today’s debt levels: Can the US afford to guarantee global security today? The US will most likely increase spending to secure its hegemonic position, but can it do so without monetising its deficits?
Fig. 8: US fiscal deficit and debt/GDP during wars & pandemics
Inflation volatility
It is also notable that wars have typically been associated with a much more volatile macro environment. Recessions were experienced much more frequently from the 1940s to the 1970s compared to the 1980s to 2020s, when the US became an undisputable hegemon (post Cuban Missile Crisis and Yom Kippur War) as per Fig. 9.
The macro Catch-22: Positive real interest rates to control inflation...
Fig. 9: 10-year UST and US CPI during recessions, and wars & pandemics
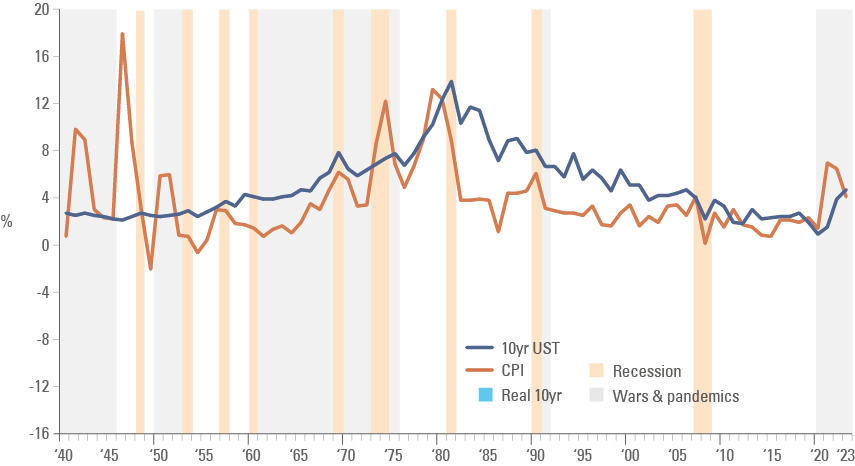
...or negative real interest rates to lower debt levels?
The same figure also shows how real interest rates dropped to deep negative levels during wars and pandemics. Today, the US consumer and investment grade corporates may have little leverage in their balance sheet and fixed costs of funding. However, the US government is massively indebted and will struggle to service its debt. There is a tension building up on the politics of money that were experienced several times over the last centuries. Positive real interest rates for a long time are needed to control inflation. However, negative real interest rates are necessary to lower debt/GDP. Which one will prevail? Last week the Bank of Israel, for example, kept its policy rate unchanged and said future monetary policy decisions will be contingent on the evolution of the war.
4) Energy transition
The other massive paradigm shift involves the energy transition. Most of the world’s largest countries have agreed on a target to restrict pollutant emissions in order to keep global temperatures from rising more than 1.5°C from the pre-industrial era. We have written in previous publications about the implications of implementing such a transition in a ‘just’ manner for EM and FM countries.7 Instead, this note focuses on the impact of the energy transition on growth and inflation at the macro level.
Energy transition will demand large investments...
The high level aim of the energy transition is to rebalance the world’s energy matric from 80% fossil fuels and 20% renewables, to 20% fossil fuels and 80% renewables, while ensuring energy production continues increasing to maintain and fuel economic progress. This will demand a gigantic expenditure of capital in energy generation, transmission and distribution and disrupt several sectors (i.e., automakers) in the process. Bloomberg New Energy Finance estimates USD 196trn of capex (USD 6.7trn per year) would be required to achieve the targets. This is roughly 2x the global GDP in 2022. Increasing capex at a time when the global economy is close to full employment is likely to be inflationary.
...following a large decline in fossil fuel capex.
Furthermore, well-intended investors trying to diversify their portfolios away from fossil fuel and polluting activities have contributed too little in energy and mining over the last years. Some of the low capex was due to fears over ‘stranded assets’ that led institutional investors to sell energy assets indiscriminately. Companies that invested over the last ten years have an advantage, the overall level of capex in the energy sector has been very subdued, exacerbating the risks of shortages. Data from Deutsche Bank shows that oil capex peaked at 6.7% of GDP on average between 1980-1982 before declining to 1.8% of GDP between 1986-2003. These low levels of investment contributed to the commodity Supercycle of the first decade of the current century. Then from 2008-2013, oil capex rose to 4.6% of GDP on average (led by US shale oil), causing the large decline in commodity prices from 2012 onwards. Since 2014, oil capex has oscillated from 1.8% to 3.0% of GDP.
Not only are these assets likely to remain valuable, but they may also be part of the solution. Fig. 2 illustrates how EM energy oil and gas companies trade at a large discount against their valuations from 2010, despite a solid return on equity and attractive dividend yields. The recent large mergers and acquisitions in the sector (Exxon buying Pioneer and Chevron merging with Hess) against a backdrop of companies struggling with elevated costs, exemplify the challenges faced to discover and produce more energy.
EM is an integral part of energy transition
In the metals and mining sector, several private sector analysts have estimated the demand for key metals necessary for the energy transition (such as copper, nickel, lithium, cobalt, and vanadium) will be orders of magnitude larger than the available supply, even under a scenario of larger capex and larger metal recycling. Most of these resources today are in EM countries. There is no energy transition that doesn’t pass via EM.
Summary and Conclusion
Times are tough. People are feeling displaced and misrepresented, and voting for populist governments is becoming the norm. The risks of large global conflicts have increased. Macroeconomic stability was lost on the response to the pandemic and there is a risk that the bellicose environment dominates the fiscal agenda.
Investors have a fiduciary obligation and need to think outside of the box when it comes to asset allocation. Diversification across asset classes and geographies is the only tool investors are in full control of when it comes to risk reduction. In our view, investors should have 5x20 instead of 60/40 portfolios.
Geographically, investors should have a heavy overweight to neutral countries (mostly in EM and FM) and avoid having too much exposure in countries that can emerge as losers of wars. Active management is paramount as selecting countries and companies with good (or bad but rapidly improving) fundamentals in EM and FM should be a priority. The biggest potential loser, as always, it the one that has the most to lose. And today most portfolios are extremely concentrated in largest equity market in the world which trades at expensive valuations, suggesting low future returns, and carries high geopolitical and macro risks.
The author thanks the contribution of Alessandra David.
1. See – Real assets such as infrastructure, real estate.
2. See – Fixed income represented by the Bloomberg Global Aggregate and equities by MSCI World All Countries Index.
3. See – Fig 16 on '2023 Outlook for Emerging Markets - A year of two halves'
4. See – https://www.msci.com/www/index-factsheets/msci-acwi/05737588
5. See – https://www.geopolitic.ro/2018/11/active-geostrategic-faults-world-2/
6. See – ‘Rethinking TINA: The Emerging Eight’, The Emerging View, 15 August 2023. and – ‘The case for local currency bonds “Si, se puede!”’, The Emerging View, 28 July 2023.
7. See – ‘Solving the energy transition paradox in Emerging Markets’, The Emerging View, 28 September 2023. and – ‘Seven policy proposals to meet the Paris Agreement objectives’, The Emerging View, 13 April 2023.