
The role of the human psychological cycle in driving stock and bond prices is well understood and pre-dates behavioural economics. There are elements that suggest we may be going through another period of ‘irrational exuberance’ as several long-term investors seem stuck in the mindset that ‘There Is No Alternative’ (TINA) to US equities.
We believe investors ought to turn their attention to equity markets that are undervalued and have clear upside catalysts, drop the home bias and nationalism aside to focus on Emerging Markets (EM) equities.
The unusual allure of short-term debt
Warren Buffett is investing in United States (US) Treasury Bills (zero coupon bonds shorter than one year). Elon Musk thinks that T-Bills are a “no-brainer”. It makes sense. At 19.5x earnings the S&P 500 Index offers a 5.1% earnings yield, which is below the 5.3% on one-year T-Bills and only 0.9% above the 10-year US Treasury, sitting around 4.2%. Fig 1 shows the ‘earnings premium’ sits close to the lowest period in circa 20 years.1
S&P 500 earnings premium is at a 20-year low
Fig 1: S&P 500 Earnings Yield vs. 10-year UST
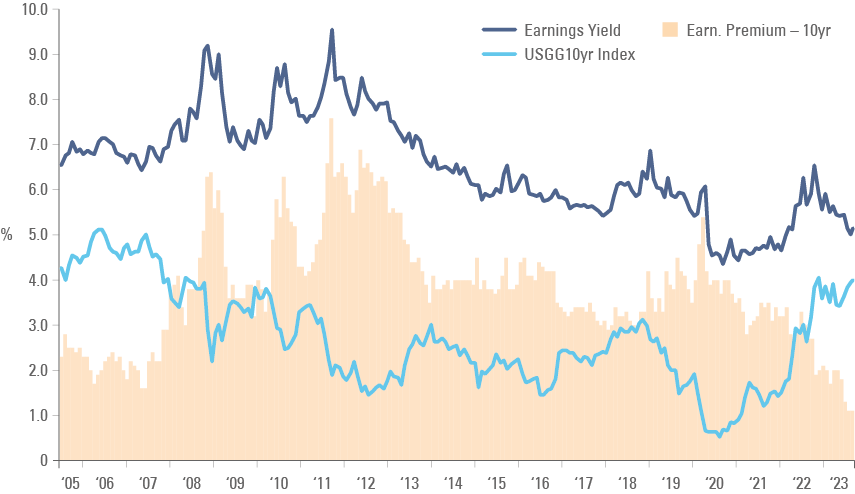
Low earnings premium explains the allure of T-Bills. An asset with ‘volatility-free’ cash returns superior to the stock market ought to be a large part of investors’ books, particularly long-term investors that can afford to sit-out of an irrational market for longer. However, this approach carries risks.
Hidden risks
Investors buying US bonds as ‘risk free’ ignores the massive fiscal deficit risk. At current yields the US deficit is becoming a rolling ‘snowball’ that demands the US to execute a thorough fiscal consolidation, something both Democrats and Republicans have shunned since the early 1990s.2 The massively imbalanced US economy means its currency is very likely to underperform over the next decade. From its peak in September 2022, the Dollar index has already depreciated more than 10%, so those ‘cushy comfy’ T-Bills are not protecting investors’ purchasing power.
Key risks for US bonds are large fiscal deficit and dollar depreciation
Furthermore, there is only so much fixed income investors can have in a portfolio. Long-term investors need long-term return sources. For several years, US pro-cyclical fiscal policies created an extraordinary environment for US stocks, forcing investors to exit positions in the rest of the world in favour of the US. When interest rates were at zero and US stocks were outperforming everything else, the catchphrase became: ‘There Is No Alternative’ (TINA) to the US stock market. This is no longer true.
TINA is over
The land of opportunity
The obvious alternative is right in front of investor’s eyes. The earnings yield on EM stocks stands at 8.3%, in line with the average since 2005. However, the spread over 10-year local bonds stands at 3.2%, or 50 basis points (bps) above the average since 2005 (Fig 2). EM central banks are ahead of the curve, with Vietnam, China, Chile, and Brazil already embarking on monetary policy cuts driving EM yields lower, in sharp contrast with the yield on Developed Market (DM) countries which is testing their all-time highs.
EM-stocks should re-rate higher, driven by rate cuts
Fig 2: EM_13 Earnings Yield vs. 10-year EM bonds
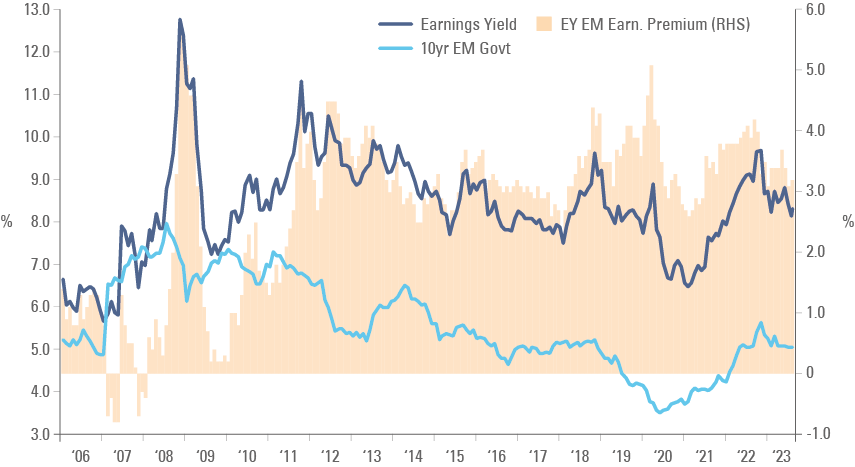
Monetary policy easing will either make the EM earnings yield significantly more attractive or drive a re-rating of EM stocks to higher valuations, or perhaps, both. In fact, the combination of a weaker USD and lower interest rate in local currency bonds will very likely boost GDP growth across EM countries.3 GDP growth is correlated both with the USD cycle (weak USD improves liquidity to EM countries and vice-versa) and credit growth (lower rates drive credit growth). Lower valuations, better fundamentals and favourable technicals mean TINA is gone and investors should focus on EM equities.
Big picture valuations
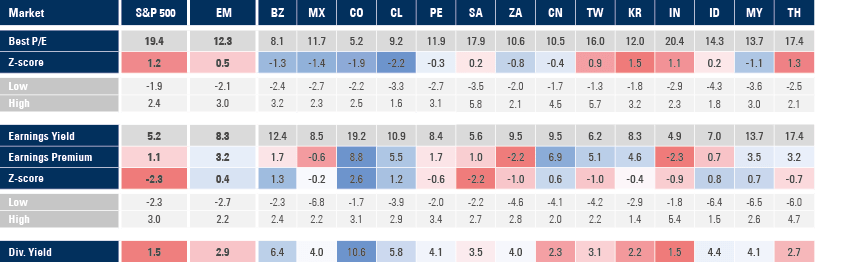
Seasoned investors will be interested in the breakdown of earnings yield by country. Fig 3 shows the price-to-earnings (P/E) ratio, the earnings yield (EY), and the gap between earnings yield to 10-year government bonds (EY-10yr), as well as the dividend yield (Div. Yld.) of the S&P 500,MSCI EM and the largest 14 countries on the MSCI EM (adding to 94% of the index).
Earnings yield and premium elevated across most EM countries
Fig 3 also has the z-score (standard deviations away from average) and the highest and lowest z-score readings since 2005 of the P/E ratio and the EY-10yr. Interestingly, some countries wheregovernment bonds are elevated such as Brazil, Colombia, Chile and Indonesia offer some ofthe largest EY-10yr premiums since the inception of the MSCI EM data.
Fig 3: P/E ratio, EY, EY-10yr Government bonds, DY for S&P 500, MSCI EM and largest 14 MSCI EM Countries
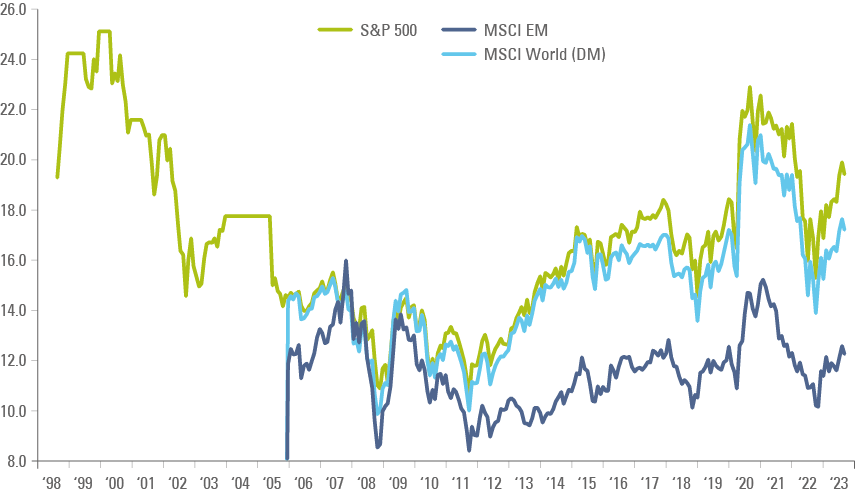
The P/E ratio of the MSCI EM is very attractive against not only US stocks, but also against the MSCI World, which includes all DM countries, but no EM. Fig 4 extends the P/E chart of the S&P 500 simply to illustrate how US stocks are still trading at the most expensive valuations since the dot-com bubble and the recent 2021 peak. It also shows MSCI EM trades at the largest discount (ex-2021) to MSCI World and S&P 500 since 2005.
EM stocks are undervalued vs DM and US
Fig 4: Price-to-earnings (one-year forward estimates) ratio
The Magnificent Seven
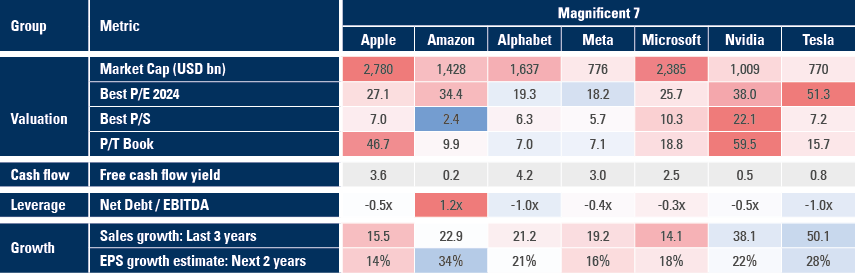
The year-to-date performance of US stocks is attributed to a narrow set of companies, coined the ‘Magnificent Seven’ (Mag 7). These companies build impressive businesses and have had an extraordinary run over the last decade. They were perceived as ‘save havens’ so far in 2023 when most investors expected some sort of economic slowdown (but no hard landing). The artificial intelligence (AI) frenzy and energy transition legislation – including the Inflation Reduction Act – were the narratives making the case for several of these companies. Lastly, the US fiscal expansion was another factor fuelling US stocks, in our view. The massive rally renders these seven companies magnificently expensive, as highlighted in Fig. 5. They may not crash, but basic physics principles suggest it is much harder to replicate the returns on a these mega-caps after such a tremendous run.
US mega-cap (Mag 7) stocks are expensive post rally
Fig 5: Magnificent 7: Fundamental Metrics
The Emerging Eight
In contrast, several EM companies that should be benefiting from the same trends got very little – if any – love from investors. There is no AI without advanced semiconductors and yet the Taiwanese behemoth TSMC trades below 15x earnings, which is nearly half that of one of its largest clients (Apple), and 6.3x sales, four times below the chip designer Nvidia, as per Fig 6.
EM mega-cap (EM 8) stocks offers better value across themes
Fig 6: Emerging 8: Fundamental Metrics
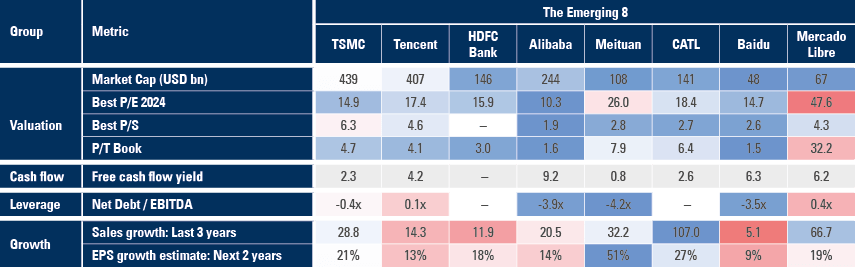
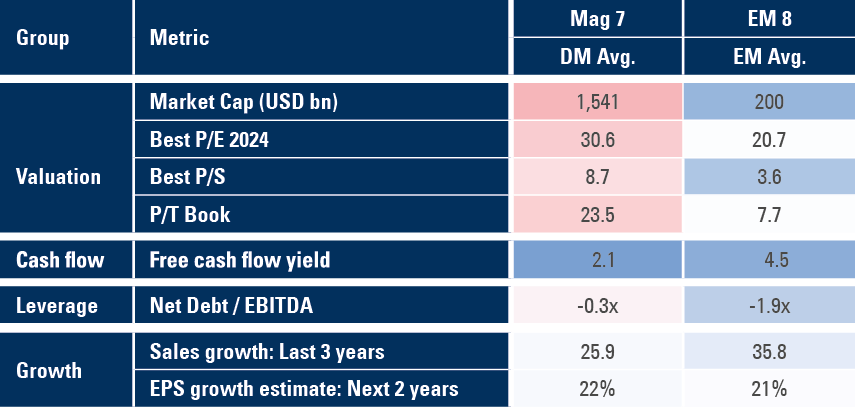
In the energy transition theme, the largest manufacture of lithium batteries in the world (CATL) trades at 18.4x earnings, nearly one-third of the valuation levels of Tesla, even though its sales growth over the last three years were twice that of Tesla’s and the next two year’s growth is similar. A simple average of key metrics of the Emerging 8 (EM 8) shows much cheaper valuations, including half price-to-sales (P/S) and lower P/E, better cash flows (twice more free cash flow yield), and a larger cash position (negative net debt). Furthermore, the EM 8 and has grown 10% faster than the Mag 7 over the last three years and have similar growth estimates for the next 2-years.
The EM 8 stocks offer comparable growth at 50%+ cheaper valuations
Fig 7: Magnificent 7 vs. Emerging 8
The Panda in the room: Let’s talk about China
China has its problems. It is obvious and it has been all over the press for nearly two years now. High indebtedness, a declining population, high youth unemployment, a real estate crisis, and sputtering sentiment are the main ones. These problems are already reflected in the country’s equity risk premia, in our view, with MSCI China trading at 10.5x P/E, nearly half that of the S&P 500. Chinese stock markets represent close to one-third of MSCI EM stocks, albeit they are misrepresented in global portfolios at slightly more than 3% of the MSCI All Countries World Index, compared to 4.7% weight in one single US company in the Mag 7. Let that sink in for a moment. All Chinese companies are 40% smaller than one US stock. Moreover, all EM stocks represent slightly less than 10% of the MSCI ACWI, compared with the Mag 7 at 16.5%. A brave investor with a 50% overweight in EM stocks today would have just as much China as the top Mag 7 company and less EM exposure than the combined Mag 7. In contrast, the US seems over-represented, accounting for nearly 62% of the MSCI ACWI. This is too large or a weight in comparison to the size of the US economy or even the revenues in the MSCI ACWI derived from the US (c. 31%).4
Both China and EM are grossly misrepresented in Global Indices
Is it wise to bet on the demise of China? Despite scepticism over many decades, China’s entrepreneurial private sector has allowed the economy to overcome many challenges. The country’s development path continues. China now is the largest exporter of automobiles in the world. It is on the frontier of technological development on AI, machine learning, robotics, and space. It has also the largest scale of production of solar panels, wind turbines and, increasingly, electric vehicles.
In terms of the debt problems, it is worth remembering that China’s large liabilities are concentrated in a few sectors (real estate, state owned enterprises, and local governments). These loans were made at the direction of the state, by state controlled banks, providing the government the ability to control the pace and recognition of non-performing loans. The state-controlled credit system is de-facto closed and relies on its own savings, which have increased since the Covid-19 crisis. China’s gross savings rate, as a share of GDP, was 45% in 2021, higher than in Germany (31%), the US (18%), Canada (22%), France (24%) and Japan (26%). Importantly, most potential hidden bad debts are held by state-owned firms, while the leverage of the privately owned companies is not elevated. Furthermore, China has the largest stock of financial assets in the world, USD 12.5trn according to the International Monetary Fund.5
China’s leadership can control their debt cycle
The Chinese leadership is clearly aware of the risks of a global economic slowdown and will be keen to avoid the Chinese economy to spiral into a ‘balance sheet’ recession. Unlike Japan in the late-1990s, China has no bubble in its stock market. And, unlike both the US (in 2008) and Japan, China has pre-emptively tightened conditions for the real estate market since 2015 to protect long-term financial stability, a result of China’s long-term strategic policies driven by its longer political cycle.
Comparing China to Japan in the late 80s is inaccurate
Importantly, China is at a very different stage of the economic cycle than most DM and EM economies, which have been slowing down due to aggressive monetary policy tightening over the last 12 months (DM) and 24 months (EM ex-China). As a result, yields on Chinese government debt and mortgage rates are declining, which gives the central government room to bail-out local governments, should it become necessary. In contrast, the ‘helicopter money’ experiment of many Western economies brought the return of inflation and yields on global bonds have been widening across DM.
Don’t Fight the Politburo
The direction of policy is clearly turning. The sudden reopening of China’s economy in December 2022 has been the main driver of global GDP growth in 2023 so far. The reopening thesis played well in Q1 2023 and sputtered in Q2 2023, mostly due to low confidence. After which, the Politburo has made it a priority to improve the business climate. Therefore, there is more upside than downside in terms of the Chinese economy driving economic growth.
Politburo keen to support private sector’s confidence
Foreign investors’ suspicion of China is a political matter, in our view. The US has waged a trade war (under what we see as a misguided attempt to correct China’s ‘unfair’ competitive advantages) and more recently, protectionist policies forbidding selling high-spec semiconductors to China on national security grounds. Despite the one-sided protectionist measures, China’s trade increased in Dollar terms, led by more transactions with other EM countries (South-South). Ultimately, China’s resilience relies on the fact that is very hard to diversify the massive supply chain away from Asia and that the Asian supply chain is deeply and inextricably intertwined with China.
China controls many supply chains, making separation challenging
The national security protectionism may be peaking as well. The Biden administration has just unveiled the much-expected rules limiting US companies’ investment in China. The rules were not as harsh as anticipated, adopting a narrow take on AI prohibition (for military end users only), not expected to expand to other sectors (such as biotechnology) any time soon, giving multiple opportunities for exporting companies to weight on implementation (a 45-day comment period), allowing portfolio investments. Moreover, the rules only come into force next year. A reset of China’s diplomatic relationship with the West (particularly the US) would also be important to re-engage foreign investors. The recent resetting of the relationship with Australia and Europe’s ambiguous stance (Volkswagen buying a stake in Chinese electric vehicle manufacturer XPeng) are also noteworthy signals.
Summary and Conclusion
Investors are stuck in their allocations to US stocks even though many alternatives are in plain sight.
The allure of short-term debt against equities is not only due to the high yield on T-Bills, but also the low earnings yield on US stocks. The eye-watering US equity market valuations are the result of a tremendous run fuelled by what we strongly believe as unsustainable policies and stretched narratives.
But there is no more TINA. EM stocks offer significantly better valuations (stocks and currencies) and have implemented, in our opinion, better policies since the Covid-19 shock than DM.
The share of China in EM stocks has been putting some investors away from the asset class and explain some of its recent underperformance. However, the risks to Chinese stocks are well known and fully priced in our view. Low valuations mean investors give no benefit of the doubt, despite China’s strengths and any potential improvement on its business environment.
The authors thank the contributions of Patrick Cadell.
1. See: A comparison with 10-year bonds is more appropriate than t-bills, in our view, considering the long duration nature cash flow from stocks..
2. See: https://www.wsj.com/articles/fitch-downgrade-us-credit-rating-4ad98230?s=09
3. See: 'The case for local currency bonds “Si, se puede!”', The Emerging View, 28 July 2023.
4. See: MSCI 2021. Second column: Global revenues for MSCI ACWI companies are broken down by regional index.
5. See: https://www.imf.org/en/Publications/WP/Issues/2023/08/02/Fiscal-Policy-and-the-Government-Balance-Sheet-in-China-536273