

Short on time? Download the five-page summary.
Introduction
The US Federal Reserve (Fed) raised interest rates by 25 basis points (bp) to a range of 3.75-4.00% on 16 September, its first hike since July 2023. Overnight swaps imply nearly four 25bp increases by the end of 2027, with the Federal Open Market Committee’s (FOMC) dot plot signalling one of these by year-end.
The ten-year US Treasury yield has risen well above 5% for the first time since 2007 and is now around 5.3%. In past cycles, a tightening Fed and an oil shock have led to sharp underperformance of emerging market (EM) assets. This time, so far, the reaction has been muted.
Since the pandemic, the pillars of EM performance have been improved fundamentals, the AI-driven global investment cycle and Chinese disinflation. These have supported EM GDP growth and driven a sharp increase in earnings, while keeping EM inflation anchored. In our view, these factors are relatively insensitive to the Fed’s reaction function. As such, we remain constructive on EM equities and local currency debt and would use the current uptick in the US dollar (USD) and rates as an opportunity to add exposure.
1. A hike into an energy shock, not an EM crisis
After holding the federal funds rate unchanged in his first two meetings as Fed Chair, Kevin Warsh’s first move came in the form of a unanimous hike. If the goal is now to bring inflation back to target meaningfully faster, more hikes are likely to be required. The market is pricing an 85% probability of another hike this year. A further 50bp of risk premium into 2027 puts the implied fed funds rate at c. 4.7% by December 2027, equivalent to at least three additional hikes.
Energy prices are yet to meaningfully affect US core inflation
Warsh framed the hawkish pivot as a push to accelerate disinflation and stop the energy shock from broadening into core inflation. There are various reasons why this has not happened so far, but perhaps the most important are slowing wage growth and the fact that monetary policy is broadly neutral.
Furthermore, the current energy shock does not quite compare in price terms to the seven major oil shocks of the past 50 years. In real terms, adjusted for 2026 prices, West Texas Intermediate (WTI) reached levels equivalent to USD 150 a barrel in the late 1970s and remained well above USD 100 for multiple years. In the run-up to the 2008 crisis, WTI rose to over USD 200 and remained within the USD 100-150 range for the best part of eight years. Even in 2022, prices averaged around USD 125 for multiple months. So far, despite the disruption in the Strait of Hormuz (SoH), the most important global energy waterway, we are not at a comparable level of stress.
In real terms, oil prices are not as extreme as in prior oil shocks
Fig 1: WTI crude oil, nominal vs real
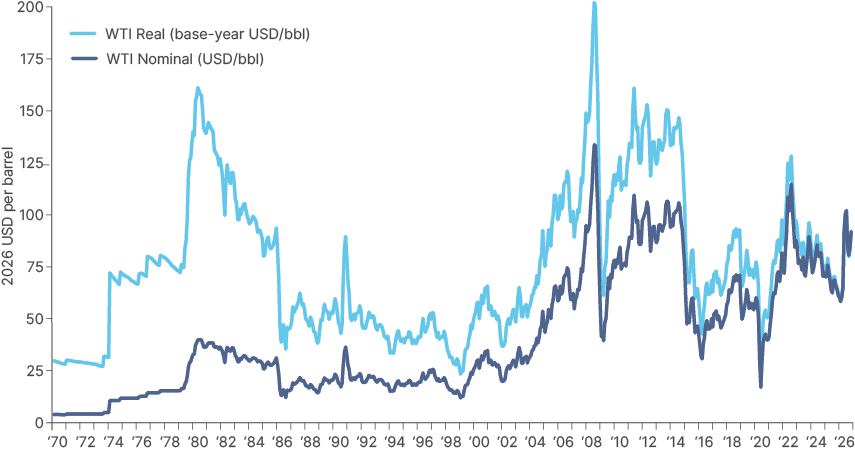
It is true that the shortage of refined products is more acute than the shortage of crude. US diesel prices are at all-time highs in nominal terms and close to them in real terms, at around USD 6.20/gal versus a 2008 peak of circa USD 7.25 in 2026 dollars. But they would need to stay at these levels for considerably longer to match past episodes: the 2026 year-to-date average of around USD 5.00/gal compares with USD 5.90 in 2008 and USD 5.75 in 2011-2013 and 2022.
The US Energy Information Administration (EIA) expects Middle Eastern output to stay below pre-conflict levels until Q2 2027. However, traffic through the SoH has been improving to close to normal levels in recent weeks, helped by US military escorts, although the lack of a definitive resolution means that the normalisation of flows remains fragile. After Houthi attacks, the Bab al-Mandab Strait, which links the Red Sea to the Indian Ocean, was also temporarily unavailable as an alternative route.
High energy prices alongside higher US policy rates triggered EM crises in the 1980s, 1990s and 2013. However, EM is more insulated this time, in our view, for four reasons:
- EM fundamentals have improved meaningfully since prior Fed hiking episodes. In 2013, for example, EM currencies were overvalued, and several large countries (the ‘Fragile Five’) were running large external imbalances.1 Back then, commodity prices were also declining sharply as the US ramped up shale oil and gas output. Today EM currencies are anchored by much tighter monetary policy than in developed markets (DM) – particularly since the pandemic. Currencies are mostly fairly valued or undervalued and external accounts are robust, with most large EM countries either running current account surpluses or small deficits backed by comfortable FX reserves.
- Higher fossil fuel costs and resulting higher bond yields are not yet reducing the pace of global capital expenditure. The largest companies are funding most of today’s investment cycle from their cash flow, not credit.
- Chinese exports continue to anchor EM inflation lower.
- The USD has failed to rally on events that should have lifted it (see Section 4).
EMs are absorbing high energy prices better than in past episodes
2. The investment cycle is lifting commodity exporters and tech manufacturers
The current AI-led investment cycle is lifting EM GDP growth as commodity exporters and technology manufacturers both benefit. AI investment has continued through tariffs and the SoH crisis, leading to an enormous transfer of capital from hyperscalers to EM technology companies, as per Fig 2. Meanwhile, the macro shocks of the 2020s so far (Covid, Russia’s invasion of Ukraine, US tariffs and the US attack on Iran) are likely to structurally lift public and private spending on defence, supply chain resilience and energy security.
AI-driven investment has shrugged off external shocks
Fig 2: Free cash flow of US hyperscalers vs EM 4 (TSMC, MediaTek, Samsung, SK Hynix)
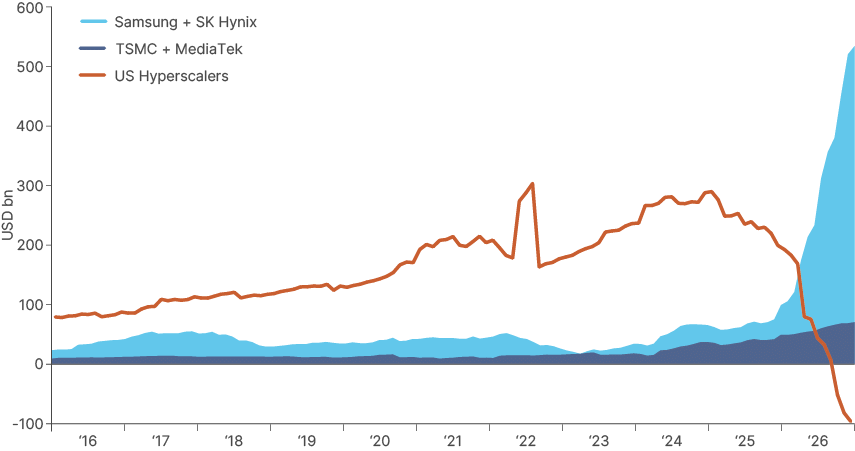
The AI-driven capex cycle is already the largest since the 19th-century railroad boom. Goldman Sachs estimates hyperscaler capex will reach USD 1.2trn in 2027, around 3.5% of US gross domestic product (GDP). In our view, AI investment is so strategic for both public and private sector actors that a 25bp, or even 75bp, hike is unlikely to change the calculus.
This is particularly true given that hyperscalers continue to fund most of their capex from operating cash flow. Leverage is rising, but from a low base: debt funded just 9% of hyperscaler capex in FY24, rising to around a third by mid-2026. Notwithstanding rising off-balance sheet commitments, the largest hyperscalers other than Oracle still have positive net cash on reported balance sheets, albeit only narrowly in Meta’s case.
To a far greater extent than Fed policy, the trajectory of AI capex from here will be determined by return on investment. For now, the signs are encouraging. Cloud revenue growth has accelerated sharply. In Q2 2026, Google Cloud grew 82% yoy with Microsoft Azure growing 43%. Amazon Web Services (AWS) grew at its fastest pace in four years, 37% yoy. Profit margins are expanding too. AWS’s operating margin rose to 39% in Q2 2026 from 33% a year earlier, and Google Cloud’s to 36% from 21%, suggesting growth is not being bought through discounting.
Return on investment will make or break AI capex growth, not rates
Demand visibility is also high. The three largest cloud providers have a combined contracted backlog of around USD 1.7trn, and all remain capacity-constrained, with Amazon expecting compute demand to outstrip supply into 2027. Ultimately, if demand for compute remains on its current trajectory, supply will have to respond – and the EM semiconductor complex will continue to benefit.
As in any technology cycle, the winners will eventually broaden from the enablers and their supply chains to the adopters. For the adopters, success will depend on pairing AI with advantages rivals cannot easily copy, such as scale, distribution and cheap inputs.
China has all three of these advantages, in abundance. Its model usage already far outstrips that of the US: Chinese models process more than three times as many tokens as US models on OpenRouter, the largest neutral application programming interface (API) router, and domestic consumption has risen a thousandfold since early 2024. Its super-app platforms can push AI to hundreds of millions of users overnight, while abundant cheap energy (China generates more than twice as much electricity as the US) allows for fast adoption. It also has the world’s largest manufacturing base to apply AI to, accounting for close to 60% of global industrial robot installations in 2025, and an explicit state policy, the ‘AI Plus’ plan, targeting mass adoption of AI-enabled devices and agents by 2027 across industries.
Increased AI adoption could drive another leg of earnings growth
More broadly, cheaper, open-source Chinese models will allow EM companies to adopt AI as quickly as their US peers. With younger capital stocks and less integration with legacy software, EM service sectors are well positioned to adapt swiftly to the AI era.
3. China continues to anchor EM inflation
China’s export boom reflects private sector overcapacity amid weak domestic demand and the deleveraging of infrastructure and real estate. Low return on assets in super-competitive industries alongside corporate indebtedness forces companies to pursue scale to outlive competitors. This translates into declining prices which, alongside a historically weak Renminbi, mean that China has continued to export disinflation to the world.
China exporting disinflation is an under-appreciated EM macro factor
Chinese excess capacity, therefore, sets the price of tradable goods in EM ex-China. That has offset much of the energy and freight impulse into goods inflation. We believe that investors underappreciate this dynamic. Alongside subsidised gasoline and diesel prices, it is a key reason why the SoH shock has not spread into EM inflation as much as it might have.
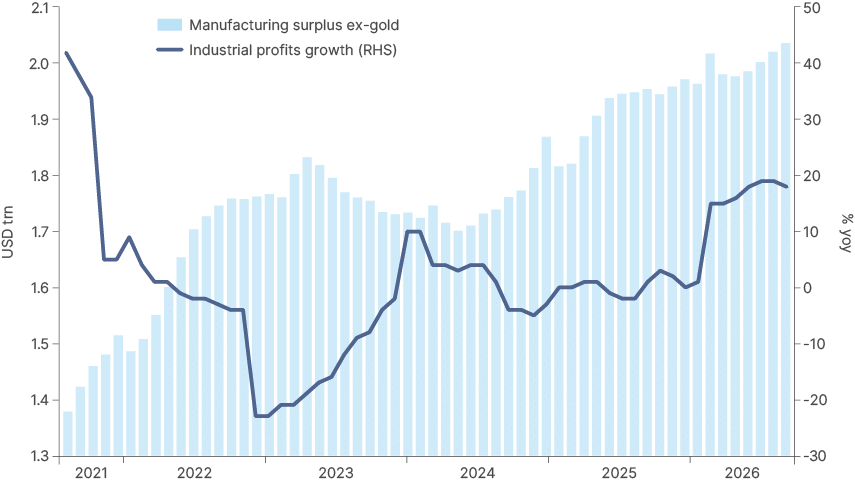
Over the last five years, the manufacturing trade surplus ex-gold has continued to rise, while industrial profit growth has stayed close to or below zero most of the time, as per Fig 3. China’s export volumes are rising faster than exports in USD terms, another sign that China is exporting excess capacity at lower prices.
China’s industrial profits flatlined in 2025 while trade surpluses grew
Fig 3: China trade surplus ex-gold vs industrial profits
Anchored EM inflation is coming alongside stronger GDP growth. Fig 4 shows that EM ex-China GDP growth has been edging up compared to DM as well as to DM ex-US, as inflation differentials between the groups continue to narrow.
The EM vs DM growth differential is widening
Fig 4: GDP growth and CPI inflation across EM, EM ex-China, DM and DM ex-US
| GDP-weighted economic data/forecasts | ||||||||
|---|---|---|---|---|---|---|---|---|
| GDP | CPI | |||||||
| Region | 2024 | 2025 | 2026 | 2027e | 2024 | 2025 | 2026 | 2027e |
| EM | 4.2% | 4.4% | 4.2% | 4.0% | 3.8% | 3.3% | 3.2% | 2.9% |
| EM ex-China | 3.6% | 3.8% | 3.9% | 3.7% | 7.0% | 5.2% | 5.0% | 4.2% |
| DM | 1.9% | 1.8% | 1.7% | 1.6% | 2.7% | 2.5% | 2.4% | 2.1% |
| DM ex-US | 1.1% | 1.5% | 1.2% | 1.3% | 2.6% | 2.2% | 2.4% | 1.9% |
| EM ex-China vs DM | 1.7% | 2.1% | 2.2% | 2.0% | 4.4% | 2.7% | 2.5% | 2.1% |
Sources: Ashmore, Bloomberg, CEIC. Data as at September 2026.
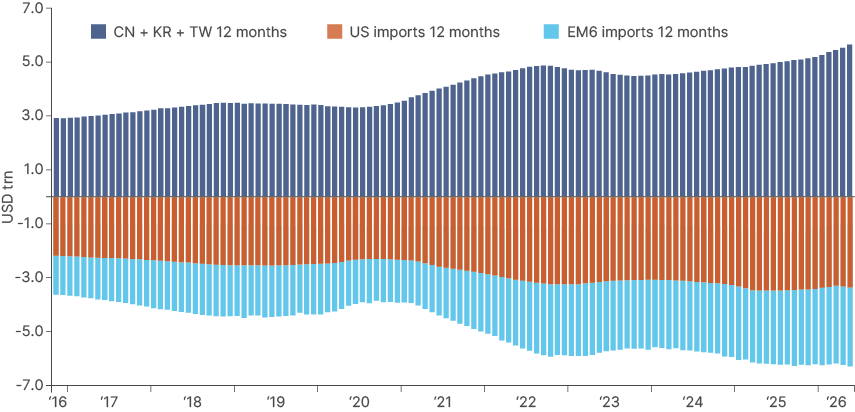
As exports from China, Korea and Taiwan have risen, both in nominal terms and as a share of global GDP, imports by the US have moderated, but imports by large EM countries have increased, as per Fig 5. Global trade volumes are not contracting but being reallocated, with more emphasis shifting towards intra-EM trade.
Global trade is not declining, but being re-allocated
Fig 5: Exports from China, Korea and Taiwan against imports by the US and 6 largest EM
4. The USD has ignored every reason to rally
Interest rate differentials are usually a key driver of currency movements. In 2025, for example, the USD’s decline was helped by falling US real rates. However, sometimes structural factors such as balance of payments dynamics take precedence. The fact that the USD has failed to gain much traction despite higher US rates, bullish earnings from US corporations, and a favourable terms-of-trade shock driven by higher oil prices is, in our view, compelling evidence that the USD is on a structurally weakening path. To be sure, the USD started inching higher after the FOMC hike, but the magnitude of the move has been underwhelming.
The fact the USD has failed to meaningfully rally in 2026 is a signal
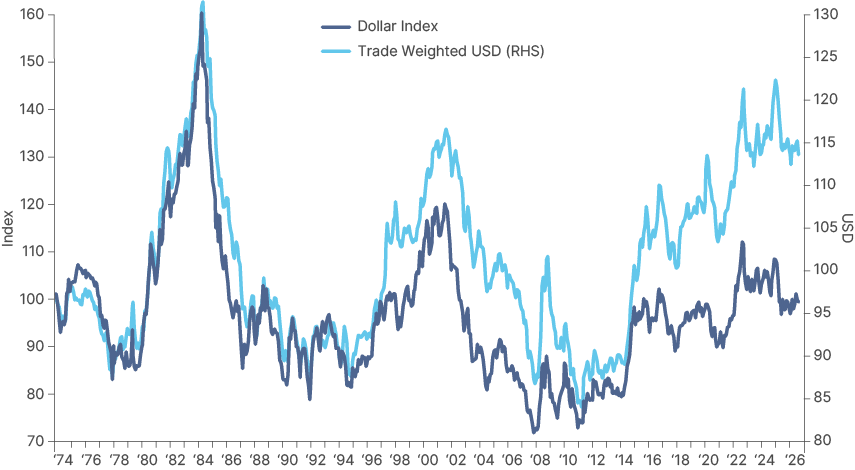
This strengthens our conviction that the USD is in the early innings of a multiyear downtrend. Fig 6 shows that the trend is now four years old. It started in September 2022, when the Dollar Index (DXY) peaked at 114.8. It then posted a lower high of around 110 in January 2025, just before Trump’s inauguration. The current rebound has taken it to around 102.
Carry does not drive structural depreciation cycles. The current cycle will be driven by three forces, in our view: foreign holders of US assets seeking diversification, the deterioration of US institutions, and the imbalances on the US external accounts. All three work against the greenback and a few 25bp hikes change none of them.
Current levels suggest the USD can decline much further. The trade-weighted Dollar Index in real terms remains close to the highs reached at the peak of the dot-com bubble in 2001 and at the 1985 peak that prompted the Plaza Accord, as per Fig 6. Today, we have both dynamics: foreign investors have a large overallocation to US assets, as in 2001, and the current US administration is actively working for stronger Asian currencies, as in 1985.
The USD remains overvalued and in a downtrend, in our view
Fig 6: Dollar Index (DXY) and real trade-weighted Dollar Index
5. US fiscal policy: from pro-cyclical to constrained
The US primary fiscal deficit is on track to widen again in 2026, after a brief consolidation in 2025. One source of fiscal easing was intended: tax cuts and accelerated capex and R&D depreciation under the One Big Beautiful Bill Act (OBBBA). The other source – tariff refunds mandated by the Supreme Court – was not.
Contrary to the prevailing narrative, fiscal policy may tighten again from here. The Treasury plans to keep trimming non-defence discretionary spending and, now that tariff refunds are mostly over, net tariff revenue will start rising again. The mid-term elections are likely to hand the Democrats the House, blocking any further Republican tax-and-spending packages passed through reconciliation. And the Social Security trust fund’s depletion in 2032 will force entitlements onto the next president’s agenda from 20 January 2029. This matters for equities: since 2017, excess fiscal stimulus has been a key factor behind the rise in US earnings and market capitalisation, so consolidation will likely unwind earnings growth at the margin.
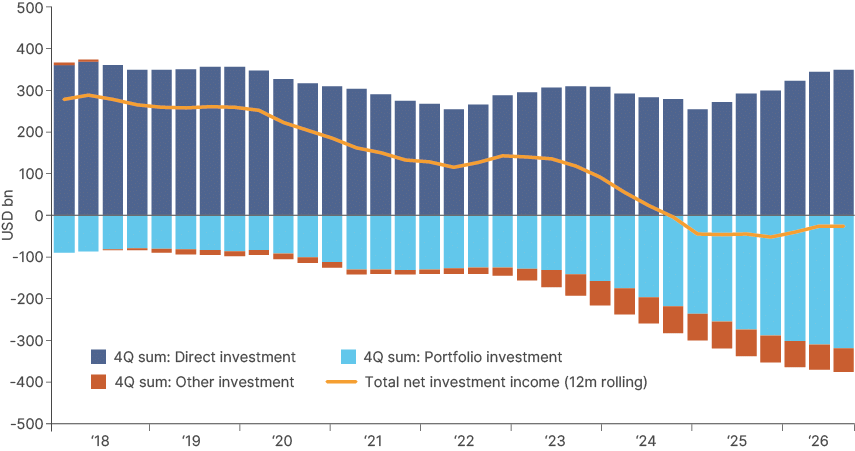
Even without consolidation, the US has no room to pursue further fiscal expansion. Bond vigilantes are already demanding a higher term premium to finance US deficits. Rising interest expenditure is exacerbating the issue. The external accounts are the other constraint, and one investors often overlook: the net investment income balance swung from positive to negative in 2024 as higher Treasury yields raised the interest bill paid to foreign holders, as per Fig 7. This rules out further pro-cyclical expansion without a large USD depreciation, which significantly raises the bar for the USD to rise from here.
US net investment income flipped negative in 2024
Fig 7: US net investment income, rolling four-quarter sums
6. Different regions, different tailwinds
The drivers of EM growth vary across regions:
- Asia benefits from AI investment. South Korea and Taiwan lead, followed by Singapore, Malaysia and, to a lesser extent, Thailand. The baton will pass from semiconductors and data centres to AI adopters. China is well placed for that rotation. India remains the most interesting orthogonal story in the G20. It offers a large domestic economy, a credible policy framework and returns independent of the global tech cycle. On the macro side, a stronger JPY will support EM Asian currencies, creating opportunities in local currency assets.
- Latin America (LatAm) benefits from rising demand for resources. Governments are shifting from the left to the right and far right. Under what we call ‘Monroe Doctrine 2.0’, the US is investing in the region as well as disciplining it. Valuations are undemanding, so terms-of-trade support and lower political risk premium have room to work.
- Eastern Europe benefits from European defence spending. Germany’s EUR 1trn programme for infrastructure, energy and defence spills over into regional supply chains. Around two-thirds of the EUR 150bn Security Action for Europe (SAFE) package goes to Central and Eastern European countries. The region also stands first in line for Ukraine’s eventual reconstruction.
EM growth drivers remain diverse
7. Earnings growth driving EM equities: structural reforms driving Frontier
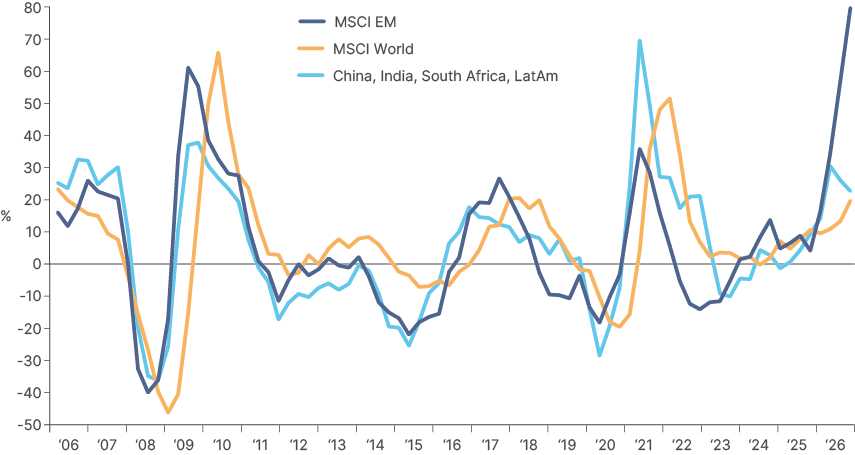
EM earnings per share (EPS) have risen organically at their fastest pace in over 20 years, as per Fig 8. Taiwan and Korea drive the headline outperformance through the memory and foundry cycle. We believe we are in the middle of a supercycle in semiconductors. It is likely that supply will take years to catch up with the surge in demand from agentic AI, and technologies that are still to scale, such as self-driving cars and humanoids. Despite the concentration of earnings growth in two countries, EPS is rising across regions, including LatAm, South Africa, India and China. This matters for the durability of the EM rally. As capital diversifies from the US to the rest of the world, EM valuations have room to re-rate into robust earnings growth.
EM earnings growth is not all Taiwan and Korea
Fig 8: 12-month forward earnings per share in EM (MSCI EM) vs DM (MSCI World) & MSCI China, India, South Africa and LatAm
Frontier markets add a separate, complementary story. Post-pandemic, many large frontier economies had to float their currencies, tighten monetary policy and cut subsidies to curb deficits. The result is a virtuous cycle of lower risk premium, falling inflation and faster GDP growth, all promoting better capital inflows. These reforms make economies less sensitive to actions from the Fed.
8. Four questions ahead
Will the Fed hike break the capex cycle?
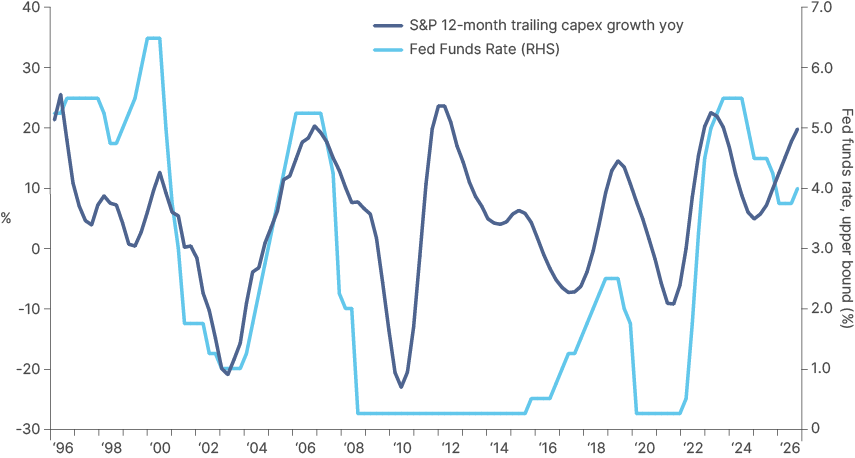
Not for now. Higher policy rates barely change funding costs for the high-quality hyperscalers undertaking the capex today. They do, however, hit lower-rated companies reliant on short-term or floating-rate debt, such as private credit borrowers. Historically, that brings a cyclical slowdown, or a deeper one if a weak link breaks, as depicted in Fig 9. Watch lower-rated neoclouds and leveraged companies such as Oracle as further hikes arrive.
The AI capex growth outlook continues to look robust
Ultimately, the key metric that will make or break the next leg of AI capex, and set its funding costs, is the return on invested capital (ROIC) from current investments. As mentioned, profitability is elevated for now, but this is something market participants are closely monitoring. This is particularly relevant as the huge increase in hyperscaler capex levels is being driven not only by pure capacity expansion but also by the rapid inflation of semiconductor costs, implying potential margin pressure.
Regarding EM funding conditions, in the week after the FOMC, EM investment grade outperformed high yield debt across sovereigns and corporates, but only very modestly, so far. FX losses on local currency debt have been smaller than in prior cycles as EM rates remain resilient.
Fed hikes into a capex boom is the norm
Fig 9: S&P 500 investment growth vs fed funds rate
Will the pacing of AI adoption, and the backlash against data centres, slow the investment cycle?
Possibly, but not yet. Adoption keeps broadening. Token consumption is still growing exponentially. Rental costs for older-generation graphics processing units (GPUs) are still rising. None of this points to an imminent capex air pocket. Politics will likely shape the cycle’s timing and mix more than its size; the real risk is still return on investment.
One key theme to watch is the politics around the mid-term elections. Texas, the fastest-growing data centre market, is the clearest example. Data centres are a central issue in the governor’s race, and Republican governor Greg Abbott has responded to Democratic attacks by turning on the industry himself, promising to end its tax breaks. We do not believe Texas flips; Abbott leads in most polls, though the Senate race is closer. But the backlash is real and bipartisan: 71% of Americans oppose an AI data centre in their local area, according to Gallup.
Regulation is unlikely to derail AI investment, in our view
The important nuance is that the regulatory response to this uproar is shifting from restriction to conditions. Data centres are increasingly required to pay their own grid costs, and some jurisdictions are pushing them to bring additional generation capacity beyond their own requirements, lowering power prices for the surrounding community. Other ‘sweeteners’ for local communities are also on the table, including investment in wider local infrastructure.
These positive externalities have the potential to further encourage the broadening of the investment cycle into generation, grids and storage while defusing political opposition.
Will the SoH shock plus El Niño drive a sharp rise in EM inflation?
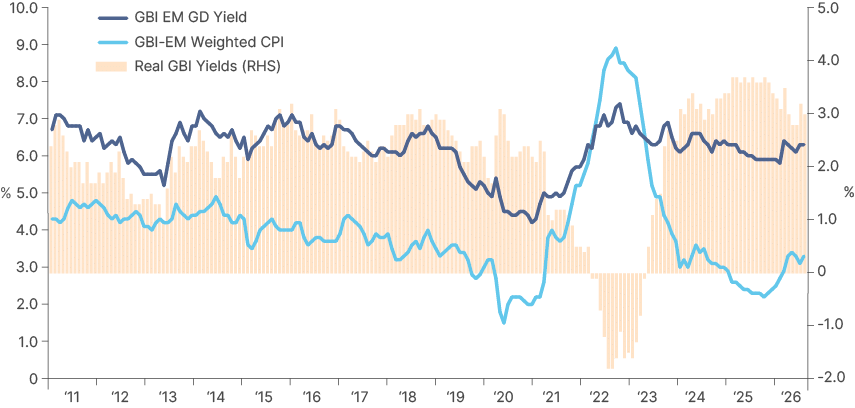
Higher fertiliser prices alongside a super El Niño could push EM food prices up significantly in 2027. Because food is such a large component across EM consumer price index (CPI) baskets, this is a key risk to monitor. But, so far this year, inflation has remained well behaved in EM. Food inflation has been on a downward trend, running below 2% as of August. Real rates in most large EM economies are at their highest levels in 15 years, which helps to anchor core inflation and inflation expectations (Fig 10). As discussed, muted price pressures, particularly in Asia, have also been helped by Chinese disinflation.
El Niño remains a key risk for EM assets
Fig 10: Nominal interest rates vs inflation in the GBI-EM GD (local currency benchmark)
Finally, EM countries are still subsidising diesel and gasoline. This is a fiscal risk to watch, particularly in smaller, more fragile energy importers, but for the moment, the size of the temporary subsidies is unlikely to lead to debt crisis dynamics. Modelling the fiscal impact of current energy prices across benchmark EM and frontier market countries, we find that annualised subsidy costs, or declines in fuel tax revenues from keeping pump prices at current levels, exceed 2% of GDP in Ecuador and Egypt, while only Brazil, India, Thailand, Indonesia and Malaysia face fiscal hits of between 1% and 2% of GDP. This is significant, but it is unlikely that liquid fuel prices will remain at current levels into 2027, given the current state of play in the Gulf, where energy flows are improving meaningfully under US naval support. Countries currently absorbing some or all of the higher energy prices can choose to pass on more of these costs to consumers to limit the fiscal impact should prices keep rising.
Can the large EM economies overcome their fiscal challenges?
Broadly, EM fiscal accounts and debt levels are in much better shape than their DM counterparts. However, there are key outliers. Colombia and Brazil are the critical cases, but Poland, Romania and India all have fiscal work to do. Colombia’s trajectory is inflecting, but it has become clear that the problem runs deeper than was evident under the previous administration. Whoever wins Brazil’s 25 October runoff (likely Flávio Bolsonaro) must overhaul the fiscal framework. Separating reformers from troubled credits will drive EM fixed income alpha over the next 12 months.
Conclusion
The Fed is tightening into an energy shock. This would typically be a strong headwind for EM assets, but so far it has led to only a small correction. Cash flow, rather than credit, largely funds the capex cycle propelling EM earnings. Chinese overcapacity offsets the energy impulse to inflation. USD strength in 2026 has been tepid, despite a very bullish backdrop. All this is why, in our view, the energy shock and the Fed hike will not undermine the solid fundamentals behind EM asset price outperformance, which has been running since 2023 in fixed income and since 2025 in equities.
We believe any USD strength on higher US real yields will provide an entry point. We prefer EM local currency debt, where real yields sit near 15-year highs and currencies have upside. We also favour EM equities over DM, as their outperformance has been driven by earnings rather than multiple expansion. The key risks are that the Fed hikes to the point where the weak links, such as private credit, break, or that a food price shock tests EM central bank credibility.
1. The term ‘Fragile Five’ was coined by Morgan Stanley to group together countries with large external imbalances and ‘expensive’ currencies: Türkiye, Brazil, India, South Africa and Indonesia.