

Short on time? Download the four-page summary.
Introduction
It is widely acknowledged that global asset allocation towards sustainable development remains severely insufficient. This is particularly the case in emerging markets (EM), where the financing need is greatest.
Private equity and private debt are essential financing channels here, especially for projects in countries with underdeveloped capital markets. But private markets alone cannot achieve the scale required to make meaningful inroads towards the United Nations’ Sustainable Development Goals (SDGs). This is where public debt markets come in, and crucially, they do so without asking investors to make concessions on returns.
As the asset class has matured, EM public ‘impact’ debt, across green, social and sustainability bonds has delivered risk-adjusted returns comparable to conventional EM investment grade (IG) credit, while achieving significantly more impact per dollar than in developed markets (DM).
The investable universe is growing quickly and is now deep and broad enough for institutional allocators to deploy across EM regions at scale. Nevertheless, given the relative novelty of the space, active management is still required, in our view. This is true for three reasons: to maximise impact, to maximise financial returns, and to take advantage of opportunities beyond the labelled universe.
1. The need is in EM – and it is capital-intensive
The case for focusing impact allocations to EM is easily made. A total of 1.1 billion people across 109 developing countries still live in multidimensional poverty.1 Developing countries also produced 75% of total carbon emissions in 2023.2 Today, a large share of this is due to the outsourcing of manufacturing of products consumed in DM to EM countries.
The case for focusing impact allocations on EM is easily made…
The SDGs published in 2015 remain the standard framework for identifying sustainable investment needs: 17 goals, 169 targets and more than 230 indicators, agreed by all United Nations (UN) member states and tracked annually. But ambitions to scale capital committed annually into the trillions over the course of the 2020s have, unfortunately, not been met so far. Progress towards achieving the goals has, therefore, been disappointing.
The Sustainable Development Solutions Network scores only 17% of targets as on track for 2030, with none of the broad 17 goals on course.3 To make serious inroads to achieving the goals by 2030, the UN Conference on Trade and Development (UNCTAD) puts the annual investment gap facing developing countries at roughly USD 4trn, around 60% wider than the USD 2.5trn it estimated in 2014 on the eve of the goals’ adoption, as per Fig 1.
…but the annual gap to fund the SDGs is widening
Fig 1: Annual SDG investment gap by theme in EM
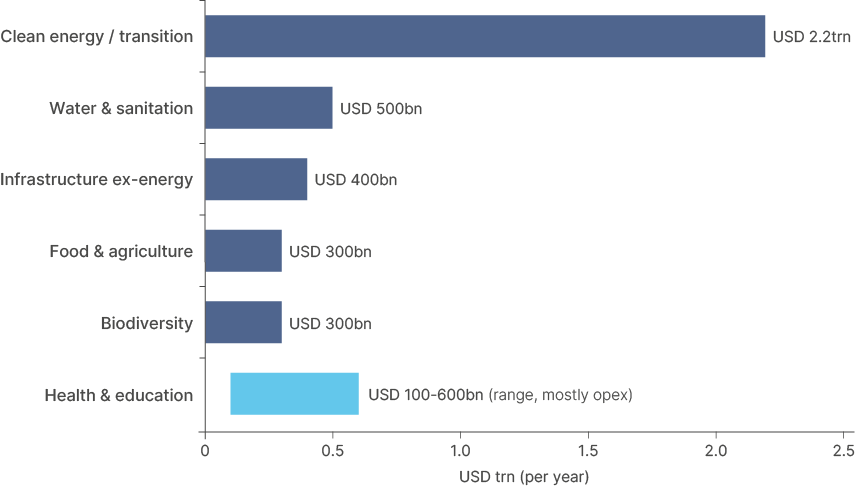
The often-cited USD 4trn investment gap figure is best read as an aggregation of EM-wide estimates from specialist sectoral agencies, rather than as a sum of regional needs. The key takeaway, other than the sheer scale of number, is that most of the financing gap sits in highly capital-intensive sectors – energy, water and sanitation, and other infrastructure.
The cost of the individual projects required to meet these needs sits in hundreds of millions or billions of dollars. Scaling private funding to these levels for individual projects is difficult, which is why public debt is such an important avenue for capital deployment. The coupon is paid from predictable cash flows over long asset lives, with transparency and strong governance structures servicing the bonds.
Public debt can fund the capital-intensive projects required
2. Funding need by region
UNCTAD gives no regional breakdown, but gaining an idea of one is still useful. For that we turn to the International Monetary Fund (IMF), which builds country level needs from the bottom up, via a different framework. Instead of trying to estimate how much money is needed annually to ‘achieve’ the SDGs, it totals the gap between each country and leading peers at similar GDP per capita across health, education, water and sanitation, electricity access and roads.
UNCTAD explains what must be built and in what proportions; the IMF highlights where the need sits, and how large relative to the economy carrying it. China is the largest need in USD terms, but Sub-Saharan Africa (SSA), South Asia and Middle East and North Africa (MENA) are highest as a share of their own GDP, as per Figs 2 and 3. A key nuance is that UNCTAD’s USD 2.2trn energy line has no counterpart in the IMF framework: the electricity figure covers connecting people who have no power, not decarbonising supply.
The largest funding need in EM ex-China is in Sub-Saharan Africa…
…with South Asia a close second
Fig 2: Regional split of the EM SDG spending need – USD 3.8trn per year
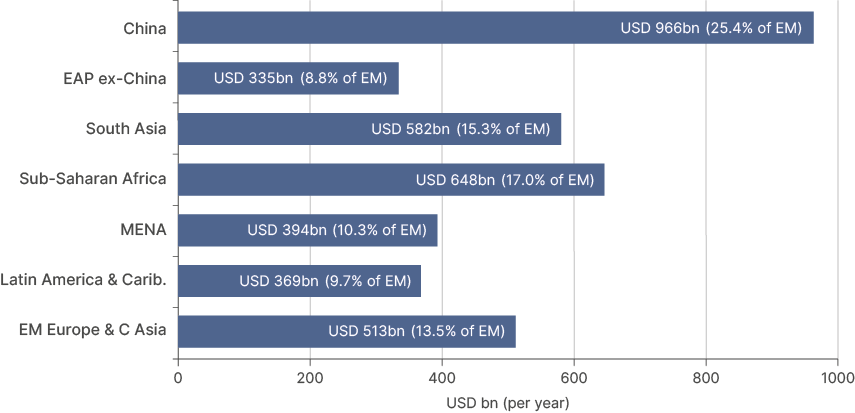
Fig 3: Spending needs by EM region and sector (% of GDP)
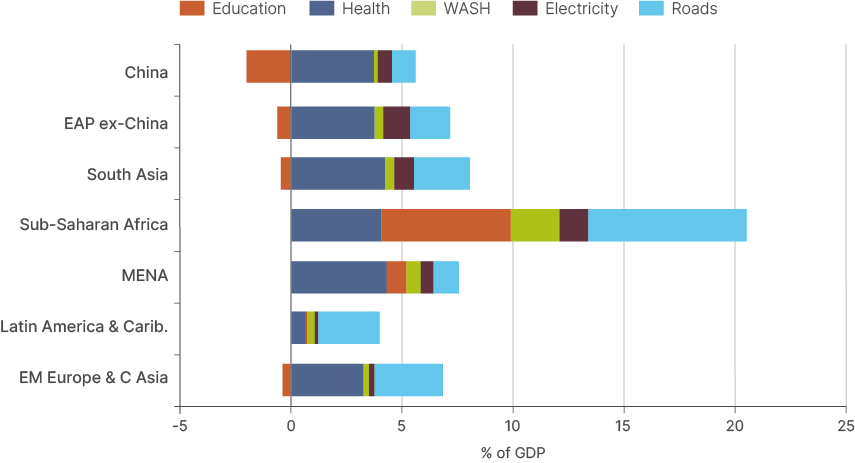
Similarly to UNCTAD, the IMF shows there is no equivalent DM funding problem. The additional annual cost for the average DM economy in reaching best-in-class levels across those five sectors averages under 0.2% of their 2030 GDP.
While a diversified EM impact fund will invest across all these regions, higher-income EM countries such as China require proportionally much less external financing to meet their development goals. Naturally, the need for external financing tends to be inversely correlated with each country’s wealth, which is why actively managed EM-focused impact funds should focus on directing as much capital as possible towards countries where the need is most acute, to maximise impact.
Poorer countries need disproportionately more external financing for the SDGs
3. Impact per dollar is much higher in EM
In our view, each USD allocated to EM generates 2x-20x the impact of the same allocation in DM, depending on the metric measured. In the energy sector, most EM clean-energy projects are displacing coal and oil, while DM displaces gas, which emits about half as much per kilowatt-hour. That gives roughly 2x avoided emissions per USD, as per Fig 4. Funding renewable energy in previously fossil-fuel dominated grids explains why EMs account for 99% of the top-performing green bonds globally on emissions avoided (those above 1,000 tonnes of CO2e per USD million invested).4 The benefit is also greater in terms of underserved beneficiaries reached and jobs created per USD invested. The statistics indicate that the marginal impact of each USD tends to increase as the level of development declines.
Per dollar invested, the impact in EM is much higher than in DM
Fig 4: Impact delivered on selected themes (EM vs DM)
| Metric | EM multiple vs DM |
|---|---|
| Avoided emissions, renewables | 2x |
| Clean transport passenger-km | 8x |
| Underserved beneficiaries reached | 10-11x |
| Jobs created | >20x |
4. An under-allocation
Despite the obvious need for most impact funding to flow to emerging markets, impact allocations today skew heavily to developed markets. The Global Impact Investing Network (GIIN) sees 33% of global impact assets under management (AUM) allocated to the US and Canada, 25% to Europe, and roughly 40% to EM. Of that: about 20% is allocated to Asia, 12% to Africa and 8% to Latin America.
Impact funds remain over-allocated to developed markets
Fig 5: Share of impact AUM by region of investment
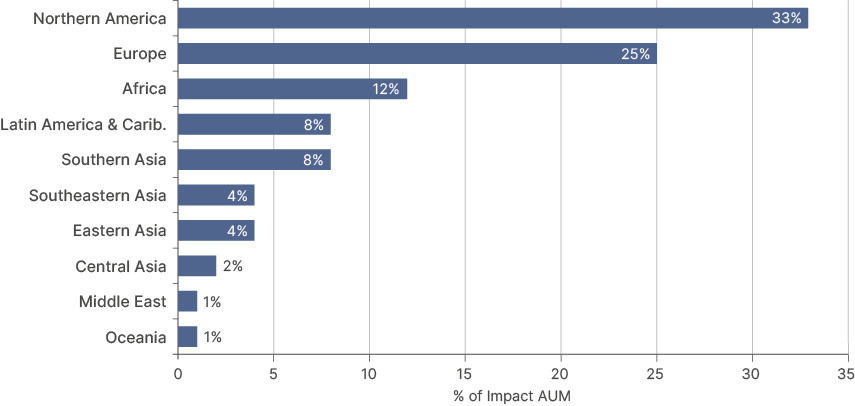
The same report shows that two-thirds of investors responding to the GIIN survey do not expect to increase their EM allocations. This not only means investors are misdirecting capital in terms of where it is needed, but they are also leaving significant impact per dollar on the table.
The funding shortage is also being felt on the ground. UNCTAD’s recent World Investment Report shows investment in greenfield projects in SDG-relevant sectors across EM is falling well short of requirements and is not scaling, as evidenced in Fig 6.
Annual investment in greenfield SDG projects is stalling…
Fig 6: Announced greenfield project values, developing economies (USD bn)
| Sector | 2023 | 2024 | 2025 | |||
|---|---|---|---|---|---|---|
| Renewable energy | 204.8 | (71%) | 109.5 | (52%) | 54.8 | (24%) |
| Telecommunications | 48.3 | (17%) | 65.3 | (31%) | 123.5 | (53%) |
| Food & agriculture | 17.2 | (6%) | 15.7 | (8%) | 27.1 | (12%) |
| Health | 9.0 | (3%) | 11.0 | (5%) | 12.8 | (6%) |
| Power (ex-renewables) | 7.0 | (2%) | 4.7 | (2%) | 6.8 | (3%) |
| Water, sanitation & hygiene | 1.4 | (0%) | 1.5 | (1%) | 6.6 | (3%) |
| Education | 1.0 | (0%) | 1.2 | (1%) | 1.2 | (1%) |
| Total | 288.7 | 208.9 | 232.8 | |||
Source: UNCTAD, World Investment Report 2026, Table I.9 (data from fDi Markets). Shares of annual total in brackets, own calculation. Announced projects, not realised flows.
5. Public EM bonds are the most scalable avenue
To grow the pool of impact-oriented capital directed to emerging markets, the scalability of public debt markets must be leveraged. Scalability here means two things. The instruments already exist, are priced daily and can be bought in size without being originated, structured and closed. Therefore, capital can be put to work in days or weeks rather than over a fund’s investment period. Moreover, where demand runs ahead of the paper available, issuance responds: the underlying projects are capital-intensive, cash-generative and run by issuers that already carry balance sheets, credit ratings and disclosure obligations, meaning a bankable programme can come to market in benchmark size quickly. What has constrained EM impact issuance is the depth of the buyer base, not the supply of things to finance.
While growth in overall impact investment towards SDGs has slowed in the last two years, the outstanding value of labelled EM impact bonds (green, social, sustainable and sustainability-linked) has grown to USD 784bn, with annual issuance reaching over USD 100bn since 2021, and closer to USD 200bn a year since 2023.5 Beyond labelled debt, we find the universe includes more than USD 100bn from issuers whose business model contributes directly to the SDGs. Around 76% of the universe is investment grade and it is roughly twice the size of the European high yield market.6
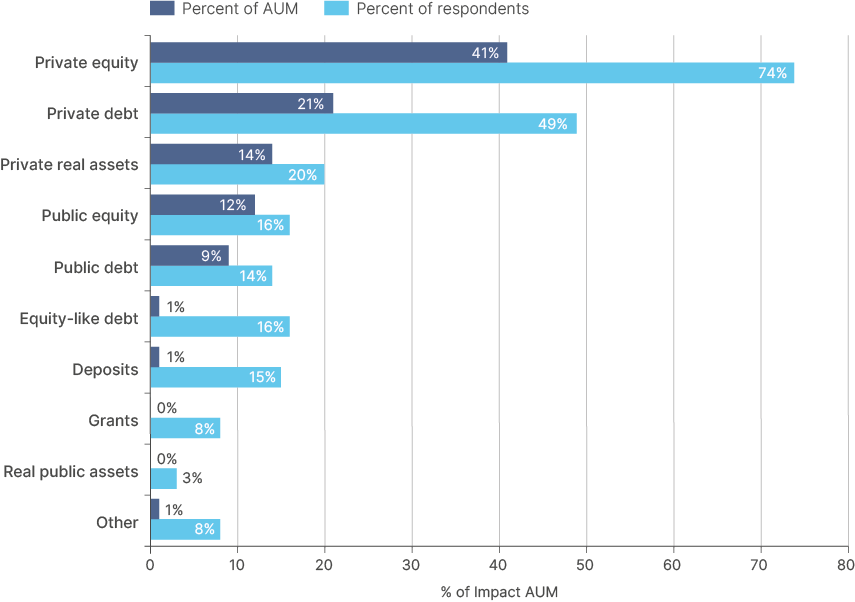
Despite its growing scale, allocation to public debt by dedicated impact investors remains small. Private equity accounts for 41% of impact AUM, with private debt accounting for a further 21%. By contrast, public debt and equity combined represents just 21%, as per Fig 7.
Public debt is the most scalable avenue for impact funding in EM…
…but impact funds’ AUM remains heavily skewed towards private assets
Fig 7: Impact AUM by asset class (n=359 investors, USD 218.3bn)
We reiterate, public debt does not replace the other channels; each performs a distinct function. Private equity and private debt can originate transactions that would otherwise not exist, reaching companies that might not have market access at all. Their impact per dollar is often the highest available. But achieving true scale through private markets is difficult. Private companies tend to simply be smaller and capital moves deal by deal, at the speed at which transactions can be found, structured and closed.
Concessional and blended finance remain essential in mobilising commercial capital into places it might not otherwise reach. But equally, it is limited by how much subsidy exists to make the economics work, and those budgets are unfortunately shrinking rather than growing, both on a government and supranational level.
Private impact investment is important, but scale is constrained
Public debt is the channel where capital deployment is not origination-constrained and the assets behind the paper are capital-intensive, profitable projects concentrated in areas with the greatest funding gaps. Governance, reporting and disclosure are already built around the instrument, and the coupon has to be paid whatever the sustainability narrative says. In other words, it is not an asset class that asks for goodwill from the investor – it delivers reliable market rate returns and impact together.
6. Risk-adjusted returns: no concession required
The question of whether allocators should sacrifice return to achieve positive sustainable impact is still widely debated. Recent trends show that the appetite to do so is limited. In this context, it is key to emphasise that EM public impact debt does not ask investors to make concessions or third parties to provide underwriting. An allocator moving from conventional EM IG credit into EM impact debt is not funding a concession; they are changing what their existing risk budget finances while targeting the same returns and volatility. This attribute of public EM impact debt is fundamental to its scalability.
Since inception of the impact index, the JP Morgan Green, Social and Sustainability Bond EM Credit Diversified Index (GESSIE EM CD) has marginally outperformed broad EM corporate IG debt (CEMBI IG) as per Fig 8.
Fig 8: Global Corporate IG vs GESSIE EM CD vs CEMBI IG returns
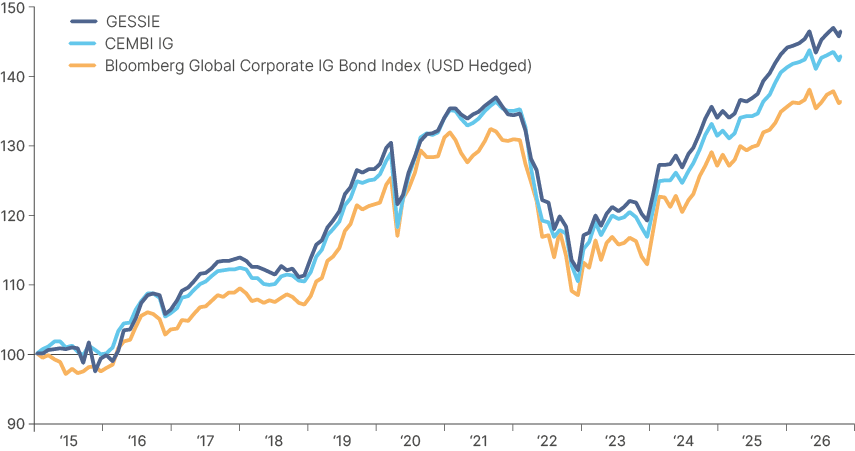
Monthly returns have had a correlation of 0.97, with almost identical annualised volatility. Still, the GESSIE EM CD narrowly outperforms CEMBI IG in 67% of rolling three-year windows and 78% of rolling five-year windows, by an average of 23bps and 17bps, respectively. Both indices have outperformed developed market corporate investment grade over the period.
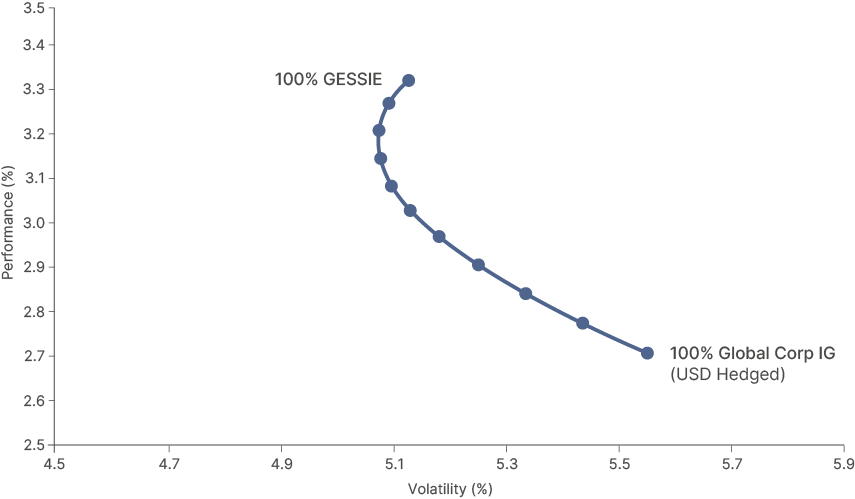
For global bond investors, adding an EM corporate IG allocation has historically improved the efficient frontier of risk-adjusted returns materially. Given the close similarity of the GESSIE EM CD and broad EM corporate IG debt, this is true for sustainable bonds too. Fig 9 shows the effect on the efficient frontier of adding GESSIE EM CD exposure to a Global Corporate IG portfolio. The diversification benefit is real, with EM corporate IG benefiting in the last 10 years from not just higher carry but also lower duration – making it a better performing asset class in a rising rate environment.
Public sustainable debt in EM not only offers impact with no return concession…
…it materially improves risk-adjusted returns
Fig 9: Global Corporate IG (USD Hedged) vs GESSIE EM CD: Efficient Frontier
7. Go active to maximise impact and risk-adjusted returns
In our view, active management is key in the EM public impact debt universe, first and foremost, to filtering out companies and bond issues that do not generate real positive impact at the margin. About a quarter of ICMA-aligned impact bonds fail Ashmore’s impact assessment.7 In general, there are three common reasons for failure: (a) proceeds are not reaching green projects; (b) corporate incoherence, such as where a bond greens the headquarters while the issuer expands its coal activities; and (c) harm in delivery, including using forced labour on green building projects.
Active management is key to maximise both returns and impact
Furthermore, the labelled universe alone doesn’t fully capture the shape of the opportunity, or the needs. A labelled use-of-proceeds bond requires discrete projects to fill a USD 300-500m deal. Smaller issuers with two or three bonds on the curve may be unable to do that and instead need general-corporate-purpose financing, even where 70-90% of the business contributes to the SDGs. Frequently too, larger issuers issue debt for SDG-aligned projects but choose not to take the sustainable labelling route. This means there is a sizeable opportunity to invest in companies funding the SDGs through bonds which do not carry a sustainability label. In our view, there is also an opportunity for impact generation via investment in issuers which are moving their business models decisively towards SDG alignment.
Rigorous fundamental assessment of issuers is also essential, as financial viability drives both returns and impact. A well-intentioned project inside a badly run company can still fail. The requirement to service a market-rate coupon is not a constraint on impact – it is a filter for impact that survives. Capex-without-opex projects, a classic route for development finance failure, cannot service a coupon. Market-rate discipline works to screen these projects out ex ante.
8. Additionality in EM public markets
The standard objection to impact in public markets concerns additionality: the bond would have been issued anyway, one buyer is much like another, and nothing in the real world changes because we owned it. That objection is another reason why impact capital sits predominantly in private markets. However, as outlined by the UK Foreign, Commonwealth and Development Office, there are four clear avenues for additionality in public markets.8
Additionality in public markets is real and strongest lower down the liquidity curve
- Financial additionality at the point of issue: Primary participation is the cleanest case. Anchoring a transaction that would otherwise struggle to clear is additional in the same sense as a private investment. Further, deeper demand brings issuance, issuance builds the universe, and a larger universe draws the next allocator in. Dedicated impact capital does not only finance these markets, but also develops them.
- Liquidity provision in the secondary market: In low-liquidity environments, a consistent price-forming buyer can narrow spreads, improve price discovery and raise the confidence of commercial investors. Financial additionality is therefore not confined to primary markets, particularly where market makers are absent.
- Information: Backing issuers, structures and countries that are new to the market generates information. Aftermarket trading and disclosure informs whether that issuer, segment or country is investable. MOBILIST calls this “originate-to-demonstrate” and argues that it may be the most scalable route to impact of all.9
- Engagement: The refinancing lever. An issuer that will return to the market has reason to listen, and that holds for unlabelled instruments as much as labelled ones.
Broadly, the additionality objection weakens as one moves down the liquidity curve. In large, liquid, well-regulated markets, a socially neutral buyer is replaced almost immediately. In smaller emerging markets and developing economies, where scale, liquidity, regulation and information quality are all thinner, the marginal buyer is not replaced automatically.
Summary & Conclusion
We continue to make the point that global sustainability funding needs are overwhelmingly concentrated in emerging markets – most intuitively understand this. Most also understand that private capital has a crucial role to play in funding impactful investment in these regions, particularly at a time when most governments globally have very little fiscal headroom.
But what intuition and common knowledge often get wrong is an assumption that impact investment must mean sacrificing returns, liquidity or transparency. While impact investment in private companies does represent somewhat of a specialist area, impact investment via public debt markets does not.
The investable universe is large and liquid, and has consistently delivered stable returns very closely comparable to emerging market IG corporate debt. Each dollar deployed into the asset class can achieve measurably more impact than in developed markets and active managers can work to maximise both financial returns and impact generated, by focusing on the most viable projects.
Now is the time to scale institutional capital into this opportunity. For sustainability-minded fixed income allocators, in our view, it is close to a no-brainer.
1. UNDP and OPHI, Global Multidimensional Poverty Index 2025: Overlapping Hardships – Poverty and Climate Hazards (October 2025). 1.1 billion people, 18.3% of the population of the 109 countries covered.
2. Own calculation from EDGAR (JRC), GHG Emissions of All World Countries, 2025 report; developing countries on a non-Annex I basis.
3. UN: The Sustainable Development Goals Report 2025 - …
4. ClimateAligned (powered by Arctal) analysis of issuer impact reporting across the global labelled green bond universe, 2024.
5. As at 31 December 2025 – Amundi Asset Management (Amundi) and International Finance Corporation (IFC). June 2026.
6. Ashmore Group, based on Bloomberg and JP Morgan index data at July 2026.
7. Ashmore Group impact assessment framework applied to the ICMA-aligned universe, 2025.
8. Source: MOBILIST (UK Foreign, Commonwealth and Development Office), Investing with Impact in EMDE Public Markets: The Importance of Additionality, 2025.
9. MOBILIST (UK Foreign, Commonwealth and Development Office), originate-to-demonstrate.