Global oil markets experienced a bullish run towards the USD 100 per barrel level. High oil prices and increased supply of US Treasury (UST) bonds led to a strong sell-off in rates. Chinese economic data was better than consensus before the Full Moon Festival holiday this week. The Bank of Thailand increased rates by 25bps to 2.50%. The US government avoided a shutdown, with Republican Speaker Kevin McCarthy relying on the support of the Democrats for the bill to pass. The short-term deal will extend until 17 November.
Global Macro
A Brief Q3 2023 Performance Review & Outlook
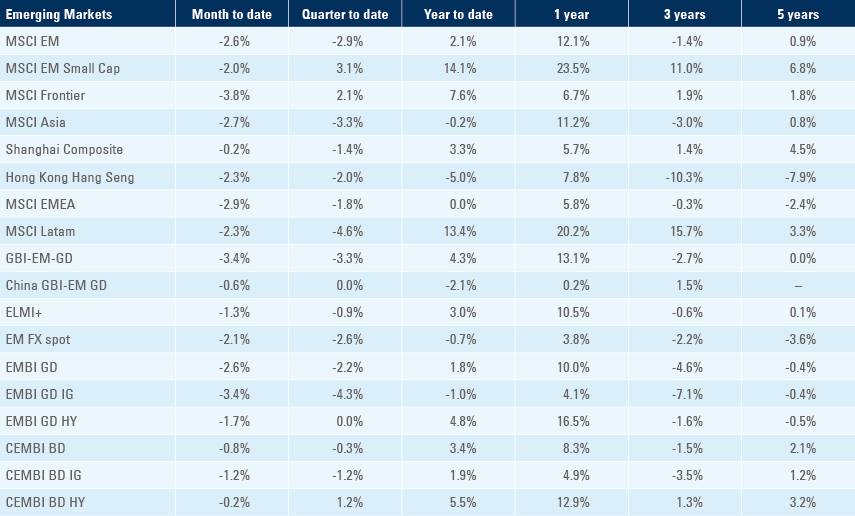
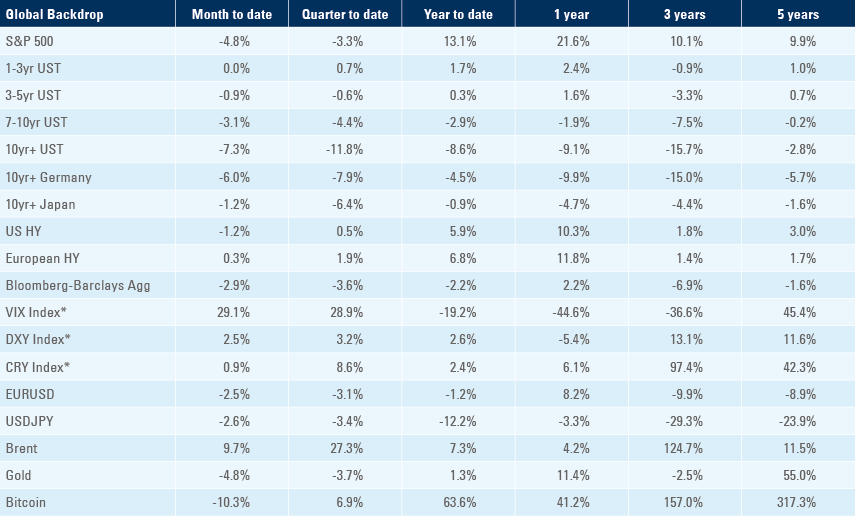
Global stocks performed well in July but rolled over in August and September as the MSCI ACWI Index declined 3.3% over the quarter, in line with the S&P500. Overall, MSCI Developed Markets (DM) were down 3.4% and Emerging Markets (EM) marginally outperformed, down 2.9%.
The equity sell-off was primarily driven by a sharp rally in oil prices (Brent +27.3%), which alongside the announcement of large UST auctions led to a strong UST sell-off as yields on 10-year bonds rose 73bps to 4.62% over the period, the highest level since Q1 2007. The Bloomberg Global Agg. was down 3.6%.
The Dollar Index rose 3.2% as US rates widened more than other EM and DM countries. On the fundamental side, the US economy’s resilience contrasting with weaker European activity and the Bank of Japan’s unwillingness to exit its negative interest rate policy explains the stronger greenback.
EM fixed income outperformed in the quarter but was still negative driven by wider USTs and a stronger US dollar. EM sovereign bonds were down 2.2% with investment grade (IG) -4.3% and high yield (HY) flat. EM corporate debt declined 0.3% with IG -1.2% and HY +1.2%. EM local bonds declined 3.3% as EM currencies sold off by 2.6%.
The move in UST was driven by speculative flows with hedge funds and CTA’s paying rates (betting that interest rates will widen) as US investors and Japanese investors kept adding exposure during the quarter. Fundamentally, the positioning was supported by three factors: higher oil prices, stronger-than-expected economic activity in the US (and to some extent, China) and a much larger issuance of USTs.
On a forward-looking basis, global yields are to decline, in our view. The US economy is likely to slowdown from here, in line with leading and continuing indicators already pointing towards softer activity. Activity risks are also skewed to the downside due to United Auto Workers union strikes, the resumption of the repayment of student debt loans and other factors driving the fiscal deficit to a lower level in the US, whereas it is clear that no fiscal policy ‘bazooka’ should be expected from China.1 Furthermore, the lagged impact of the large increase of global interest rates is sure to add downward pressure on the economy while it significantly increases the risk of financial system ‘accidents’.
Lastly, the duration and magnitude of the current sell-off in UST has been unprecedented. Specifically, should the performance of UST bonds be unchanged (requiring rates moving higher) by year-end, it will be the first time since 04 July 1776 that this market will have sold off for three consecutive years.
The speed of decline in global yields will be very important for other asset classes, in our view. Several corners of the global capital markets are pricing an elevated likelihood of a ‘no landing’ scenario. Pricing an economic ‘soft-landing’ should lead to an orderly decline in yields, a weaker US dollar, which would be supportive for global equities and EM assets outperformance. On the other hand, if an accident leads the market to price a sudden ‘hard landing’, yields should rally faster, and volatility is likely to increase.
The ‘should’ is intended. The key question is how the US government would react to an eventual ‘hard landing’. If the answer is more fiscal expansion, this would put upward pressure on yields and very strong downward pressure on the Dollar. This ‘dollar debasement’ scenario wouldn’t be a pretty picture, but it is a scenario investors ought to consider, in our view. After a few weeks of heightened volatility, the ‘dollar debasement’ scenario would likely lead to a very fast reallocation of capital away from the US (both equities and fixed income).
In sum, the near-term ‘base case’ scenario migrating from ‘no-landing’ to ‘soft-landing’ should be negative for the Dollar and positive for EM assets. Staying in the ‘no-landing’ sphere remains a risk, albeit its likelihood has significantly declined, and the ‘hard landing’ risk increased after the recent moves in oil, USTs, and the Dollar, with the former needed for higher yields from here and the latter implying yields declining much faster, but also coming together with higher volatility.
Commodities
A fundamental component of the widening in global interest rates has been the fear of inflationary pressure re-emerging now that goods disinflation has largely played out. Policymakers are in data-dependent mode and several of them (including Federal Reserve (Fed) Chair Jay Powell as per its September statement) are wondering whether rising oil prices can create further inflationary shocks. How did oil prices rise to the current levels?
During the summer, the market consensus shifted from debating between a soft vs. hard landing of the economy towards a greater likelihood that the economy may not land at all. Commodity traders have since added exposure to oil futures, fuelling a bullish run in crude, further spurred by changes in both supply and demand fundamentals. The Brent first future contract rose 27.3% last quarter, pushing it close to the psychological important USD 100 per barrel level.
Voluntary production cuts from Saudi Arabia (and to a lesser extent Russia) placed the market into undersupplied territory. Morgan Stanley estimates supply is down by 1 million barrels per day (mb/d), broadly matching the OPEC production decline (28.5 mb/d to 27.5 mb/d), driven by Saudi production falling from 10.1 mb/d in Q2, to 9 mb/d in Q3.2 Beyond OPEC, Russia cut crude output by an additional 0.3 mb/d. These voluntary cuts were then extended in early September to remain in place until the year-end, a move which ultimately decreases Saudi Arabia’s share of global oil production, which they may likely want to reclaim in 2024.
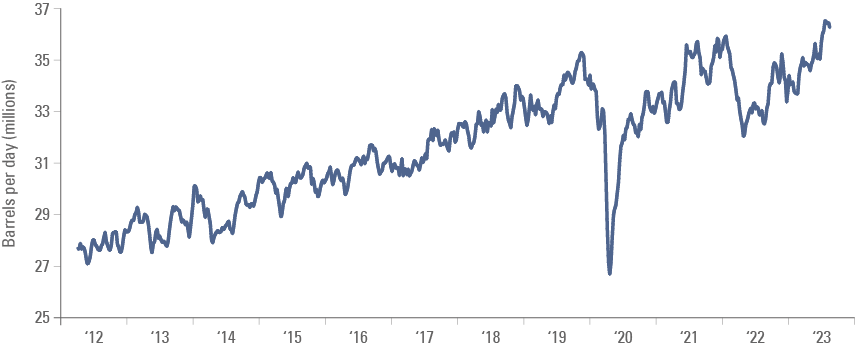
Demand side projections highlighted rising global demand levels as HSBC projects an average global demand of 103 mb/d in Q3 2023.3 The International Energy Agency highlighted demand was boosted by solid summer air travel, oil use in power generation, and Chinese petrochemical activity. Indeed, data from the US and China, the two largest oil consumers in the world, highlights demand has been increasing since Q3 2022 and hit an all-time-high level this summer as per Fig. 1. In July, Chinese oil demand reached an all-time high of 16.7 mb/d. A significant contribution to which has been the post-Covid monetary, macroprudential and quasi-fiscal stimulus stimulating the economy and driving crude consumption.
Fig 1: China + US Oil Demand (mbpd) 20d MA
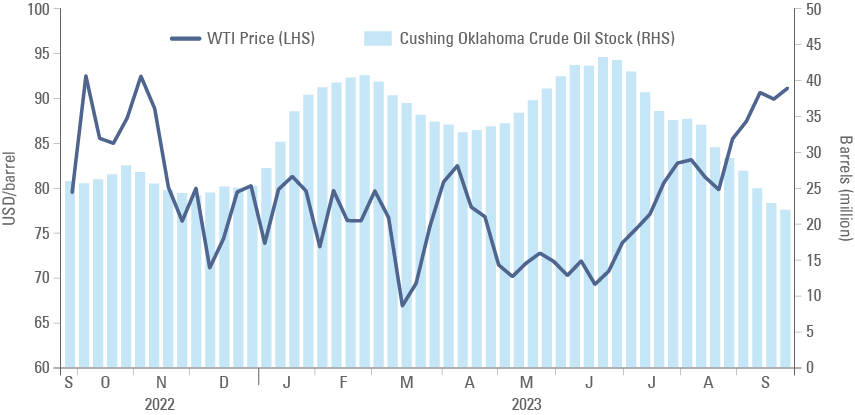
Tighter supply and larger demand are meeting inventories at increasingly depleted levels. In the US, the 300 million barrel drawdowns from the Strategic Petroleum Reserve (SPR) have not been replenished as per Fig.2. More recently, non-SPR stocks have also been significantly depleted. Fig 2 illustrates how inventories from the NYMEX delivery point at Cushing, Oklahoma have declined since the last week of June. Albeit Cushing, Oklahoma is only part of the overall US capacity, it still demonstrates the tightness of supply across the broader country.
Fig 2: US Non-SPR Reserves (inverted) (mb) vs. 12-month Brent Future ($/b)
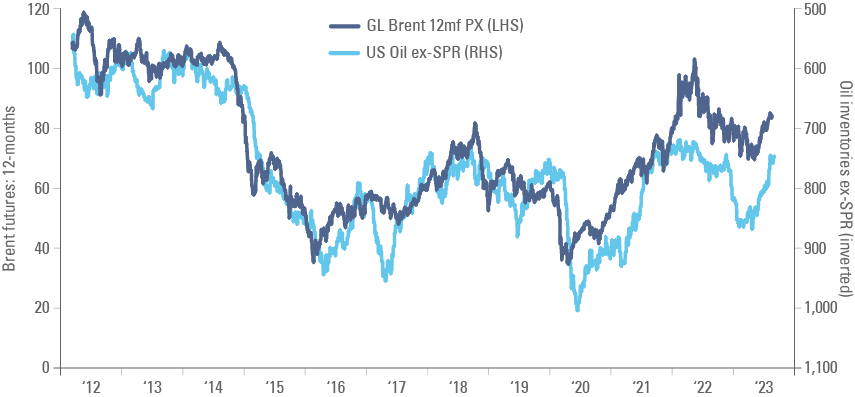
Fig 3: WTI Price and Cushing, Oklahoma Inventory
Looking towards the end of the year and into 2024, it is difficult to see the same dynamics that drove Brent towards USD 100 per barrel remaining so vehement; meaning an easing (not a reversal) may bring Brent prices below these elevated levels. Certain demand drivers witnessed this past quarter are broadly cyclical and will naturally drop off. For example, a slowdown in gasoline demand due to the end of the summer ‘driving season’ in the US as well as weaker domestic air travel demand and a stabilisation on Chinese demand in Q4 2023 vs Q3 2023.4
Alongside the expected is the unknown: will higher-for-longer rates filter through to the US consumer in a manner different to the current, more optimistic narrative, impacting personal and commercial demand? On the supply side, the extended cuts from Saudia Arabia are not necessarily going to persist beyond Q4, as it may want to reclaim the market share it has voluntarily forgone and utilise higher prices, pushing production back to their official OPEC quota in 2024.5 This addition of around 1 mb/d to the global market will help ease a large portion of the tightness that has driven the bullish run we have experienced. Given these potential headwinds, it seems the market may be overstretched at these levels, but we are unlikely to return to prices seen in Q2 2023. The recent rally would have likely already discounted many of these factors, and as such, provides a safety net for prices not to decrease significantly as they crystalise, but places greater emphasis on the idiosyncratic factors highlighted for our driver of delta.
EM Asia
China: Economic activity corroborated our view that there is a disconnect between sentiment and economic activity in China. Both the manufacturing and non-manufacturing purchasing managers’ indices (PMIs) rose above consensus in September to 50.2 and 51.7, respectively, from 49.7 and 51.0 in August. Industrial profits increased 17.2% yoy in August, up from -6.7% in July. The share of Swift global payments in RMB was 3.5% in August, up from 3.1% in July, the highest level and nearly twice the average over the last 10 years. Swift is a messaging system to communicate international trade invoices and the rising share of RMB (now at par with the JPY) illustrates the higher role of the local Chinese currency in settlement of trade flows. Chinese markets are closed the entire week for the Mid-Autum Festival, the most important holiday in the country together with the Chinese New Year. The holidays are likely to bring an increase in travel around the country. In other news, the Chairman of Evergrande Group, Hui Ka Yan, has been put under police surveillance, with the company stating he will be “subject to mandatory measures in accordance with the law due to suspicion of illegal crimes”.
India: The current account balance was USD -9.20bn in Q2, USD 0.3bn lower than expectations, down from a balance of USD -1.30bn in Q1.
South Korea: Consumer confidence fell to 99.7 in September, from 103.1 in August.
Thailand: The Bank of Thailand increased its policy rate by 25bps to 2.50%, while consensus expectations had it unchanged as 10 out of 21 economists surveyed by Bloomberg expected a 25bps hike. This brings the policy rate to its highest level since November 2013. Following the eighth consecutive 25bps hike, the central bank signalled rates do not need to go higher from here, stating the rate is “appropriate for supporting long-term sustainable growth”. This comes after the removal of decisions being “gradual and measured” in the August statement. Looking to 2024, upside risks to inflation still exist; the government’s expansionary fiscal policy will support consumer demand, and the uncertain impact El Niño may have on the agriculture industry. In other news, the current account balance was USD 401m in August, below the expected figure of USD 660m, although up from the revised July figure of USD -508m.
Vietnam: Consumer price index (CPI) inflation increased 70bps in September to 3.66% yoy, 46bps above expectations. GDP grew 5.33% yoy in Q3, 33bps above expectations, up from 4.14% yoy growth in Q2.
Latin America
Argentina: The Economic Activity Index for July was -1.3% yoy, 250bps above expectations, up from a revised figure of -4.7% yoy in June.
Brazil: The current account balance for August was USD -778m, beating expectations of USD -1750m, up from a revised July figure of USD -4032m. IBGE inflation increased 5.00% yoy in September, 2bps below expectations, up 76bps from August. IGPM rose to -6.0% yoy in September, from -7.2% in August, in line with consensus. Unemployment for August was in line with expectations at 7.8%, down 10bps from July.
Chile: Unemployment for increased 20bps in August to 9.0%, 10bps above expectations. Total copper production increased to 434,206 megatons (Mt) in August, from 434,089Mt in July. Retail sales decreased -9.1% yoy in August. Manufacturing production increased 0.5% yoy in August, from a decrease of -1.7% in July, beating expectations by 450bps.
Colombia: National unemployment fell to 9.3% in August, down from 9.6% in July. Better-than-expected unemployment and higher inflation explains why the central bank decided to keep its policy rate unchanged at 13.25%, even though two out of seven members of the committee voted for a 25bps cut.
Mexico: The trade deficit fell in August to USD 1.38bn, from USD 0.88bn in July, below expectations at USD 1.1bn. Unemployment declined by 10bps to 3.0% in August, beating expectations by 20bps. The overnight rate was left unchanged at 11.25%, in line with expectations.
Central and Eastern Europe
Czechia: The repurchase rate was left unchanged at 7.00%, in line with expectations. GDP decreased by -0.6% yoy in Q2, 20bps below expectations and 10bps below the final Q1 figure.
Hungary: The central bank rate was held at 13.0%, in line with expectations. Price producer index (PPI) inflation for August was -2.3% yoy, down from a July figure of 1.3%. The repurchase rate was held at 7.00%, in line with expectations.
Poland: The unemployment rate for August remained unchanged at 5.0%, in line with expectations. Preliminary CPI inflation increased 8.2% yoy in September, 30bps below expectations, down from 10.1% in August.
Russia: Industrial production for August was 5.4%, 90bps above expectations, up 50bps from July.
Central Asia, Middle East, and Africa:
Saudi Arabia: The unemployment rate fell 20bps in Q2 to 8.3%.
South Africa: PPI inflation rose 4.3% yoy in August, 60bps above expectations, up from a growth of 2.7% in July. The trade balance for August was ZAR 13.3bn, above expectations of ZAR 8.0bn, down from a revised July figure of ZAR 15.4bn. M3 money supply rose 8.52% yoy in August, below July’s growth of 9.30% yoy, and 53bps below expectations.
Türkiye: The trade balance for August beat expectations at USD -8.66bn, against a surveyed figure of USD -8.90bn, this is up from a revised July figure of USD -12.30bn.
Developed Markets
United States: The US government avoided a shutdown by agreeing a short-term funding deal that ensures funding until 17 November. The last-minute bill came as a blow to many House Republicans, particularly to a small cohort of right-wing Republicans (90 voted against) who demanded spending cuts and no aid for Ukraine. In a small victory for the hard-liners however, the bill passed has no aid. Speaker McCarthy, who was reluctant to rely on the support of Democrats to approve the bill in Congress, will now likely face further problems from more hard-line Republican members of the House. Florida Congressman Matt Gaetz has already stated that Speaker McCarthy is “on some tenuous ground”.
The short-term rollover means the risk of a government shutdown remains on the horizon. JPMorgan estimates suggest a 10bps reduction in GDP growth per week of shutdown, but given the retrospective pay federal employees receive, this impact does not normally persist.
Last week’s economic data surprised to the downside overall:
- The FHFA house price index increased by 0.8% mom in September after rising 0.4% mom in August, 40bps above consensus.
- New home sales declined by 64k to 675k in August, 23k below consensus.
- Conference Board Consumer Confidence index declined by 5.7 points to 103.0 in September, 2.5 points below expectations.
- The Richmond Fed Manufacturing index rose to 5 in September from -7 in August, signalling a potential reversal from a long downside trend on the indicator.
- Durable goods orders (preliminary) rose 0.2% mom, 70bps above expectations, after contracting 5.6% in July.
- Initial jobless claims rose by 2k to 204k for the week to 23 September, while continuing claims rose by 12k to 1670k in the prior week, both slightly below consensus.
- Pending home sales decreased -7.1% mom in August, below an expected value of -1.0%, down from a revised increase of 0.5% in July.
- Q2 real GDP growth was left unchanged at 2.1%.
Eurozone: French inflation came in softer than expected (4.9% yoy, 20bps below expectations). The European Union’s harmonised CPI inflation dropped 0.6% mom in September from +1.1% mom in August, as the yoy rate declined by 10bps to 5.6%, 30bps below consensus.
United Kingdom: Q2 real GDP growth was 0.6% yoy, 20bps above expectations. Mortgage approvals for August were 45.4k, 2k below expectations, down from a revised July figure of 49.5k.
Japan: Preliminary industrial production for August was -3.8% yoy, 80bps above expectations, down from a July figure of -2.3%. Tokyo CPI inflation for September was 2.8%, 10bps above expectations, but unchanged from August.
1. See – https://blinks.bloomberg.com/news/stories/S1EDJ2T1UM0W
2. See – https://ny.matrix.ms.com/eqr/article/webapp/9a887ebe-5645-11ee-9962-d7dfd30f55a5?native=false&ch=rpint
3. See – https://www.research.hsbc.com/R/10/ZNp9kqgOFieG
4. See – https://markets.jpmorgan.com/research/email/scx/k1foijp0/88tG4SU-sJ48YPM-TDd4QQ/GPS-4510542-0
5. “Tighter-for-Longer, but OPEC Holds the Key”, Morgan Stanley, 20 September2023.
Benchmark performance