
China has the world’s second largest economy, and the country’s rise to prominence has been rapid. This has triggered some investors to consider China and Emerging Markets (EM) ex-China separately, similar to other dominant global powers like the US and Japan. Such an approach provides greater flexibility, whilst not detracting from an investable universe rich in companies underpinned by structural growth tailwinds.
In this paper we discuss:
- China’s structural dominance
- Characteristics of the EM ex-China universe
- Diversification implications
- The rich investment opportunity
Section 1
China’s structural dominance
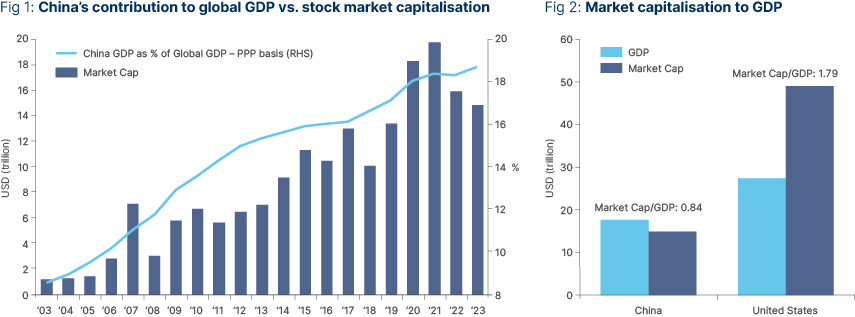
China’s economic and geopolitical significance in the modern era began to emerge in 1978 when the Chinese Communist Party targeted economic growth through foreign capital and an emphasis on technological development. The abandonment of decades of isolation was extraordinarily successful as more than 800 million individuals were lifted out of poverty and the Chinese economy grew on average by 9.1% per annum over the four-decade period ending in 2023. Today, China is the world’s second largest economy by nominal GDP and on a purchasing power parity (PPP) basis is responsible for just under 19% of global economic activity, the largest share for any country in the world, and a significant increase from 2.7% in 1983.1
China’s economic rise has been reflected in the country’s stock markets. In 2003, the collective market capitalisation of Chinese Stocks was USD 1.3trn. By the end of 2023, this had grown over 10-fold to USD 14.9trn. The stock markets are positioned for continued expansion as the market cap to GDP ratio of China (0.8x) converges with that of the United States (1.8x).2
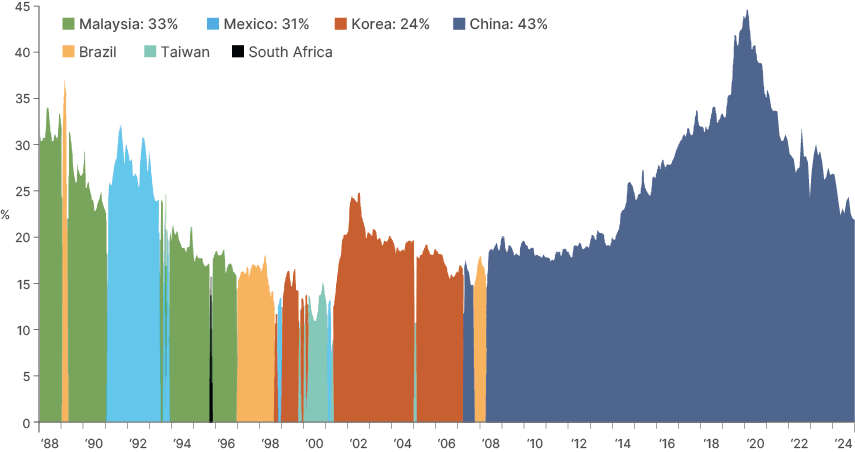
China’s rise in significance has allowed it to, on occasion, have an overwhelming impact on investor sentiment towards the broader EM asset class. In 2008 China became the largest constituent of the MSCI EM Index and was as large as ~40% in 2021. We expect the country to retain an outsized impact, not least given the potential for greater inclusion of China A-Shares (mainland Chinese companies) in the index over time.
Fig 3: Largest MSCI EM constituent
Section 2
Diversification advantages
Single country dominance of an asset class is not always desirable. The impact has been stark in the case of EM and China in recent years. For example, between February 2021 to August 2024, MSCI China fell -47% and cast a shadow on the broader MSCI EM universe which returned -9%. Meanwhile, MSCI EM ex China returned a positive 18%.
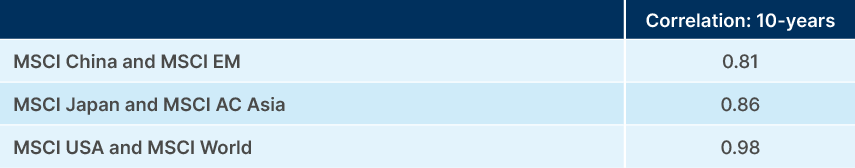
Should we look at other large public equity universes, history is a strong guide for what happens next. Investors manage the dominant market discretely once the country begins to have an overwhelming impact on returns and sentiment over the broader universe. If we examine the 10-year average correlation between China and MSCI EM, it is comparable to what we see with Japan and the MSCI All Country Asia Index, as well as the United States and the MSCI World Index. Japan and the US are typically treated distinctly by global allocators, and China could be next.
Fig 4: 10-year correlation
The attractiveness of managing China separately has not been missed by allocators with the necessary skill and resources. Over the five-year period ending 30 June 2024, assets under management (‘AuM’) in the EM ex-China universe has increased over 900% from USD 3.8bn to USD 35.6bn.3 This is at a time when asset flow towards EM has been lacklustre with AuM in the asset class increasing by just over 1.2%.4
Section 3
The investable universe of EM ex China
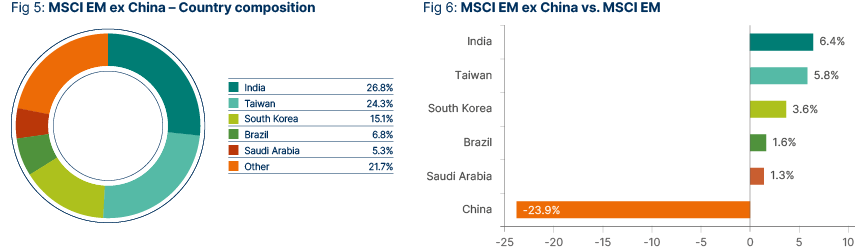
The EM ex China universe is large, broad, deep and liquid. At an index level, MSCI EM ex China comprises around 700 stocks. We would consider the investable opportunity to be larger at around 1,200 companies (ADTV >3m, Market Capitalisation >USD 500m). The market capitalisation of MSCI EM ex-China overall is approximately USD 6trn which is 300% larger than the MSCI China Index (which compromises 600 stocks). The explanation for a comparable number of constituents, yet larger capitalisation is a consequence of the long tail of smaller companies in China A-shares.
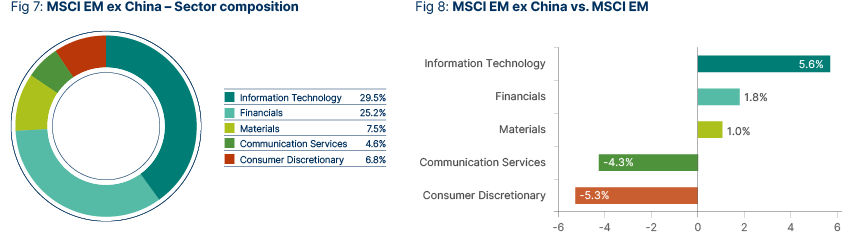
At a country level, by removing China the universe is balanced and gives investors exposure to smaller economies that are often underrepresented in indices. While at the sector level, Information Technology and Financial Sectors increase at the expense of Consumer Discretionary and Communication Services. In the latter case reflecting the absence of large Chinese stocks such as Tencent, Alibaba and PDD.
Significantly, the EM ex-China investment universe is highly inefficient meaning there are ample alpha generation opportunities for active managers. As can be seen in figure 9 (which shows the index and passive ETF percentile performance against Evestment’s EM ex-China Universe), over 50% of managers outperform the index through time, and even more compared to the passive ETF.
Fig 9: EM ex China is inefficient

Section 4
A rich EM ex-China investment opportunity
EM ex-China comprises a large heterogenous universe of economies each with a different balance of growth drivers.
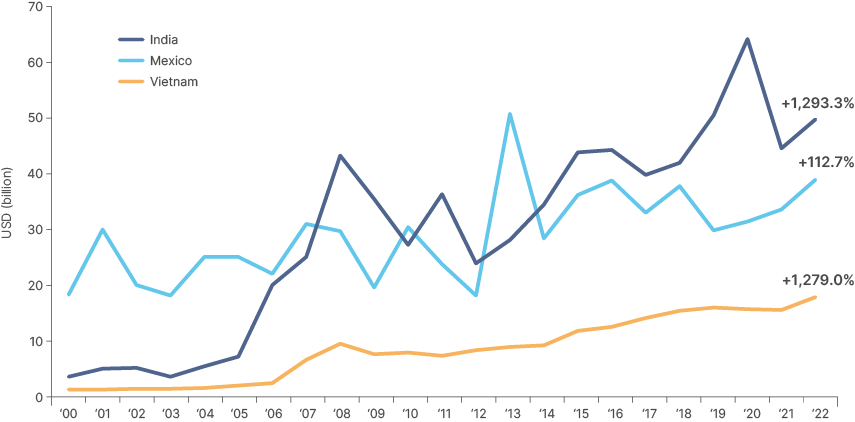
Many countries are underpinned by attractive demographics and wealth accumulation effects as large young populations prosper and ‘emerge’, notably much of ASEAN and Latin America. Several other countries are the prime beneficiaries of supply chain diversification and near-shoring, such as Mexico, India and Vietnam, which have seen a rapid rise in foreign direct investment (FDI).
Fig 10: Foreign direct investment, net inflows (BOP, current USD)
Meanwhile other countries in North Asia are at the epicenter of technology advancement. Taiwan and South Korea are responsible for 50% of the AI manufacturing supply chain.5 Meanwhile, Middle Eastern countries are carrying out ambitious, and well-funded, economic development plans, which can diversify their reliance away from the cyclicality of energy prices to more sustainable and structural growth drivers. India’s economic growth is among the most impressive globally and pro-growth policy and deep institutionalisation means it can be sustained. In emerging Europe countries benefit from greater connectivity and trade with developed Europe and EU accession benefits.
Conclusion
China’s economic strength, idiosyncratic policy and sometimes dominance over broader EM, all create a case for treating China discretely. The EM ex-China investable universe is significant and provides a rich array of attractive investment opportunities and meaningful opportunity for alpha generation for active managers.
1. Source IMF, World Economic Outlook April 2024. GDP based on PPP share of world total.
2. World Federation of Exchange. Stock Market data for China includes the total equity market capitalisation for the Hong Kong Stock Exchange, Shanghai Stock Exchange, and Shenzhen Stock Exchange. Stock market data for the United States includes total equity market capitalisation for the New York Stock Exchange and the NASDAQ.
3. Source: Evestment, Ashmore. AuM for the asset class has been provided for Evestment’s actively managed Emerging Market ex-China universe, and the passively managed iShares MSCI EM ex-China ETF from BlackRock.
4. Source: Evestment, Ashmore. AuM has been provided for Evestment’s actively managed Emerging Market Equity Universe excluding ex-China mandates.
5. Source: Morgan Stanley, July 2023.