

Introduction
Investors are increasingly concerned about overexposure to AI. While the MSCI Emerging Markets (EM) Index is heavily weighted towards technology stocks, those stocks trade at a very significant discount to their US counterparts. Moreover, 60% of the index is not tech. This majority of companies are not growing their earnings at the rate of the tech sector, but are still growing them at an accelerating double-digit clip, comparable with developed markets (DM), but at roughly half the valuation.
EM’s exposure to AI today comes mostly through Korea, Taiwan and China, but AI as an economic force will undoubtedly become more important for EM growth in the coming years, through tech companies and more broadly. In this month’s Emerging View, we present a quantitative framework to assess EM countries’ exposure to both positive and negative AI risk. In our view, AI’s growing influence in EM is also likely to become another source of alpha, at both the country and the industry level, because it will affect EM economies to varying degrees and through different channels.
1. EM AI exposure is large, but offers good value
The EM equity index has always had a changing face. In 2007, it was an index dominated by energy, materials and financials. By 2020, China’s weighting in the index was 40%, led by internet stocks, before dropping to around 20% today. IT was about 13% of MSCI EM in 2019 and is about 41% now, similar to the S&P 500 and above that of the MSCI World (29%). Roughly three-quarters of EM tech is made by three world-class companies. Taiwan’s TSMC is close to 15% of the index and Korea’s Samsung and SK Hynix are together another c. 15%.
EM IT is now 41% of the index...
Fig 1: IT sector weight in MSCI EM, S&P 500 and MSCI World, % of index
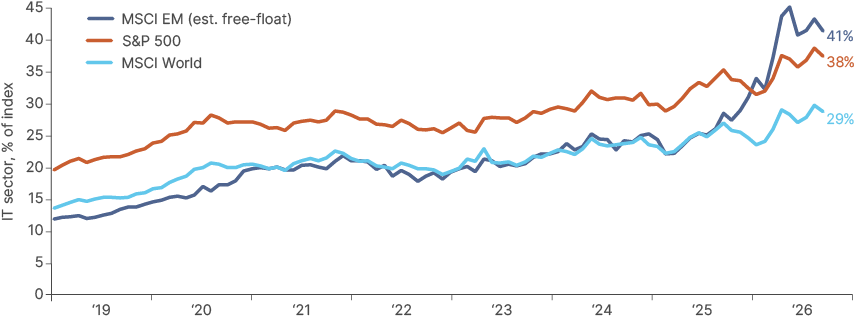
A valuation-driven drawdown in Korea and Taiwan since June has pulled MSCI EM lower, but earnings continue to rise across the board. Index forward earnings are about 20% higher than in June and imply growth of around 60% over the next year. These dynamics have left MSCI EM at 8.6x forward earnings against 17.6x for MSCI World, a relative multiple of 0.49 against an average of 0.74 since 2008, and the lowest in that period. EM tech stocks trade at an even steeper discount.
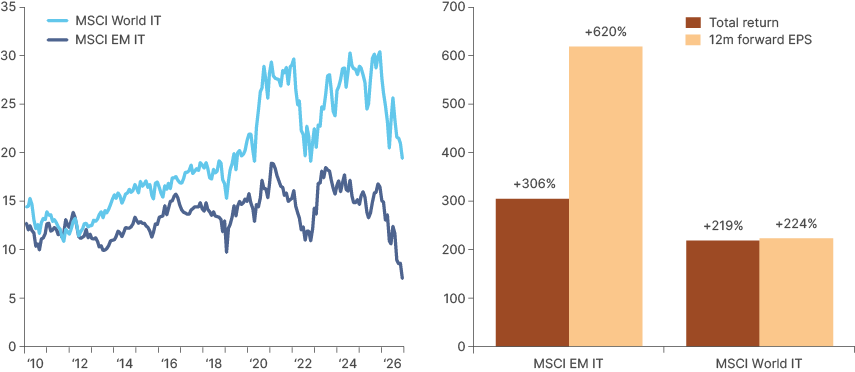
Earnings have outrun prices
EM IT forward earnings are about seven times their end-2022 level (+620%) against a total return of 306%. For developed-market IT (MSCI World IT) the two have moved together: earnings +224%, total return +219%. EM IT now trades at 7.1x forward earnings, the lowest since our data begin in 2005, against an average of 14.1 over that period. MSCI World IT currently trades at 19.5x, close to its own average of 19.9 (Fig 2A).
...yet the sector has never been cheaper
Fig 2: IT sector valuation and earnings, MSCI EM vs MSCI World
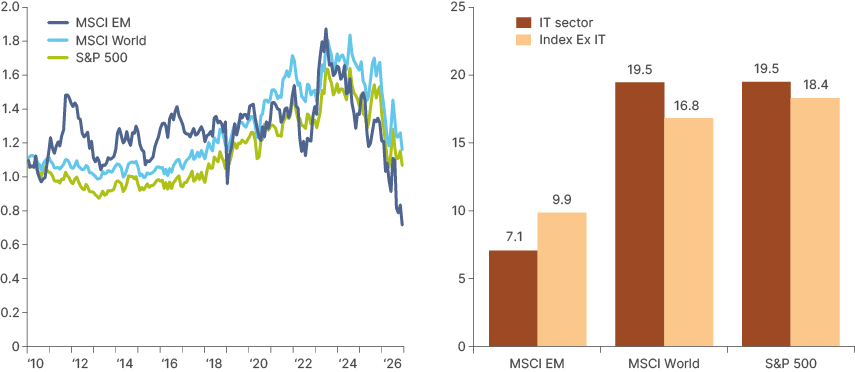
EM tech is also cheaper than the rest of the MSCI EM: 7.1x against 9.9x for EM ex-IT, a relative multiple of 0.72 against an average of 1.28 since 2010, the deepest discount in our data. Meanwhile, DM tech trades at a premium: 1.16x for MSCI World and 1.06x for the S&P 500, a little below their averages of 1.27 and 1.14, respectively, as per Fig 3.
EM tech is also trading at its largest discount to DM in our data
Fig 3: IT sector forward P/E relative to the rest of the index
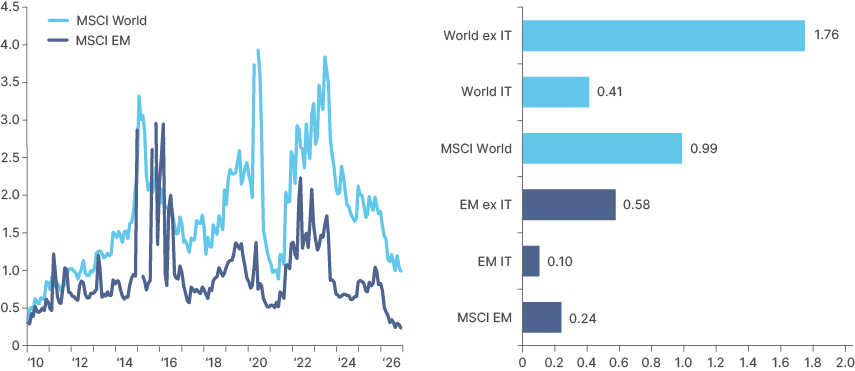
Generally, tech should trade at a valuation premium. The sector has seen, and will likely continue to see, more innovation and stronger growth long term than other industries. AI is supercharging this further. But the discount on EM stocks is arguably not pricing this. On a price/earnings/growth (PEG) basis, which divides forward P/E by consensus earnings per share (EPS) growth across the next two years, MSCI EM is at 0.24 against 0.99 for MSCI World, on expected growth of 36% a year against 18%. For tech alone, the gap is similar: 0.10 against 0.41. Both are the cheapest on this measure since at least 2010.
On a PEG basis, EM tech is even more discounted
Fig 4: PEG ratio, MSCI EM vs MSCI World
The two-year figure is flattered by this year’s memory-driven jump in earnings, which is unlikely to be repeated due to the rapid run-up in memory prices being behind us. Spot DDR5 prices have risen around 5x in the last year. Prices are still going up, but the pace has naturally slowed.
So, as a check we also use year-2 growth alone, which strips most of this effect out. Expected growth is then slightly higher in EM than in DM (15.7% against 13.6%), and EM’s PEG is still well under half MSCI World’s (0.55 against 1.29). And ultimately, we think the risk to earnings growth estimates two years out is heavily skewed to the upside.
The takeaway is that EM is now more of a tech index, but each dollar of AI earnings costs less than half as much in EM as in DM. Ex-technology EM is also far cheaper than the rest of developed markets: 0.58 for EM ex-IT against 1.76 for MSCI World ex-IT (0.88 against 1.97 on year-2 growth).
Why it is cheap, and why that may be too cheap
The low multiple is partially a reflection of mega-earnings, but it also is the market pricing a chip cycle peak. Korean tech is dominated by memory, and memory earnings have been the most cyclical in global equities historically, usually trading on low multiples near the top. However, it is quite possible, in our view, that the AI build-out will materially reduce the cyclicality of chip demand. The marginal buyer is no longer a consumer upgrading an iPhone or a business renewing its laptops but a hyperscaler racing to add capacity responding to exponential demand from agentic AI and robotics.
We would not go as far as saying the industry is no longer cyclical, but the shape of the cycle has likely shifted, and comparisons with the pre-AI era may not be a useful mental model. Because chip prices, particularly memory prices, have risen so much, the risk that aggressive supply expansion leads to oversupply is still real, and high prices may solve high prices in the end. But industry guidance on demand against chipmakers’ expansion plans suggests that is highly unlikely in 2027 or 2028.
Markets are pricing a cyclical peak in EM tech earnings, perhaps prematurely
Beyond that, demand is harder to forecast and Chinese supply, namely from ChangXin Memory Technologies (CXMT), may become a bigger variable, although we expect capacity to be orientated to the domestic market. Higher memory prices, especially high-bandwidth memory (HBM), are also leading companies to look for ways to optimise the architecture of servers to slow down demand and use cheaper forms of memory. It is also leading to innovation, for example high-bandwidth flash and accelerators based on static random-access memory (SRAM). However, it is too early in their design processes to relieve HBM demand, and in fact should they scale, this would likely shift the supply bottleneck, to NAND for example, rather than relieve it. SK Hynix indicated in Q3 earnings that it has more than half of its capacity taken for the next two years and no risk of supply surplus until at least 2030. If its guidance is accurate, there is much upside as the company trades at slightly over 3x earnings. After all, the company delivered USD 62bn operating profit in the quarter, which was close to 10% of its market cap.
At about 7x earnings, EM IT already discounts a sharp fall in chip earnings growth that may not materialise. Since the EM IT peak in June, forward earnings estimates are up 50%, while the index is 30% lower! Bouts of volatility will remain, but the starting valuation gives investors a margin of safety that DM tech does not.
Financial conditions matter too. Should conditions continue to tighten, as they have done in 2026, capital for new projects may dry up and data centre demand would slow. However, the important nuance is that less data centre supply would also keep compute in deficit and likely prolong the overall cycle.
2. EM ex-tech earnings holding up – valuations remain attractive
What about the other 60% of the index? Outside tech, EM forward EPS is up about 15% this year, in line with MSCI World ex-IT (+16%). But EM, again, is much cheaper. EM ex-IT trades at 9.9x, below its own average of 10.7x, while MSCI World ex-IT trades above its own (16.8x against 15.4x). The 41% discount is the widest since at least 2010.
The discount is not only a matter of mix. EM outside tech is heavy in banks, energy and materials, which trade on low multiples everywhere, but EM is also cheaper than DM sector by sector: in nine of the ten sectors outside tech, and by more than its average since 2010 in eight of them. EM industrials trade at 8.9x forward earnings against 21.0x for MSCI World industrials, consumer discretionary at 11.1x against 20.3x, and financials, a fifth of the EM index, at 8.8x against 13.4x.
EM is cheaper than DM in nine of ten sectors
Earnings growth outside tech is broad as well. Since end-June, EM ex-IT forward earnings estimates have risen 6%, in line with MSCI World ex-IT. This year, industrials (+79%), energy (+43%) and materials (+30%) have led, consistent with the AI build-out reaching beyond chips into power equipment and metals, which we return to in Section 4.
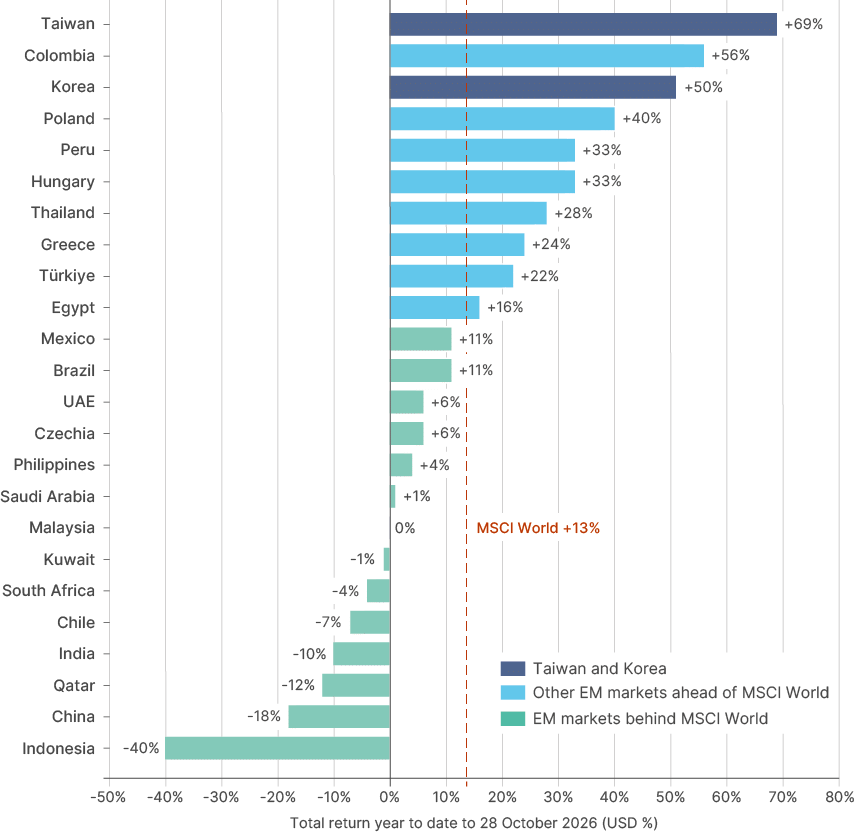
The breadth shows up in country returns. Ten of the 24 markets in MSCI EM have outperformed MSCI World this year (+13%), and eight of them are outside Korea and Taiwan: Colombia (+56%), Poland (+40%), Peru and Hungary (+33%), Thailand (+28%), Greece (+24%), Türkiye (+22%) and Egypt (+16%). Twelve rose more than DM ex-US (+10%), and an equal-weighted average of the 24 markets has kept pace with MSCI World (+13%) despite steep falls in China, India and Indonesia, as per Fig 5.
Equal-weighted, EM has kept pace with MSCI World
Fig 5: MSCI EM country returns year to date, total return in USD
3. AI will reach EM across sectors
The impact of AI on EM economies has been most obvious this year in the huge export revenue gains of chip exporters. These gains have been largest in Taiwan and Korea, but also significant in ASEAN broadly as well as in Mexico. Mexico’s high-tech exports have roughly doubled over the past year, recently surpassing USD 100bn annually to the US.
However, as AI investment and adoption broaden, the impacts on EM economies will become increasingly multifaceted. Commodity exporters will benefit increasingly as the AI build-out adds a structural demand growth vector on top of typical industrial cycles. Countries that are well positioned to absorb foreign direct investment (FDI) in new data centre capacity will benefit from inflows. Countries that adopt AI quickly may reap the rewards of productivity gains.
AI’s impact on EM economies will likely broaden out from tech exports
Of course, AI’s impact on EM will not be positive across the board. AI may prove increasingly disruptive for EM economies that count human capital in services as a key strength. A prime example is India, whose call centres and general tech services offshoring are a significant percentage of GDP and may well be disrupted by agentic AI replacing the need for cheap labour in these areas. The 40% fall in MSCI India IT in dollar terms from its January 2025 high reflects this risk, although the downturn so far has been entirely valuation driven, with sector growth still coming through.
To map countries’ exposure to AI investment and adoption, we scored 25 EM economies across five key pillars. The net score gives us a read of country-level AI exposure in relative terms.
The upside is clear. Demand for electronics, energy, connectivity and the associated commodities is real, happening now and modelled closely by analysts. The output of these goods is simple to measure across countries. The potential negative impacts are more abstract and harder to measure due to the uncertain ways AI will shape labour markets and the potential for countries to offset AI displacement through adoption. This quantitative framework is therefore illustrative of risk skew rather than an attempt at predicting outcomes.
Impact will be positive in most cases, but may skew negative in others
Framework
We score 25 EM countries on four channels through which AI boosts growth and one through which it threatens it. Each indicator is put on a 0-100 scale and combined into pillars by weighted average. The gain score is a weighted average of the four gain pillars; the loss score is the services pillar. The net score is gain minus loss. For investors, the individual pillars matter at least as much as the net score. Macro resilience is shown alongside it, because a negatively exposed country with strong growth and ample reserves is in a different position from one with weak buffers.
| Channel | Weight | Main indicators | Sectors it reaches | |
|---|---|---|---|---|
| 1 | Services exposure | Loss leg | Outsourced services exports % GDP (60%); share of service exports (20%); jobs at risk, IMF method (20%). | IT services, business process outsourcing (BPO), shared-service centres; graduate jobs and urban consumption. |
| 2 | Hardware | 40% of gain | Semiconductor exports % GDP; manufacturing value added % GDP. | Semiconductors, electronics, server assembly. |
| 3 | Energy and materials | 10% of gain | Ores and metals (80%) and fuel (20%) % of merchandise exports. | Copper and metals miners, gas and power. |
| 4 | Adoption | 25% of gain | IMF AI Preparedness Index (50%); fixed broadband penetration (25%); formal employment (25%). | Financials, telecoms, retail, government. |
| 5 | Investment and data centres | 25% of gain | Credible data centre capex % GDP (30%); data centre durability: clean power, grid, connectivity (30%); gross fixed capital formation (25%); FDI (15%). | Utilities, construction, industrials, real estate. |
| Resilience (not scored) | Shown separately | Medium-term growth IMF World Economic Outlook; reserve cover; share of jobs not at risk (IMF). |
Fig 6: AI exposure scorecard: pillar scores by country
| Country | 1 Services | 2 Hardware | 3 Materials | 4 Adoption | 5 Investment & DCs | Gain | Net | Resilience |
|---|---|---|---|---|---|---|---|---|
| Taiwan* | 31 | 100 | 3 | 92 | 50 | 76 | +44 | 47 |
| Korea | 33 | 72 | 8 | 93 | 61 | 68 | +35 | 24 |
| Saudi Arabia* | 10 | 26 | 22 | 79 | 42 | 43 | +33 | 81 |
| Malaysia | 43 | 87 | 12 | 67 | 69 | 70 | +27 | 32 |
| UAE | 21 | 16 | 27 | 85 | 60 | 45 | +24 | 54 |
| Thailand | 21 | 48 | 8 | 44 | 51 | 44 | +23 | 60 |
| Chile | 21 | 15 | 80 | 68 | 50 | 43 | +23 | 24 |
| China* | 33 | 46 | 4 | 77 | 56 | 52 | +18 | 65 |
| Indonesia | 16 | 32 | 25 | 30 | 44 | 34 | +18 | 68 |
| Türkiye | 18 | 28 | 11 | 56 | 38 | 36 | +18 | 41 |
| Vietnam | 31 | 67 | 3 | 26 | 48 | 46 | +15 | 63 |
| Brazil | 27 | 20 | 31 | 50 | 47 | 35 | +8 | 42 |
| Peru | 25 | 20 | 82 | 25 | 32 | 30 | +5 | 65 |
| Mexico | 31 | 34 | 6 | 49 | 37 | 36 | +5 | 21 |
| Nigeria | 8 | 14 | 22 | 0 | 14 | 11 | +3 | 68 |
| Kenya | 20 | 12 | 7 | 9 | 28 | 15 | -5 | 67 |
| Egypt | 29 | 24 | 14 | 25 | 24 | 23 | -6 | 56 |
| South Africa | 36 | 20 | 64 | 41 | 16 | 29 | -7 | 28 |
| Colombia | 32 | 16 | 21 | 29 | 35 | 25 | -8 | 50 |
| Morocco* | 34 | 27 | 8 | 19 | 34 | 24 | -10 | 60 |
| Czechia | 72 | 35 | 4 | 88 | 45 | 47 | -25 | 31 |
| Hungary | 70 | 27 | 4 | 73 | 39 | 39 | -30 | 12 |
| Poland | 83 | 25 | 7 | 74 | 34 | 38 | -45 | 32 |
| Philippines* | 90 | 46 | 15 | 34 | 35 | 37 | -53 | 72 |
| India | 86 | 23 | 13 | 18 | 41 | 25 | -60 | 90 |
Source: Ashmore AI exposure scorecard; IMF, ILO, World Bank, OECD-WTO, national sources; October 2026.
Net = gain − services exposure; scores rounded.
*Jobs measure estimated in part (Taiwan, Philippines, Morocco, Saudi Arabia; China imputed).
Taiwan pillar 5 uses data centre measures only.
15 of 25 countries score positive; the median is +5
Fig 7: AI risk matrix: gain exposure against services exposure
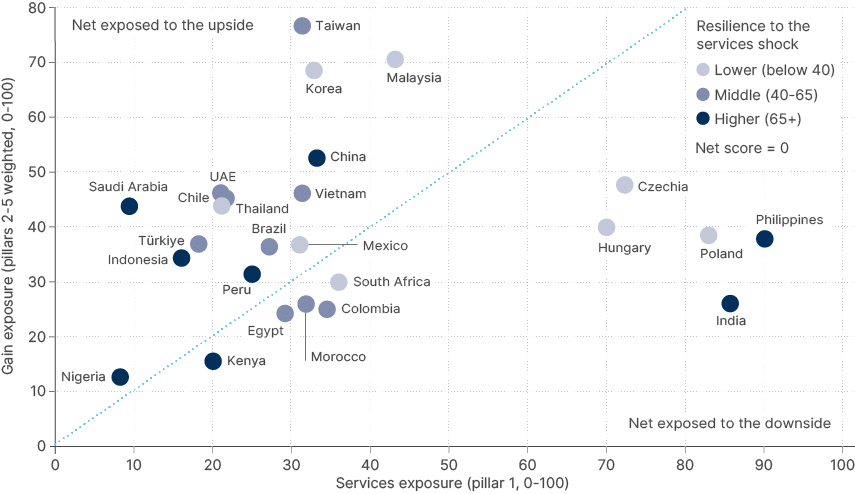
The distribution is skewed to the upside. Out of the 25 countries, 15 score positive and the median country (Peru) scores +5. Gains are broad-based across hardware, commodities, investment and adoption. Losses are concentrated in a handful of economies with large service export sectors built around delivering automatable tasks at a wage discount.
Three country groups emerge. A few large winners (Taiwan, Korea, Malaysia, the Gulf); a broad middle where AI is a modest positive or close to neutral (most of ASEAN, Latin America, Türkiye, Africa), but where the macro drivers likely matter more, and five services exporters with net negative exposure (India, the Philippines, Poland, Hungary, Czechia).
4. The winners & middle group
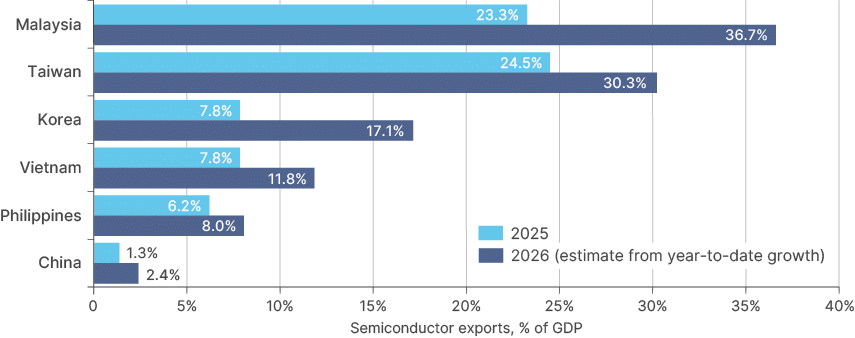
Hardware carries 40% of the gain score, the largest income channel. In 2025, semiconductor exports were about 25% of GDP in Taiwan, 23% in Malaysia, and about 8% in Korea and Vietnam. Memory prices have lifted values sharply since: Korea’s chip exports hit a record USD 60bn in September, up 263% on the previous year. Malaysia’s chip exports rose 82% in the first eight months, and its total exports rose 54.5% in September, led by electrical and electronic goods (+69%), as per Fig 8. Net of chip imports, Taiwan’s 2025 chip trade surplus was roughly 9% of GDP, Korea’s 4% and Malaysia’s 7%, while Vietnam, Thailand and China were net importers, capturing the boom through assembly.
Korea’s chip exports: a record USD 60bn in September
Fig 8: Semiconductor exports, % of GDP, 2025 and 2026 estimate
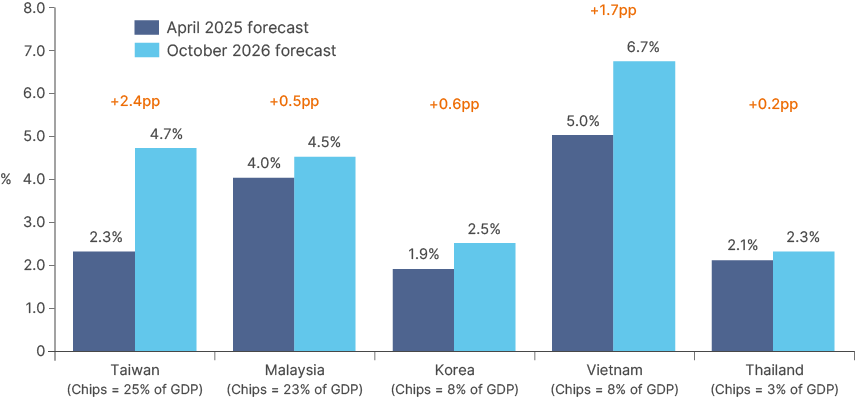
Forecasts from the International Monetary Fund (IMF) reflect the multi-year nature of this build-out. It has revised up 2026-30 average growth by 2.4pp for Taiwan, 1.7pp for Vietnam, 0.6pp for Korea and 0.5pp for Malaysia since April 2025 (Fig 9). Taiwan is forecast to grow 10.7% this year.
The IMF has raised Taiwan’s 2026-30 growth by 2.4pp
Fig 9: IMF forecasts of average real GDP growth, 2026-30, EM hardware exporters
Power, construction and property: the data centre hosts
Data centre build-out follows demand and AI adoption, so will naturally grow alongside compute demand in emerging markets. However, another factor is that US power and permitting constraints are incentivising hyperscalers to build offshore, where reliable, ideally clean, power is plentiful. This trend is likely to accelerate after the US midterm election results, which showed the Democratic Party taking a clear majority in both houses of Congress as well as the governorships of key states for AI build-out, including Texas.
The data centre build-out is accelerating in EM
When considering alternative data centre locations, the World Bank finds power reliability matters far more than its price. For now, we find Malaysia (+27) is the biggest direct beneficiary: credible projects and domestic AI capex are worth roughly 0.56% of GDP a year, more than twice any other EM, and capacity is set to roughly double to 2GW by end-2026. Korea (0.22%), Thailand (0.18%), Taiwan (0.15%) and the UAE (0.11%) follow. Data centres employ few people once built, but the gains flow to utilities, contractors, equipment makers and real estate.
Capital and commodities: the Gulf, Chile, Peru
Saudi Arabia (+33) and the UAE (+24) score on adoption, sovereign investment and data centres with almost no negative services exposure. Humain targets about 3GW by 2030 and more than 6GW by 2034 and Stargate UAE a 1GW campus. The gains accrue mainly to the state. Chile (+23) is a key copper supplier and scores well on clean power. AI adds marginal copper demand, though even a doubling of data centre use by 2030 would be about 2% of global consumption. However, AI is only one of three themes. Energy and defence security and supply-chain resilience are behind a multi-year cycle that should bring miners long-term contracts and FDI.
AI adds an incremental layer of structural commodity demand for exporters
For the middle group (Indonesia, Türkiye, Brazil, Peru, Mexico and others), AI is a modest tailwind through adoption, data centres, assembly or commodities. Their ability to implement structural reforms allowing them to be inserted into global supply chains will be key to boosting their potential across different areas. In Indonesia, the nickel supply chain is key. Türkiye has another opportunity for deeper integration with Europe, particularly through the North Atlantic Treaty Organization (NATO), where technology (and AI integration) will be key for the long term. Brazil is a renewable energy superpower, with a BRL 500bn (c. USD 90bn) data centre capex pipeline. It is a country of continental dimensions and an early adopter of digital technologies, and can benefit from adoption. Mexico’s boom in exports of tech products to the US is compensating for slower growth in the auto industry. Implementing reforms to house a larger share of the supply chain with more value-add locally would be the obvious next step.
5. The downside, and why exposure is not destiny
Net negative exposure is concentrated in India (-60), the Philippines (-53), Poland (-45), Hungary (-30) and Czechia (-25). All five have large, outsourced services sectors serving foreign clients, worth about 6-7% of GDP in India and the Philippines, and 4-5% in Central Europe. This work was outsourced to cut costs, so the risk is that clients look to cut costs further via AI. The Philippines gets the highest loss score (90) because call centre work is the most substitutable. India combines a high loss score with weak gain pillars. Strong adoption potential offsets part of the risk in Central Europe.
AI downside exposure is real, but it’s not destiny
An important nuance is that while the sectors look relatively small against the whole economy, they are larger against the pool of graduate jobs. India’s tech workforce is about 6 million (about 1% of employment) but a leading graduate employer, while the Philippines’ AI IT and business process management (IT-BPM) sector employs 1.9 million (4%), another key source of well-paid graduate employment. A rise in graduate unemployment is a social risk as well as an economic one, raising risks of social discontent and brain drain. However, there are various paths to this negative outcome being mitigated.
What has happened so far
Markets have priced the risk through valuations: MSCI India IT is down roughly 40% in dollar terms from its January 2025 high, while its forward earnings have risen 14%. But so far, there is little sign of AI-driven job losses in Indian tech. Employment in India’s IT and business-process sector rose from 5.4 million in FY24 to around 6.0 million in FY26, according to the National Association of Software and Service Companies (NASSCOM). The slowdown in hiring at the large IT firms since 2023 mostly reflects the unwinding of a post-COVID hiring boom. The five largest employers (TCS, Infosys, Wipro, HCLTech and Cognizant) added about 286,000 staff in FY22, cut about 68,000 in FY24 as demand normalised, and have added a net 16,000 or so since. Part of the recent restraint also reflects restructuring, including job cuts of about 2% at TCS in FY26 and reorganisations at HCLTech and Cognizant.
Hiring has also shifted toward global capability centres (GCCs), the in-house technology and operations hubs that multinationals run in India. GCC headcount has grown roughly 10% a year to around 2.3 million, more than a third of the sector’s workforce. Some clients appear to be replacing higher-cost staff at home with lower-cost staff in their own Indian centres, while taking productivity gains from AI.
AI has not disrupted Indian tech services hiring so far, but boosts revenue per employee
Job-postings data tell a similar story. The Naukri JobSpeak index of new listings is back on its pre-COVID trend after the 2021-22 boom. IT-software postings are above pre-pandemic levels, though still below their long-run trend, while postings in business process outsourcing (BPO) and IT-enabled services, often cited as the most exposed to AI, are at a record high. Fresher hiring at the large firms has fallen from its FY22 peak but, on management targets, is broadly back to pre-boom levels in FY27, with Wipro the exception.
Where AI is showing up is in productivity, growth and pricing. India’s four largest IT firms have grown dollar revenue about 12% since mid-2022 while headcount fell about 2%. Revenue per employee at TCS, Infosys, HCLTech and Cognizant has risen 11-16% from its 2023 low and is back near or above its previous highs, after rising slowly, if at all, for most of the previous 15 years (Fig 10). Revenue growth itself has slowed to 1-3% a year, and analysts expect prices to fall by around 3.5% as contracts are renewed with AI built in, holding sector growth near 3% against a ten-year average of 5%.
In the Philippines, the outsourcing industry earned about USD 40bn and employed about 1.9 million people in 2025. In July, its industry body, the IT and Business Process Association of the Philippines (IBPAP), cut its 2028 targets from USD 59bn of revenue and 2.5 million jobs to about USD 47bn and 2.0 million (mid-points of its new ranges), citing AI. In its downside case, the sector would employ fewer people in 2028 than it does today. HSBC finds no collapse yet, however: employment and business-services exports are still rising, though more slowly than before COVID.
Fig 10: Revenue per employee at the five largest Indian IT employers, USD 000
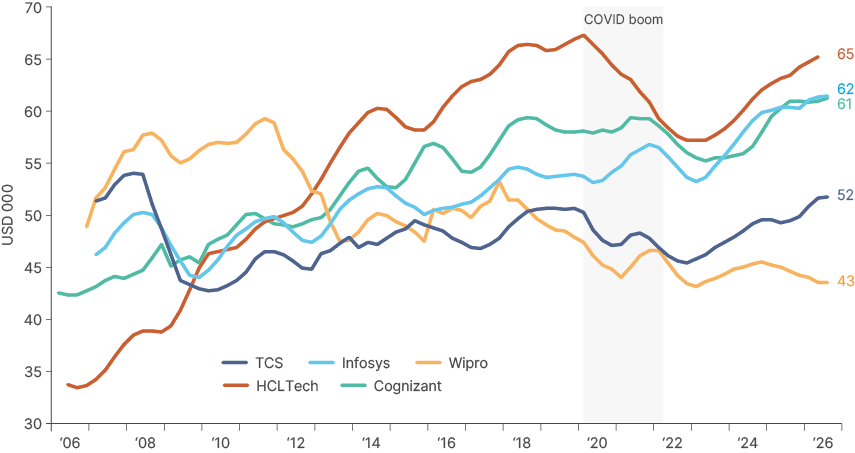
So far, AI has slowed hiring at the large IT firms, especially of graduates, while total employment in the sector has kept growing. The larger risk to GDP is that clients pocket AI savings as lower prices without buying more work. That would show up as falling dollar revenue at the big firms, which is the number to watch.
Exposure is not destiny
There are a few factors that suggest this negative exposure may not end up being translated into economic and asset price downside.
The first is the possibility that AI adoption and productivity growth in tech service industries offsets job disruption or loss of business via clients reshoring. The World Bank finds that South Asia’s exposed jobs are mostly complementary to AI: only 7% of jobs in the region combine high AI exposure with low complementarity, against 15% elsewhere.
They also find that AI skills already command a wage premium of nearly 30%. Indian IT is turning AI into revenue (about USD 3.1bn a year at TCS, over 10% of sales), and an AI-enabled Indian firm still costs less than an AI-enabled British or American one. Adoption is rising fast: the share of Indian firms using AI went from near zero in mid-2024 to 23%. US firms with more AI exposure have also expanded links with South Asian suppliers and the World Bank finds reshoring is not the dominant effect. Again, the open question is whether new work grows fast enough to offset price deflation on the old.
If AI does disrupt certain sectors, growth in others may more than offset
The second key point is economic resilience and growth in non-tech sectors. In many cases, non-tech growth may more than offset any loss in tech or business services momentum. India is the most resilient economy in our sample, with GDP growth near 7% driven by domestic demand, foreign exchange (FX) reserves covering nearly eight months of imports and only about 10% of jobs at risk on the IMF measure. The Philippines also scores highly at 72, again due to higher GDP growth.
India is also a data centre beneficiary in its own right. Operational capacity is about 1.6-1.8GW (JLL; Cushman & Wakefield), with record-low vacancy and most new supply pre-let to hyperscalers. Forecasts put capacity at 6-10GW by 2030 and investment at around USD 200bn, about 4-5% of GDP over five years. That makes India one of EM’s largest data centre markets, but relative to its economy, the build-out is still a fraction of Malaysia’s, where capacity is already roughly ten times larger as a share of GDP.
Central Europe scores low on economic resilience (12-32), mainly on slower growth, but the measure misses EU membership and the European defence and infrastructure cycle, which cushion Poland, Czechia and Hungary.
Overall, we think it likely that AI disruption will not materially affect growth. The services pillar measures exposure, but revenue can hold up if clients buy more work or firms move up the value chain. Innovation and productivity gains from AI will also likely create new jobs in other industries, potentially more than offsetting losses in information and communications technology (ICT) services roles (such as software engineering) over the long run.
Passive versus active
The argument for favouring active over passive management in EM equity is simple to make. The consistently larger dispersion of country returns relative to MSCI World, as well as information asymmetry for less well-researched companies in these markets, means the scope for outperformance is simply greater. Historical data has proven this; EM managers have outperformed benchmarks far more frequently than DM peers in recent years.
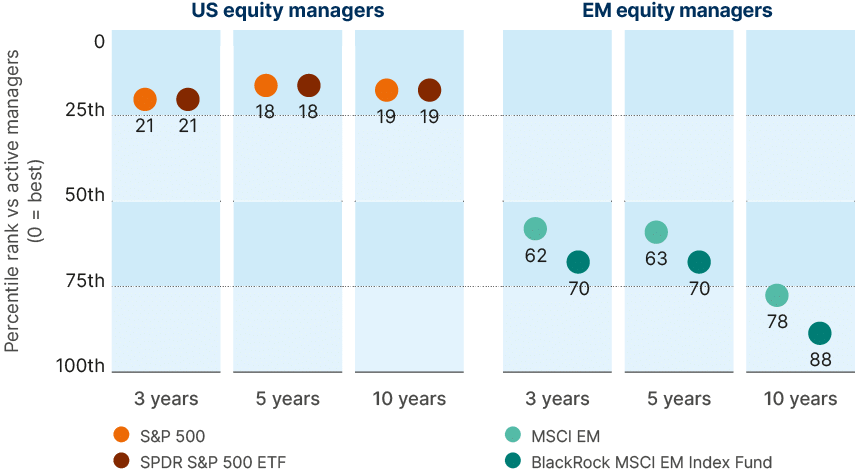
The S&P 500 has outperformed around 80% of US equity managers over three, five and ten years. MSCI EM, by contrast, has ranked between the 62nd and 78th percentile of EM equity managers over the same periods, and the largest passive EM fund lower still: over ten years, close to 90% of EM managers have beaten it (Fig 11).
88% of EM managers beat the largest passive fund over 10 years
Fig 11: Percentile rank of index and passive funds against active managers, US and EM equities
The impact of AI on the index makes active advantage even larger in our view, for two key reasons. First, there are alpha opportunities from the uneven impact of AI across EM economies, which is reflected in our scoring method, and across companies, with those best able to cut costs and target revenues using technology at a competitive advantage.
Second, a passive allocation now gives investors exposure of close to 30% of the index to just three stocks: TSMC and the two Korean memory giants. However, this may miss smaller companies, or off-index stocks, which are entrenched in the same supply chains yet may offer much more value compared to globally well-owned mega-cap stocks. There are also a number of indirect ways for an active manager to benefit from the tailwinds of an AI cycle; for example, around power generation, thermal management and the associated infrastructure, as well as raw materials.
AI exposure in EM presents alpha generation opportunities...
For now, we think selective exposure to EM AI giants is ultimately attractive. It comes at around 7x earnings and is pricing a cyclical peak in earnings which may not arrive. However, the sector remains prone to sharp swings in earnings and sentiment, as the valuation drawdown in Korean stocks over the past four months shows.
If new negative information around AI investment leads to earnings estimates being cut, a passive investor rides the downgrades all the way down. An actively managed portfolio can pivot away to the various attractive opportunities in EM ex-tech, an area growing earnings at DM pace for about half the price. Many companies in these sectors also sell into the same AI build-out through less volatile channels than semiconductors: power, construction and metals.
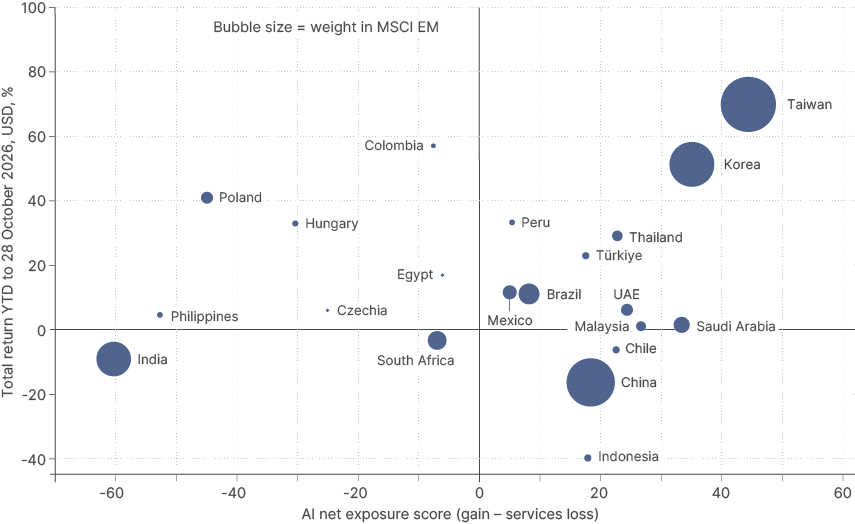
So far this year, AI exposure has explained very little of EM country returns outside North Asia. The correlation between our AI net score and year-to-date returns across 21 MSCI EM markets is 0.09 (Fig 12). It falls to -0.21 excluding Taiwan and Korea. Outside North Asia, oil, rates, politics and valuation have driven returns. In EM, dispersion is always the opportunity for active managers.
...but YTD it explains little of EM returns outside North Asia
Fig 12: AI net exposure score against year-to-date return, 21 MSCI EM markets
Concentration cuts both ways. Active management is harder in a narrow bull market: the 10% single-stock cap in Undertakings for Collective Investment in Transferable Securities (UCITS) funds forced underweights in TSMC that were costly in 2025 and early 2026. On the other hand, the June reset – and the rotation since – are the kind of environment in which breadth starts to pay.
Summary & Conclusion
Emerging markets provide exposure to a diverse array of countries and earnings drivers. However, there is no escaping the fact that AI is likely to become an increasingly influential force in EM equity returns, in North Asia and beyond. Most EM economies are likely to benefit from the AI investment wave, via tech hardware or through other channels, such as commodity exports or data centre investment. Some may be more challenged by AI-driven disruption to their services sectors, although the extent of that disruption remains highly unpredictable. Countries like India that look exposed to AI disruption have the opportunity to offset the risk through AI adoption. Macro factors such as economic resilience and reform may also prove more important than AI-driven risk. That could leave value opportunities in sectors that sell off in anticipation of lower earnings that do not materialise, as in India today.
In our view, the best way to navigate these rapidly evolving dynamics is active management. Active management in EM has historically had a high success rate because of the dispersion between countries (Fig 11), and AI is likely to widen that dispersion, providing further opportunities to generate alpha.