

Emerging market local currency (EM LC) bonds have been among the best-performing fixed income asset classes over the past three years, but remain under-owned and often misunderstood. Real yields are close to 15-year highs, even as the benchmark J.P. Morgan GBI-EM Global Diversified Index is now investment grade (IG) on average. Beneath that average, attractive high-yield (HY) opportunities remain, both in the index and off-benchmark.
The wide range of idiosyncratic country stories offers ample scope for active alpha generation, in our view, particularly while EM currencies remain broadly cheap against an overvalued dollar.
EM LC bonds are investment grade on average, but high yield opportunities exist
Investors tend to instinctively associate EM with HY credit risk. With respect to EM LC this is a false assumption. Although the asset class currently yields 6.5%, just 40 basis points (bps) inside European corporate high yield bonds, its profile is far closer to investment grade.
JPMorgan’s GBI-EM Global Diversified Index (GBI-EM GD) only includes countries with large, liquid, accessible domestic bond markets. Country weights are capped at 10%, but the total outstanding debt stock of eligible countries today exceeds USD 14trn. This dwarfs the c. USD 3trn EM external debt universe.
The weighted average rating in the universe is ‘BBB’, as 79% of the assets are IG-rated. The index has higher credit quality than the hard currency EMBI Global Diversified Index, where almost half is sub-IG. Asia accounts for close to half of the index, anchored by China, Indonesia, Malaysia, Thailand and India – economies with strong external positions with credible central banks.
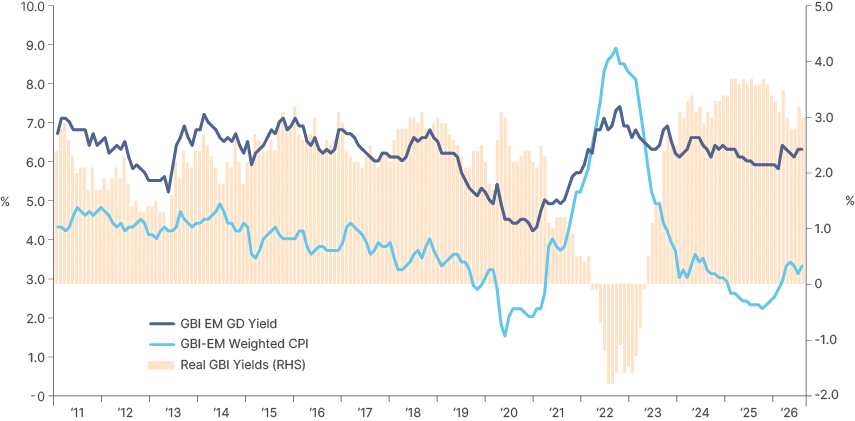
Despite the IG profile, yields are attractive: c. 6.5% yield-to-maturity (YTM), with real yields (GBI-EM GD yields net of index weighted inflation) running at 3.4%, close to the 15-year highs reached in early 2025. Real yields against one-year forward inflation expectations (ex-ante real yields) are running at 3.0%, also close to historical highs.
Fig 1: GBI EM GD real yield
The opportunity is not limited to the benchmark
Most investors in the asset class are benchmarked against GBI-EM GD. However, opportunities to generate asymmetric alpha in off-benchmark countries are plenty, both in rates and FX. The average nominal yield in off-benchmark countries is close to 10.5%, against 6.5% expected inflation over the next year. This gives an ex-ante real yield of 4%, versus 3.0% across the GBI-EM and only 1.2% in the GBI developed market (GBI-DM) index.
Fig 2: Summary: Asset Class and Region
| 1-Yr Govt | 1-Yr CPI (est) | 1-Yr CPI Real | |
|---|---|---|---|
| GBI EM | 6.3 | 3.3 | 3.0 |
| EM off-bmk | 10.5 | 6.5 | 4.0 |
| Latin America | 10.0 | 6.0 | 4.0 |
| EM Asia | 5.3 | 3.7 | 1.6 |
| CEMEA | 11.1 | 6.5 | 4.6 |
| DM | 3.1 | 2.5 | 0.6 |
| GBI DM | 3.6 | 2.4 | 1.2 |
EM and DM are simple average. GBI EM/DM are weighted by index weight.
Source: Bloomberg, Ashmore. Data as at 22 September 2026.
The benchmark’s heavy weighting to large, lower-yielding Asian IG names masks wide dispersion in real yields at the country level, both within the index and beyond it (Fig 3). This means active managers can aim for higher ex-ante real yields than the benchmark.
Fig 3: Ex-ante real yields by country (%)
| Group | Country | 1-Yr Govt | 1-Yr CPI (est) | 1-Yr Ex-ante Real |
|---|---|---|---|---|
| EM | Türkiye | 39.1 | 23.9 | 15.3 |
| FM | Egypt | 24.5 | 11.9 | 12.6 |
| FM | Ukraine | 16.8 | 7.4 | 9.4 |
| EM | Brazil | 13.6 | 4.3 | 9.3 |
| EM | Colombia | 13.3 | 5.4 | 8.0 |
| FM | Kazakhstan | 16.2 | 9.0 | 7.2 |
| FM | Angola | 16.0 | 8.9 | 7.1 |
| FM | Argentina | 29.9 | 22.8 | 7.1 |
| FM | Nigeria | 19.7 | 13.1 | 6.6 |
| FM | Uganda | 11.0 | 5.1 | 6.0 |
| FM | Uzbekistan | 12.0 | 6.8 | 5.2 |
| FM | Sri Lanka | 9.9 | 4.8 | 5.1 |
| FM | Senegal | 7.9 | 3.0 | 4.9 |
| EM | Dominican Republic | 8.9 | 4.4 | 4.6 |
| EM | Indonesia | 6.8 | 2.9 | 3.9 |
| EM | South Africa | 7.6 | 3.7 | 3.9 |
| FM | Namibia | 7.8 | 4.0 | 3.8 |
| EM | Mexico | 7.4 | 3.8 | 3.6 |
| FM | Pakistan | 11.9 | 8.5 | 3.4 |
Source: Bloomberg, Ashmore. Data as at 22 September 2026.
Note: darker blue shades are GBI-EM GD index countries.
Defaults are rare
Sovereign issuers rarely default on local currency debt, including in EM. Instead, they can raise taxes domestically or ‘deflate’ the debt via inflationary policies. In the modern era, the only notable defaults in local currency bonds were Russian debt following the 1998 debt crisis, Argentina in 2019, as well as Ghana and Sri Lanka in 2023 DDO. Russia again defaulted on foreign creditors in 2022, prevented from servicing its debt obligations following US sanctions after the Ukraine invasion.
EM FX risk outlook skewed positive
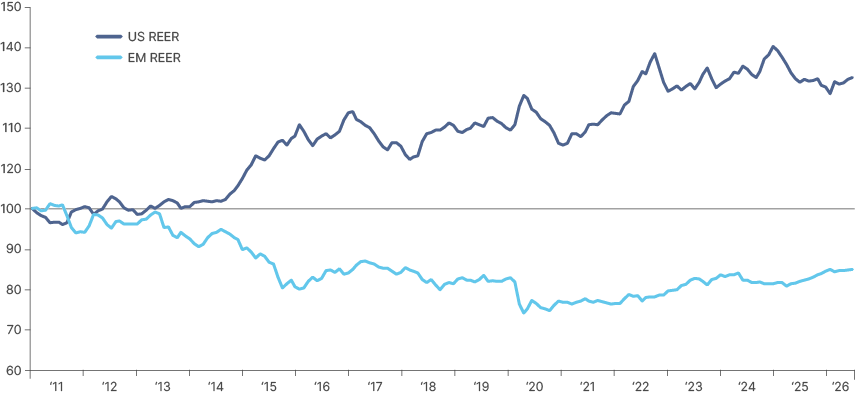
For much of the post-2013 era, the performance of EM currencies was a drag on total returns. But in our view, we may have now entered a different paradigm for EM FX. The re-evaluation of ‘US exceptionalism’ in 2025 drove a 10% DXY decline in H1 2025 and has structural legs.
The combination of expensive equity valuations, a USD 26trn net international investment liability, a 5.5%-6.0% of GDP fiscal deficit and US President Donald Trump’s unpredictable policies are a strong recipe for a weaker Dollar, in our view. The result is growing appetite for diversification among both private and public sector investors – and ultimately, it is diversification away from bloated USD portfolio holdings, which may be the most powerful catalyst of all.
Higher US rates, driven by this year’s rise in energy prices and the recent spike in US Treasury yields, have temporarily halted the Dollar’s decline. However, the USD remains overvalued in real terms, while EM currencies have not recovered after declining from 2012 to 2022. EM local currency debt provides exposure to 20 currencies (if confined to the GBI-EM GD), offering not only negative Dollar beta, but also access to currencies supported by strong idiosyncratic drivers. Although EM FX can be volatile, a diversified EM FX basket had led to lower volatility than the (G7) DXY index in more than half of the calendar years since 2000.
The decline in volatility is backed by improving institutional credibility and performance. EM central banks were ahead of the curve in raising rates in 2021 and 2022 and are now benefiting from this policy discipline. Despite the ongoing energy and supply shock emanating from the Hormuz disruption, the GBI-EM GD weighted consumer price index (CPI) remains at just 3%, which explains why most EM central banks are not increasing rates as DM central banks are. High real rates leave ample room for EM policy easing once energy prices decline again. In 2025, FX contributed 8.3% to the GBI-EM GD’s 19.3% total return. As impressive is the fact that EM FX is down just 0.5% year-to-date (YTD) despite significant macro headwinds (tariffs, energy shock, Fed hikes).
Fig 4: US REER vs EM REER
Opportunities are varied
Unlike the hard currency EM universe – dominated by US Treasuries and credit exposure – local markets are driven by domestic monetary policy, inflation and reform stories. The diversity of the index provides ample opportunities to diversify away from any regional bias.
Asian economies are largely oil importers. The terms of trade shock alongside capital account outflows explain the currency weakness rather than any major deterioration in fundamentals. External balances remain strong, particularly for North Asian exporters, and currencies remain historically cheap. The strengthening RMB trend and a likely turnaround of the JPY will support Asian currencies over the next year, in our view. On the rates side, inflation remains low across most of the region. Should oil prices fall sustainably following normalisation of the Strait of Hormuz, improved terms of trade would support currencies and anchor rates.
In Latin America, elevated real rates leave substantial room for cuts when the energy price shock reverses. Strong commodity demand driven by structural themes such as AI capex continues to support current accounts and FX. This is a a promising setup for local currency returns. A decisive political shift from the left to a market-friendly, reform-oriented right adds another powerful catalyst. The Brazilian election will be pivotal to determine how much rates can decline. Mexico offers healthy real rates plus potential upside from fiscal discipline and the trade flows from the US-Mexico-Canada Agreement (USMCA). Colombia’s political shift to the right will bring a sharp fiscal adjustment, while Chile and Peru offer high-quality IG exposure to the same centre-right, consolidation-led theme. Argentina rounds it out with very high nominal yields and a bet on continued disinflation under President Javier Milei’s reform agenda.
In Eastern Europe, CEE currencies correlate closely with the Euro. The EU’s defence investment programme – SAFE (Security Action for Europe, EUR 150bn) and other EU funds – represent the largest fiscal impulse for these countries since their respective EU accessions. Poland is the standout beneficiary: defence spending is approaching 5% of GDP, nearly EUR 45bn from SAFE, and the central bank (NBP) is expected to cut rates, potentially boosting returns along the curve. Hungary is committed to joining the Euro Area and adopting the EUR, which will demand structural reforms in procurement and lowering the inflation target. Romania’s ongoing fiscal consolidation provides a market-friendly backdrop. For investors seeking European recovery exposure with higher carry, CEE local markets could be an efficient proxy.
In the Middle East and Africa, South Africa’s reforms are beginning to bear fruit, improving power stability, easing logistics bottlenecks and potentially restoring the country’s investment-grade rating in the coming years. The lower 3% inflation target should also support structurally lower interest rates. Saudi Arabia’s potential inclusion in the GBI-EM GD would add a high-quality, low-volatility market and improve index diversification. While oil prices stay elevated, energy dependence will remain a key driver of macro outcomes, and net exporters should continue to outperform.
Key Risks: El Niño and continued Hormuz supply shock
Though most EM economies have held up surprisingly well against the energy shock emanating from Hormuz disruption, the external environment could worsen from here. Because food makes up a large part of consumer spending in EM, macro conditions can deteriorate if food inflation rises sharply. For now, this remains a risk rather than a reality. Despite fears that reduced fertiliser exports from the Gulf would lead to much higher food prices, food inflation has been slowing down so far in 2026.
Fig 5: EM headline vs food inflation (% YoY)
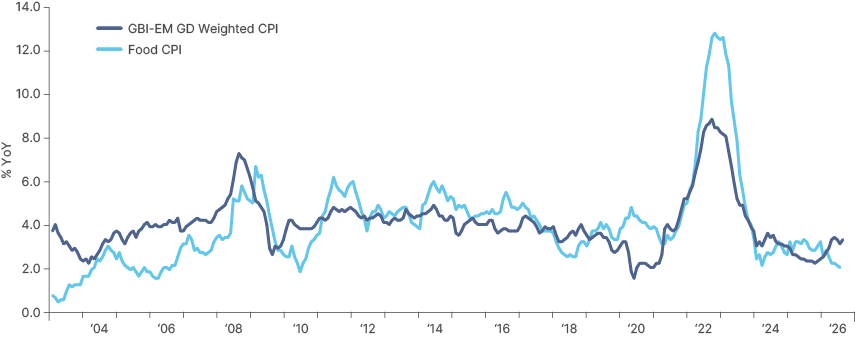
However, the key risk is continued fertiliser supply disruption around the upcoming planting season in the southern hemisphere, followed by a ‘super El Niño’ that keeps food inflation elevated into 2027. The World Meteorological Organization now expects a historic event, peaking around the end of 2026 with impacts extending well into next year.1
That said, EM central banks go into this from a position of strength. High real rates provide a pre-existing policy buffer against a supply shock. The impact would also not be uniformly negative across the index. Some markets are more exposed than others, and some agricultural exporters stand to benefit. That is where active management can help mitigate the downside.
Performance has gone unnoticed
The GBI-EM GD delivered 19.3% in 2025, with a return-to-volatility ratio above five – the highest in the index’s history (long-run average: 0.55). Over three years, annualised returns of c. 10.5% led to a cumulative outperformance over the Global Aggregate of 20%. Fifteen of the 20 index countries posted returns above 10% in 2025.
Returns have been more modest this year, as the disruption of the Strait of Hormuz has created adverse macro conditions for EM FX and rates. However, outperformance relative to developed markets has persisted. The strong carry in the index has more than offset negative duration returns, with the index up 2.2% YTD, versus -1.3% for the Global Aggregate bond index. EM FX has held up well, down just 0.5% in 2026 even as the USD index is up by 2.6%. In our view, the resilience of EM LC against strong headwinds in 2026 reflects the asset class’s qualities. More so, we would argue, than another year of double-digit returns in easy macro conditions, which is what we had expected coming into 2026.
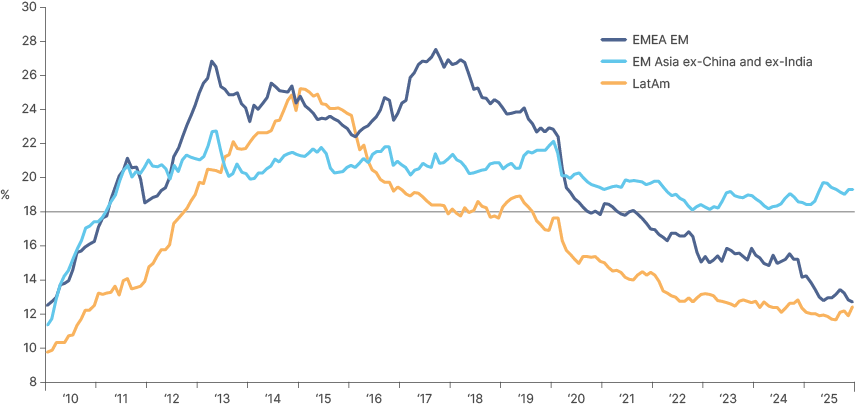
Yet, EM LC remains structurally under-owned. Foreign investors were net sellers in 2023 and 2024, with just USD 8.3bn of inflows in 2025 (1.8% of net asset value). At USD 14trn, the market is ten times its size of two decades ago, with growing domestic pension and insurance universes providing a durable local bid as foreign investor participation declined over the last decade.
Fig 6: Foreign ownership of EM local debt (%)
The forward-looking setup is asymmetric. A scenario analysis shows 15.7% total returns in a soft landing (‘goldilocks’), against a decline of only 0.6% in a no-landing (‘AI growth’) scenario where EMFX drops by 5%. A global economy slowdown can yield returns close to 13.8%, assuming flat FX returns.
Fig 7: EM Debt Scenarios
| Economic Scenario | Current Levels | 10-year UST Level | 1-year Return Scenario | ||||||
|---|---|---|---|---|---|---|---|---|---|
| 10yr UST | 7.7 | 5.18% | – | 4.50% | 5.50% | 3.75% | 10.4% | 2.7% | 16.2% |
| Asset Class | Duration | Yield | Spread | Goldilocks | AI Growth | Slowdown | Goldilocks | AI Growth | Slowdown |
| Spread Change Over 1yr | 1yr Annual Return Scenarios | ||||||||
| EM USD Sov (EMBI GD) | 6.2 | 6.98% | 216 | -34 | 16 | 228 | 12.7% | 4.0% | 0.5% |
| USD Sovereign IG | 6.8 | 5.93% | 140 | -20 | 10 | 150 | 11.8% | 3.1% | 5.2% |
| EM USD Corp (CEMBI BD) | 4.3 | 6.69% | 189 | -41 | 19 | 257 | 10.5% | 4.2% | -0.5% |
| USD Corporate IG | 4.7 | 6.13% | 133 | -14 | 6 | 135 | 10.0% | 4.3% | 5.7% |
| Local Currency | Duration | Yield | LC Yield & FX Change | 1yr Annual Return Scenarios | |||||
| GBI EM GD | 5.2 | 6.47% | Yld Chg | -0.7% | 0.3% | -1.4% | 15.7% | -0.6% | 13.8% |
| FX Chg | 5.0% | -5.0% | 0.0% | ||||||
Source: Bloomberg, Ashmore. Data as at 22 September 2026.
*Default Assumptions: Base Case = Average of 10yrs Bear case: Worst 10yr Bull case = Best 10yr (Rolling 5yr defaults).
Conclusion
EM local currency debt offers a rare combination: an investment-grade average rating, real yields close to their highest in 15 years, and currencies that remain cheap against an overvalued US dollar. The asset class has already shown its resilience in 2026, holding up through an energy shock that has weighed on DM bonds, while the policy discipline of EM central banks leaves room to cut once energy prices stabilise.
A prolonged Hormuz disruption and a food-price shock are the key risks to monitor, but our scenario analysis points to an asymmetric payoff. With foreign investors still structurally underweight, we believe the opportunity from here remains compelling. Waiting for a better entry point risks falling behind the curve.